Application of a mathematic model to evaluate the impact of temperature to plankton development processes in the pangasius (Pangasianodon hypophthalmus) production pond in Viet Nam
Abstract. Pangasius (Pangasianodon hypophthalmus) (catfish) is a popular food in many
countries around the world as well as in Viet Nam. At the same time, Pangasius also brings
great economic benefits from the exportation. However, unplanned catfish farming leads to
environmental degradation, susceptible to disease and high consumption of water. Modeling is a
solution that helps to better control the biological processes in the pond, optimizes feed supply
and water use. In this study research data collected, measured and analyzed from experimental
catfish ponds in Can Tho, together with comparative data sets from other related studies were
used to simulate the nutrition and development processes of fish in the ponds. The mathematic
equations of plankton development processes were built and solved by the fourth-order RungeKutta method and coded in the Matlab programming language. The phytoplankton simulated and
corrected at 28 and 30 oC showed that blue algae is the most grown algae (> 16 g/l) followed
by green algae (> 13 g/l) and finally diatoms (> 11 g/l). The ratio of nitrogen is biggest for
blue algae (~ 0.141), then green algae (~ 0.132), and finally diatoms (~ 0.125). Meanwhile, the
ratio of phosphorus is highest for diatoms (~ 0.05), then green algae (~ 0.043), and finally blue
algae (~ 0.005). Among the two investigated temperature points, it is shown that both Copepods
and Cladocerans were strongly developed at the lower temperature of 28 oC which is close to the
ideal development temperature for zooplankton.
Trang 1
Trang 2
Trang 3
Trang 4
Trang 5
Trang 6
Trang 7
Trang 8
Trang 9
Tóm tắt nội dung tài liệu: Application of a mathematic model to evaluate the impact of temperature to plankton development processes in the pangasius (Pangasianodon hypophthalmus) production pond in Viet Nam
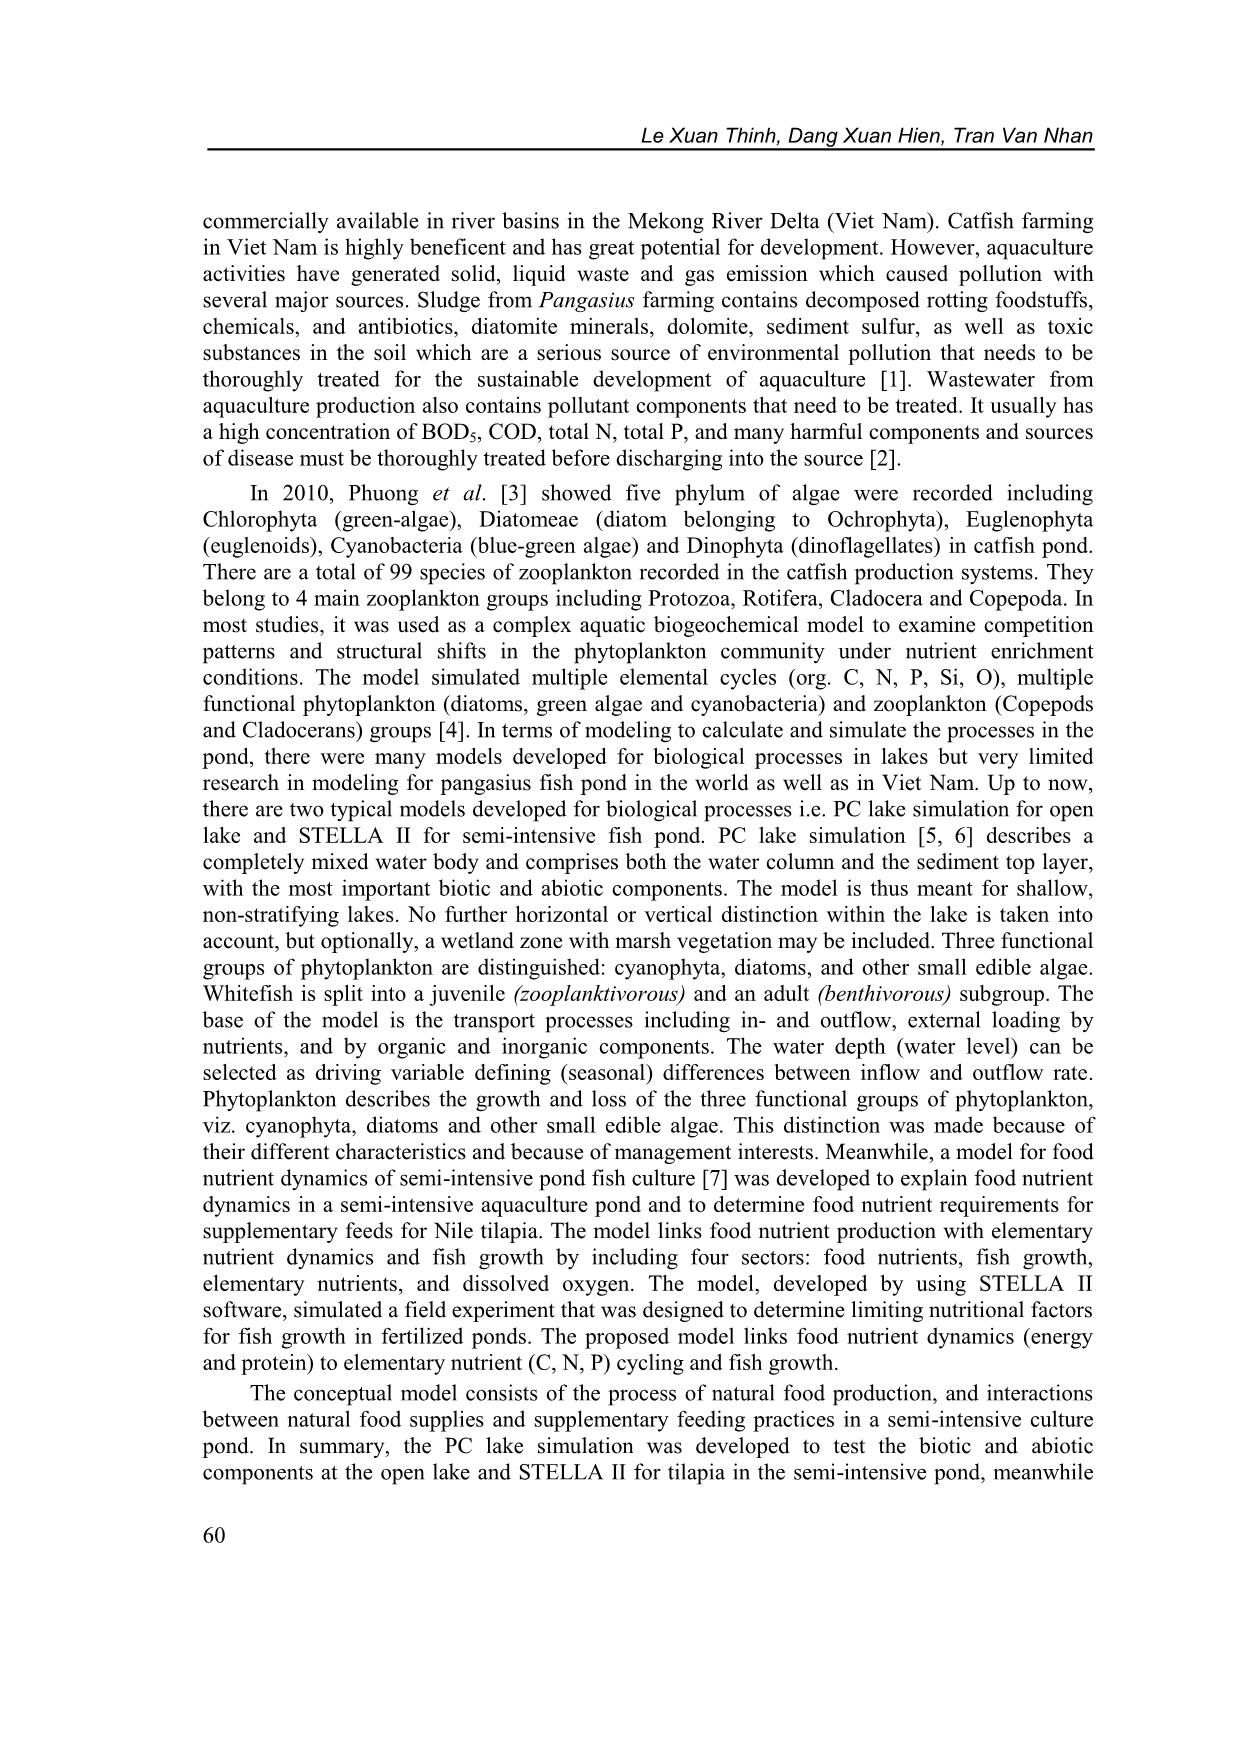
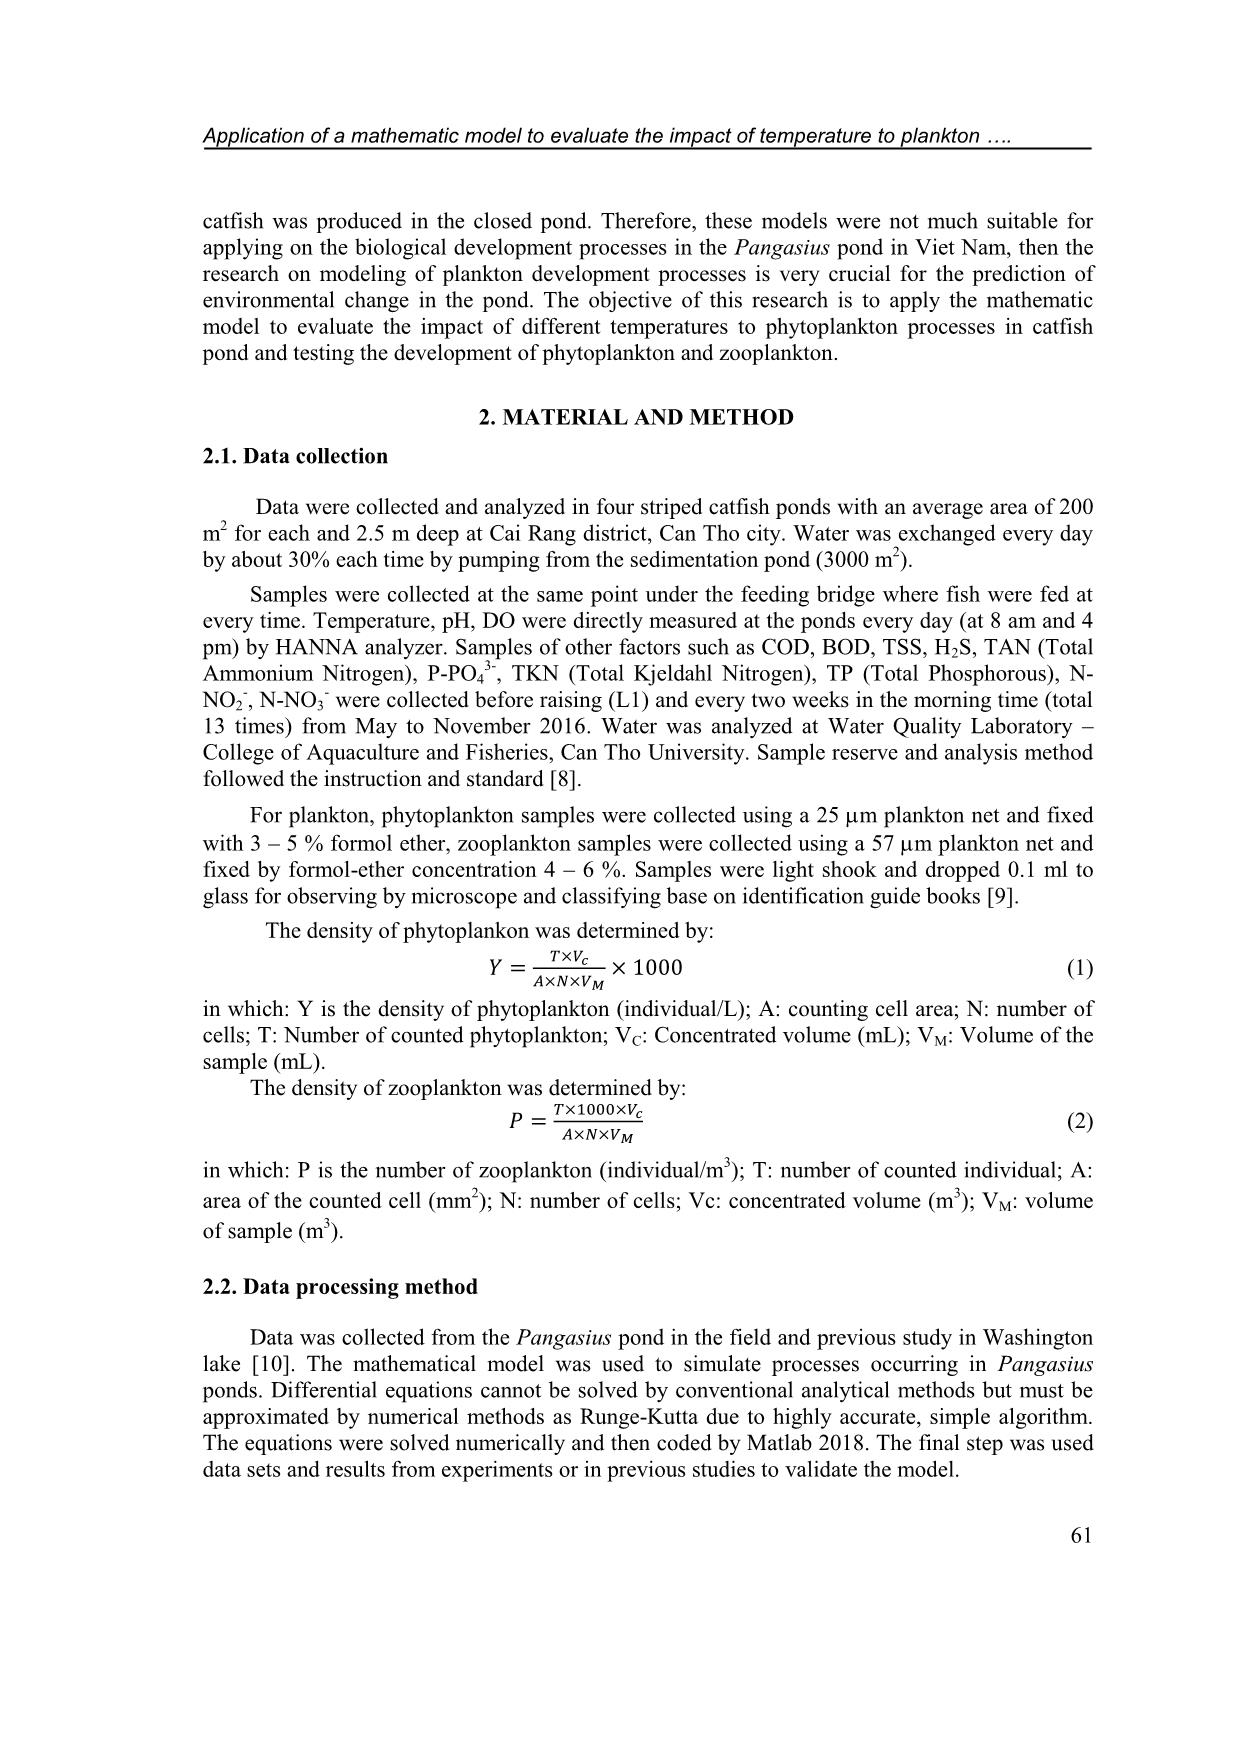
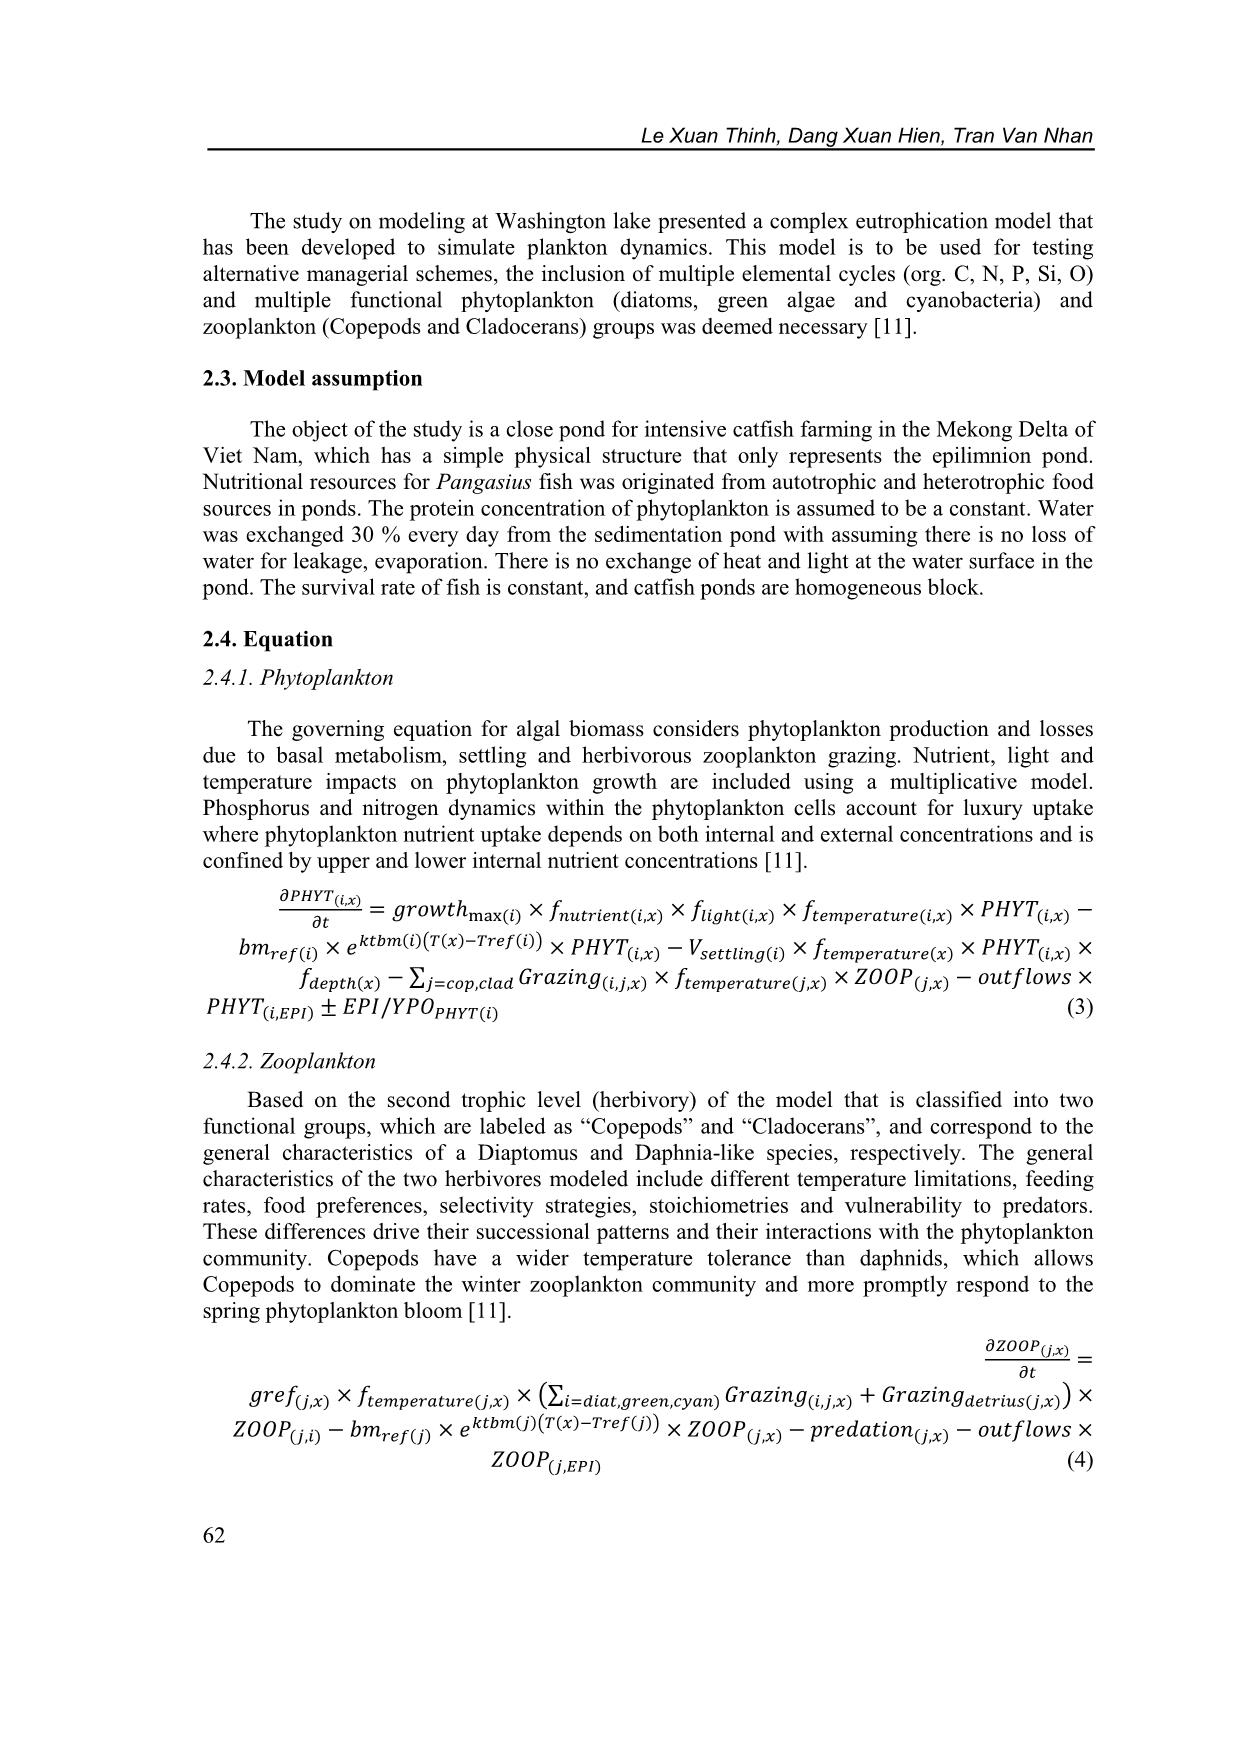
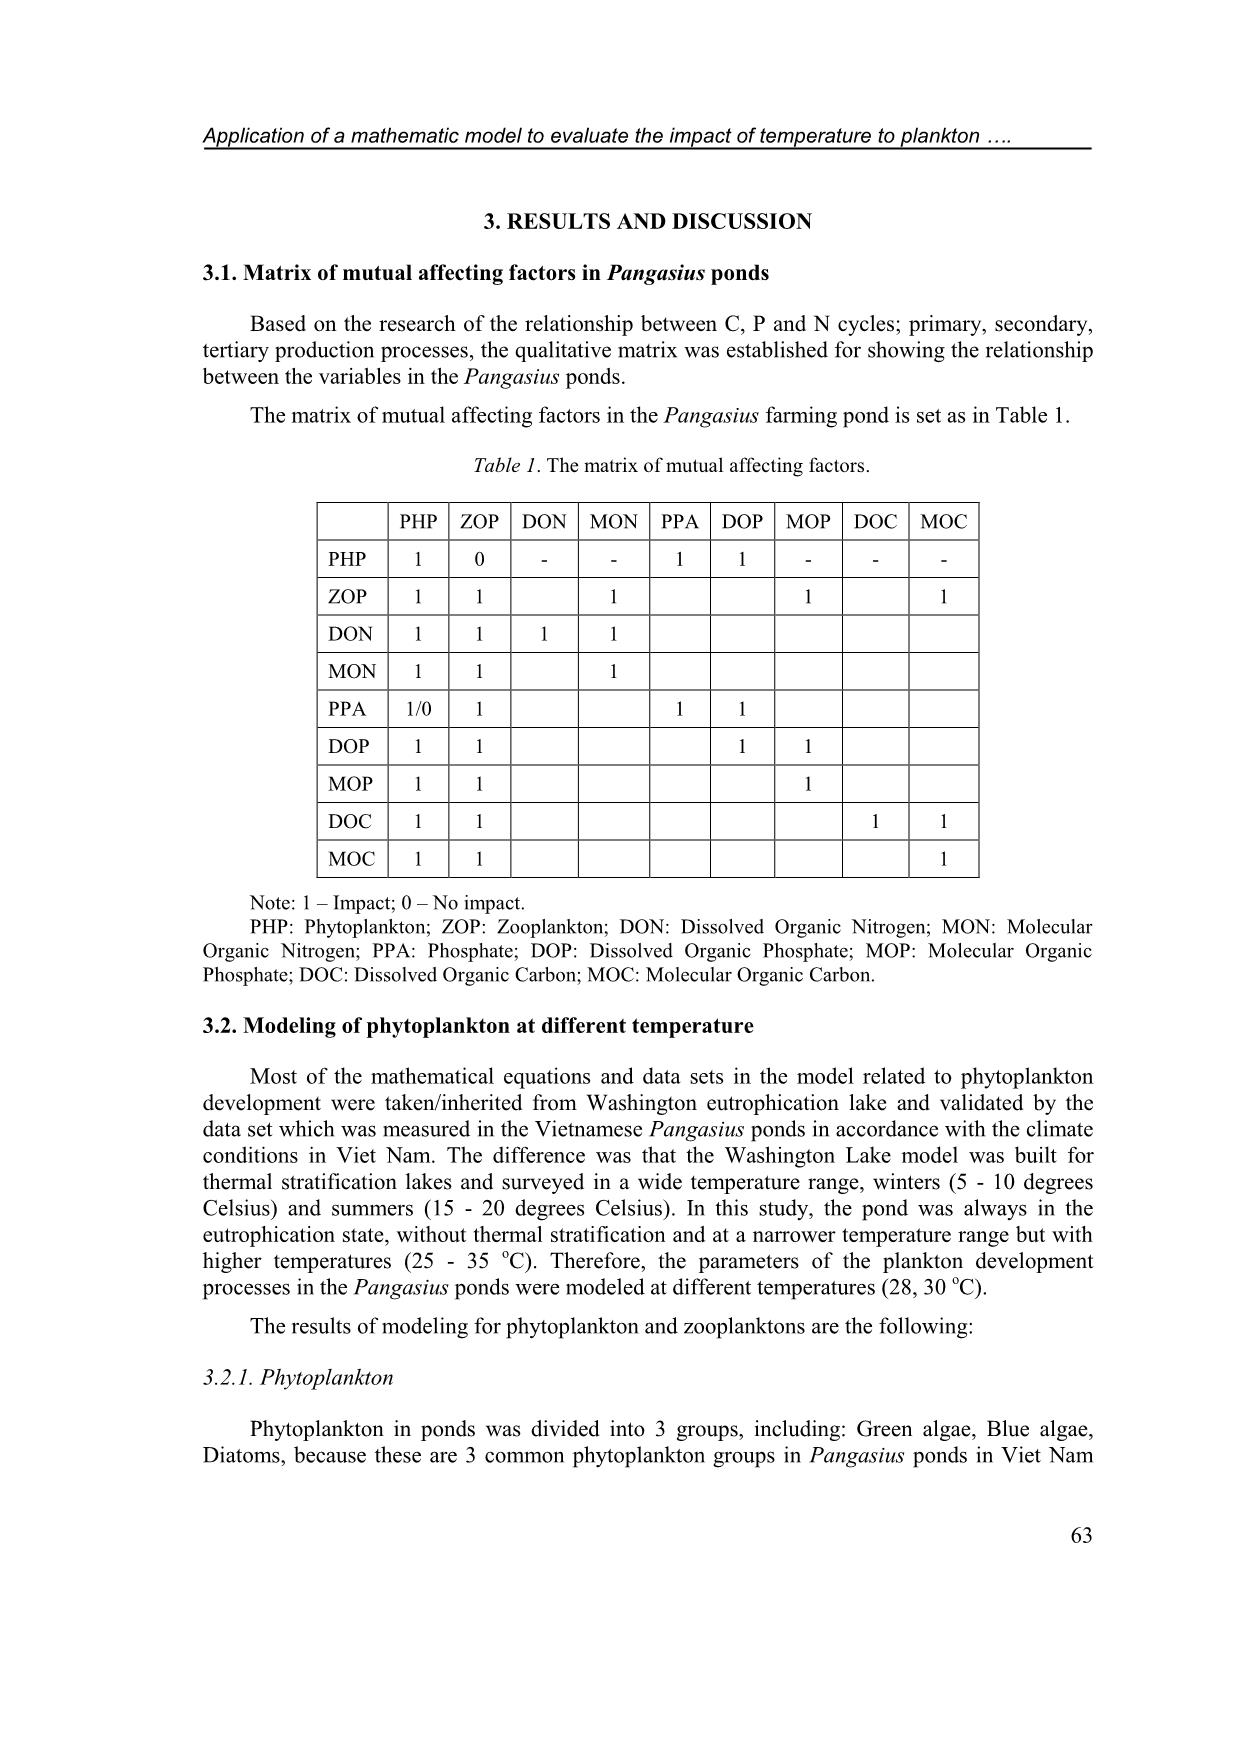
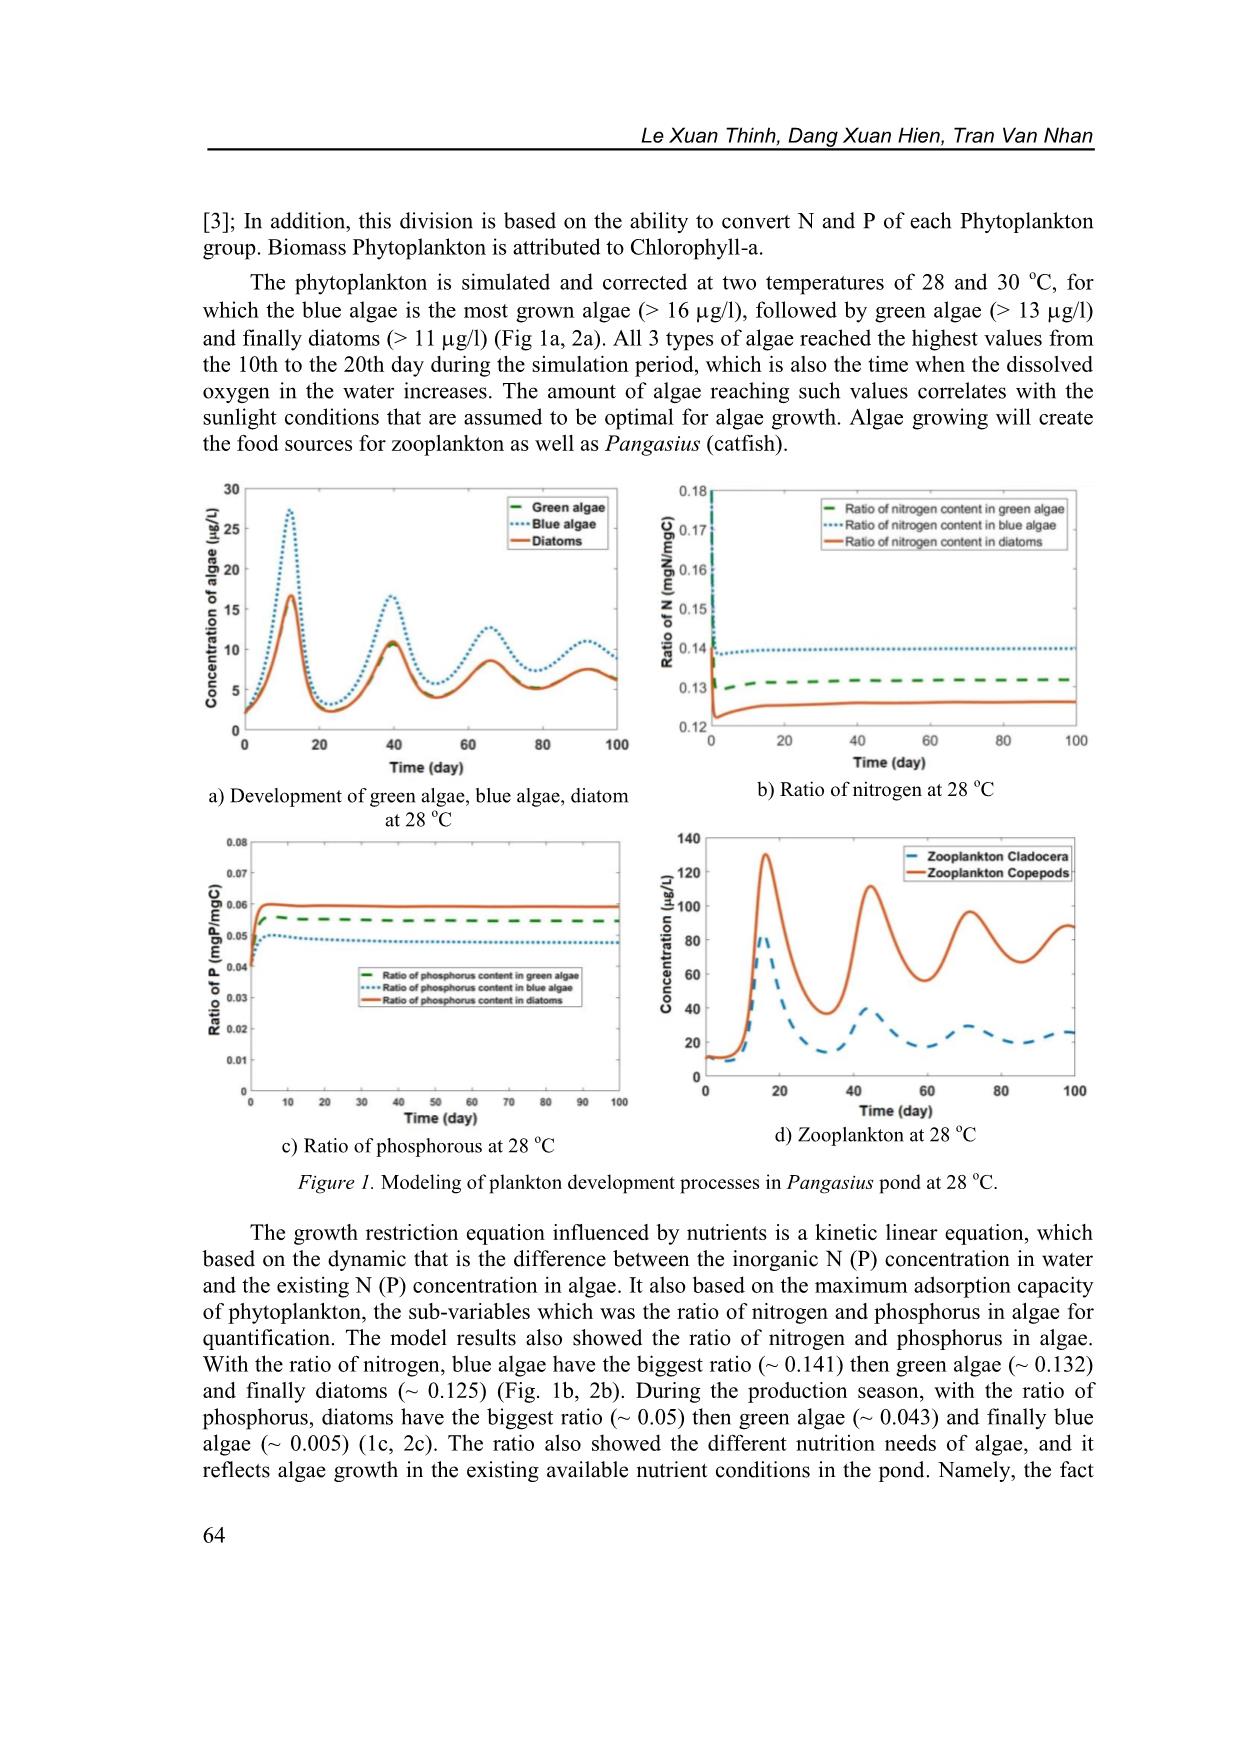
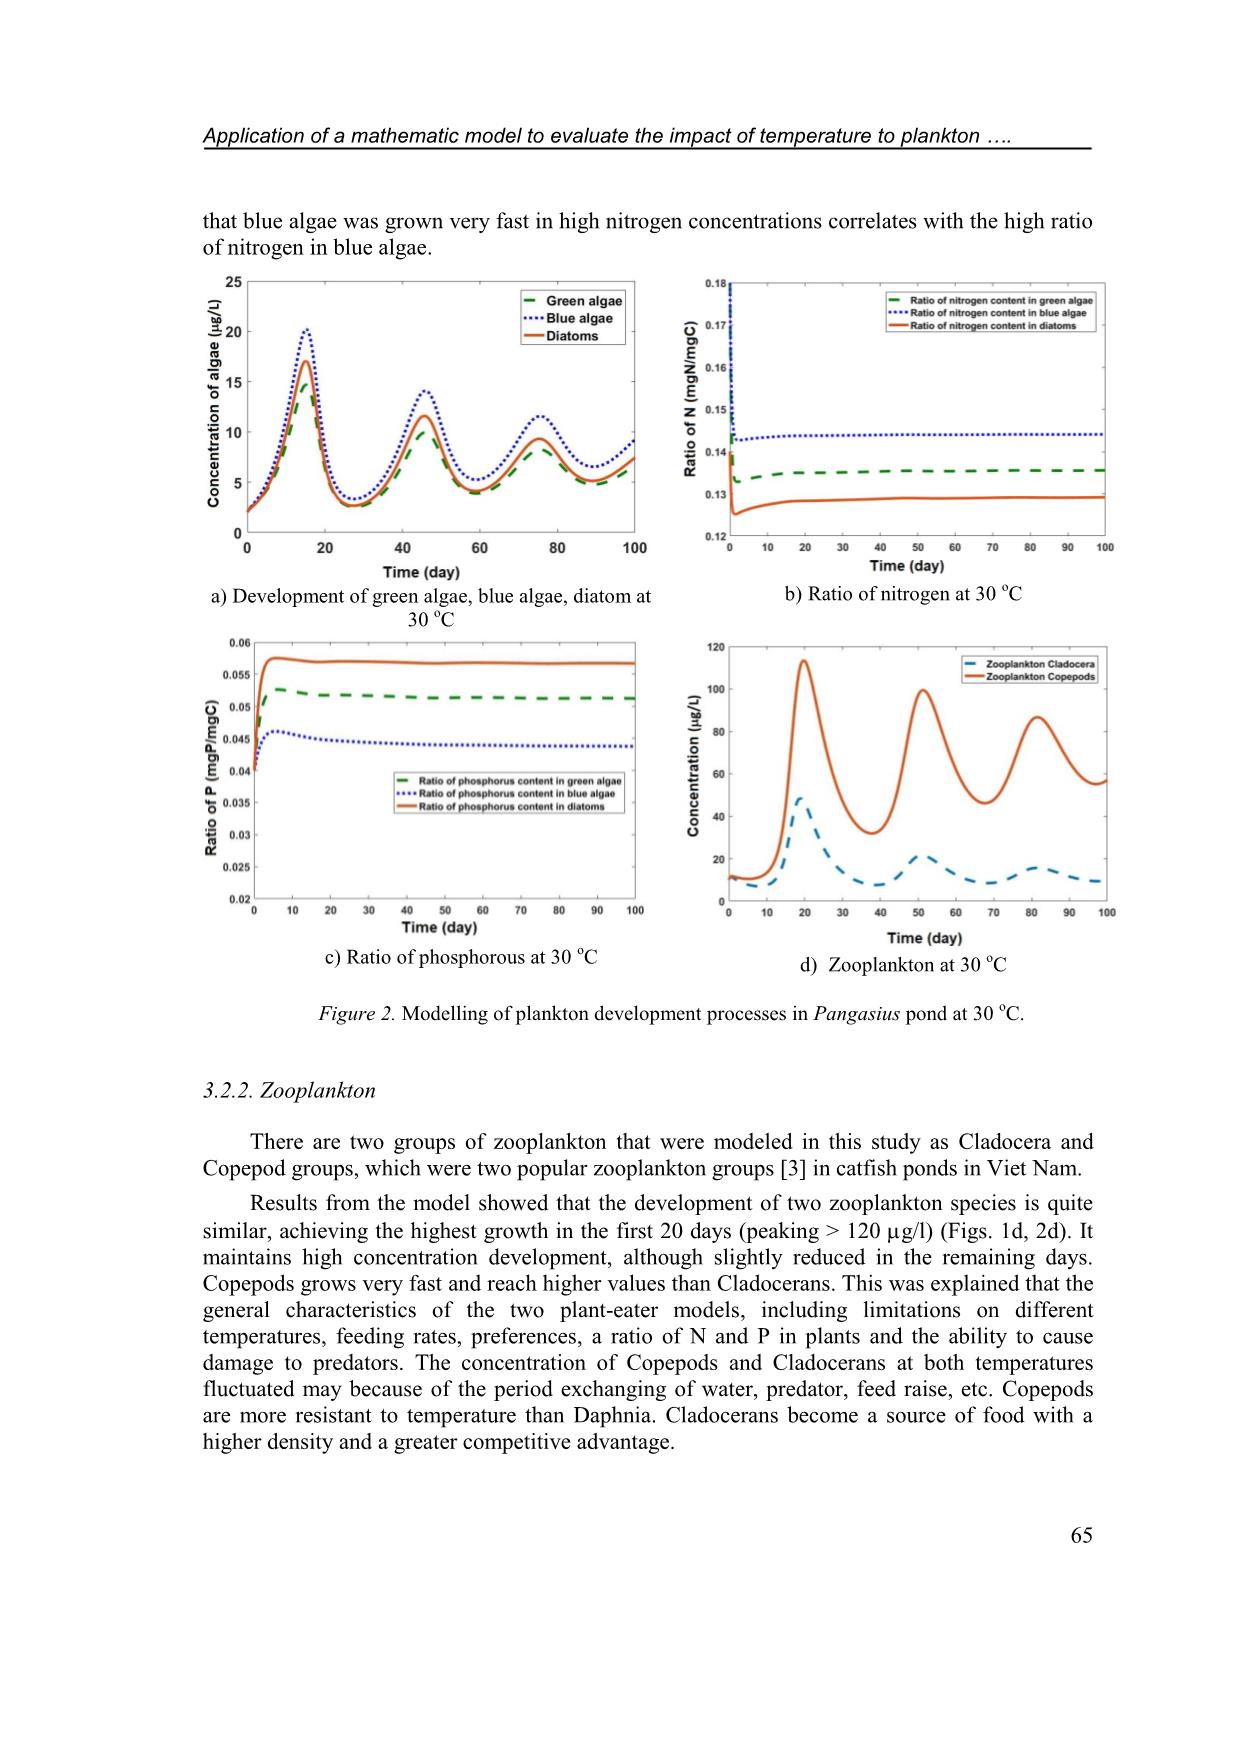
on samples were collected using a 57 m plankton net and fixed by formol-ether concentration 4 – 6 %. Samples were light shook and dropped 0.1 ml to glass for observing by microscope and classifying base on identification guide books [9]. The density of phytoplankon was determined by: (1) in which: Y is the density of phytoplankton (individual/L); A: counting cell area; N: number of cells; T: Number of counted phytoplankton; VC: Concentrated volume (mL); VM: Volume of the sample (mL). The density of zooplankton was determined by: (2) in which: P is the number of zooplankton (individual/m 3 ); T: number of counted individual; A: area of the counted cell (mm 2 ); N: number of cells; Vc: concentrated volume (m 3 ); VM: volume of sample (m 3 ). 2.2. Data processing method Data was collected from the Pangasius pond in the field and previous study in Washington lake [10]. The mathematical model was used to simulate processes occurring in Pangasius ponds. Differential equations cannot be solved by conventional analytical methods but must be approximated by numerical methods as Runge-Kutta due to highly accurate, simple algorithm. The equations were solved numerically and then coded by Matlab 2018. The final step was used data sets and results from experiments or in previous studies to validate the model. Le Xuan Thinh, Dang Xuan Hien, Tran Van Nhan 62 The study on modeling at Washington lake presented a complex eutrophication model that has been developed to simulate plankton dynamics. This model is to be used for testing alternative managerial schemes, the inclusion of multiple elemental cycles (org. C, N, P, Si, O) and multiple functional phytoplankton (diatoms, green algae and cyanobacteria) and zooplankton (Copepods and Cladocerans) groups was deemed necessary [11]. 2.3. Model assumption The object of the study is a close pond for intensive catfish farming in the Mekong Delta of Viet Nam, which has a simple physical structure that only represents the epilimnion pond. Nutritional resources for Pangasius fish was originated from autotrophic and heterotrophic food sources in ponds. The protein concentration of phytoplankton is assumed to be a constant. Water was exchanged 30 % every day from the sedimentation pond with assuming there is no loss of water for leakage, evaporation. There is no exchange of heat and light at the water surface in the pond. The survival rate of fish is constant, and catfish ponds are homogeneous block. 2.4. Equation 2.4.1. Phytoplankton The governing equation for algal biomass considers phytoplankton production and losses due to basal metabolism, settling and herbivorous zooplankton grazing. Nutrient, light and temperature impacts on phytoplankton growth are included using a multiplicative model. Phosphorus and nitrogen dynamics within the phytoplankton cells account for luxury uptake where phytoplankton nutrient uptake depends on both internal and external concentrations and is confined by upper and lower internal nutrient concentrations [11]. ( ) ∑ (3) 2.4.2. Zooplankton Based on the second trophic level (herbivory) of the model that is classified into two functional groups, which are labeled as “Copepods” and “Cladocerans”, and correspond to the general characteristics of a Diaptomus and Daphnia-like species, respectively. The general characteristics of the two herbivores modeled include different temperature limitations, feeding rates, food preferences, selectivity strategies, stoichiometries and vulnerability to predators. These differences drive their successional patterns and their interactions with the phytoplankton community. Copepods have a wider temperature tolerance than daphnids, which allows Copepods to dominate the winter zooplankton community and more promptly respond to the spring phytoplankton bloom [11]. (∑ ) ( ) (4) Application of a mathematic model to evaluate the impact of temperature to plankton . 63 3. RESULTS AND DISCUSSION 3.1. Matrix of mutual affecting factors in Pangasius ponds Based on the research of the relationship between C, P and N cycles; primary, secondary, tertiary production processes, the qualitative matrix was established for showing the relationship between the variables in the Pangasius ponds. The matrix of mutual affecting factors in the Pangasius farming pond is set as in Table 1. Table 1. The matrix of mutual affecting factors. PHP ZOP DON MON PPA DOP MOP DOC MOC PHP 1 0 - - 1 1 - - - ZOP 1 1 1 1 1 DON 1 1 1 1 MON 1 1 1 PPA 1/0 1 1 1 DOP 1 1 1 1 MOP 1 1 1 DOC 1 1 1 1 MOC 1 1 1 Note: 1 – Impact; 0 – No impact. PHP: Phytoplankton; ZOP: Zooplankton; DON: Dissolved Organic Nitrogen; MON: Molecular Organic Nitrogen; PPA: Phosphate; DOP: Dissolved Organic Phosphate; MOP: Molecular Organic Phosphate; DOC: Dissolved Organic Carbon; MOC: Molecular Organic Carbon. 3.2. Modeling of phytoplankton at different temperature Most of the mathematical equations and data sets in the model related to phytoplankton development were taken/inherited from Washington eutrophication lake and validated by the data set which was measured in the Vietnamese Pangasius ponds in accordance with the climate conditions in Viet Nam. The difference was that the Washington Lake model was built for thermal stratification lakes and surveyed in a wide temperature range, winters (5 - 10 degrees Celsius) and summers (15 - 20 degrees Celsius). In this study, the pond was always in the eutrophication state, without thermal stratification and at a narrower temperature range but with higher temperatures (25 - 35 o C). Therefore, the parameters of the plankton development processes in the Pangasius ponds were modeled at different temperatures (28, 30 o C). The results of modeling for phytoplankton and zooplanktons are the following: 3.2.1. Phytoplankton Phytoplankton in ponds was divided into 3 groups, including: Green algae, Blue algae, Diatoms, because these are 3 common phytoplankton groups in Pangasius ponds in Viet Nam Le Xuan Thinh, Dang Xuan Hien, Tran Van Nhan 64 [3]; In addition, this division is based on the ability to convert N and P of each Phytoplankton group. Biomass Phytoplankton is attributed to Chlorophyll-a. The phytoplankton is simulated and corrected at two temperatures of 28 and 30 o C, for which the blue algae is the most grown algae (> 16 g/l), followed by green algae (> 13 g/l) and finally diatoms (> 11 g/l) (Fig 1a, 2a). All 3 types of algae reached the highest values from the 10th to the 20th day during the simulation period, which is also the time when the dissolved oxygen in the water increases. The amount of algae reaching such values correlates with the sunlight conditions that are assumed to be optimal for algae growth. Algae growing will create the food sources for zooplankton as well as Pangasius (catfish). a) Development of green algae, blue algae, diatom at 28 o C b) Ratio of nitrogen at 28 o C c) Ratio of phosphorous at 28 oC d) Zooplankton at 28 oC Figure 1. Modeling of plankton development processes in Pangasius pond at 28 o C. The growth restriction equation influenced by nutrients is a kinetic linear equation, which based on the dynamic that is the difference between the inorganic N (P) concentration in water and the existing N (P) concentration in algae. It also based on the maximum adsorption capacity of phytoplankton, the sub-variables which was the ratio of nitrogen and phosphorus in algae for quantification. The model results also showed the ratio of nitrogen and phosphorus in algae. With the ratio of nitrogen, blue algae have the biggest ratio (~ 0.141) then green algae (~ 0.132) and finally diatoms (~ 0.125) (Fig. 1b, 2b). During the production season, with the ratio of phosphorus, diatoms have the biggest ratio (~ 0.05) then green algae (~ 0.043) and finally blue algae (~ 0.005) (1c, 2c). The ratio also showed the different nutrition needs of algae, and it reflects algae growth in the existing available nutrient conditions in the pond. Namely, the fact Application of a mathematic model to evaluate the impact of temperature to plankton . 65 that blue algae was grown very fast in high nitrogen concentrations correlates with the high ratio of nitrogen in blue algae. a) Development of green algae, blue algae, diatom at 30 o C b) Ratio of nitrogen at 30 oC c) Ratio of phosphorous at 30 o C d) Zooplankton at 30 oC Figure 2. Modelling of plankton development processes in Pangasius pond at 30 o C. 3.2.2. Zooplankton There are two groups of zooplankton that were modeled in this study as Cladocera and Copepod groups, which were two popular zooplankton groups [3] in catfish ponds in Viet Nam. Results from the model showed that the development of two zooplankton species is quite similar, achieving the highest growth in the first 20 days (peaking > 120 g/l) (Figs. 1d, 2d). It maintains high concentration development, although slightly reduced in the remaining days. Copepods grows very fast and reach higher values than Cladocerans. This was explained that the general characteristics of the two plant-eater models, including limitations on different temperatures, feeding rates, preferences, a ratio of N and P in plants and the ability to cause damage to predators. The concentration of Copepods and Cladocerans at both temperatures fluctuated may because of the period exchanging of water, predator, feed raise, etc. Copepods are more resistant to temperature than Daphnia. Cladocerans become a source of food with a higher density and a greater competitive advantage. Le Xuan Thinh, Dang Xuan Hien, Tran Van Nhan 66 From the two investigated temperature points it is shown that both Copepods and Cladocerans were stronger developed in the lower temperature condition (28 o C), or in other words low temperature is close to the ideal development temperature for zooplankton. In which, Copepods are able to adapt to higher temperatures than Cladocerans, which is suitable for the initial assumptions for zooplankton. The state variables had the same development trend. The graphs were congruent with each other and differed in value at the peak when changing temperatures. It was also shown that at different temperatures 28 and 30 o C which was a suitable condition for Pangasius, and 28 o C is more suitable for the development of zooplankton and phytoplankton. The big change at two temperatures was observed at phytoplankton and zooplankton, meanwhile the little change was at nutrient components. 4. CONCLUSIONS This study presents a model that simulates the plankton development processes in the Pangasius ponds. Based on the analysis and evaluation of influential matrices, the mathematical equations which describe the biological process development of fish in the pond (including zooplankton, phytoplankton) has been established. These equations are solved by the fourth- order Runge-Kutta method and coded in Matlab programming language. The model allows to simulate plankton development processes and the effects of fish feed as well as to test the potential reaction of this pond to different water ambient temperatures. At 28 and 30 o C, blue algae is the most grown algae (> 16 g/l) followed by green algae (> 13 g/l) and finally diatoms (> 11 g/l). All 3 types of algae reached the highest values from the 10th to the 20th day during the simulation period, which is also the time when the dissolved oxygen in the water increases. The model showed the ratio of nitrogen and phosphorus in algae, reflecting algae growth in the existing available nutrient conditions in the pond, such as blue algae was grown very fast in high nitrogen concentrations correlating with the high ratio of nitrogen in blue algae. The development of two zooplankton species achieved the highest growth in the first 20 days (peaking > 120 g/l), Copepods grown very fast and reached higher values than Cladocerans. The results of this study may be beneficent to the production of catfish in the decision of temperature adjustment, feed component, time of feeding, etc. Although the result was good but it needs to have more study on the development of modeling with effects from external conditions of catfish pond in different seasons. Acknowledgements. The research funding from SWITCH-Asia Program (EU) for the project “Establishing a Sustainable Pangasius Supply Chain in Viet Nam” is acknowledged. REFERENCES 1. Pham Dinh Don - Environmental pollution in aquaculture production and processing in Mekong Delta. Viet Nam Environment Administration Magazine No 6. 2014. (in Vietnamese); Online available at: viewed on date 16th July 2019. 2. Duong Nhut Long, Nguyen Anh Tuan, Le Son Trang - Intensive culture of Pangasius hypophthalmus in earthen ponds in the Mekong Delta, Viet Nam, Science Journal Can Tho University (2) (2004) 67-75 (in Vietnamese). Application of a mathematic model to evaluate the impact of temperature to plankton . 67 3. Phuong N. T., Ut V. N., Tung V. T., Hang N. T. T., Lien N. T. K., Oanh D. T. H., Huong D. T. T., and Morales E. J. - Water quality monitoring in striped catfish (Pangasianodom hypophthalmus) farms in the Mekong Delta, Viet Nam, College of Aquacultrue and Fisheries, Can Tho University, Viet Nam, Sustainable Fisheries Partnership, 2010. ( _Water%20Quality2009_final.pdf), 29th May 2012, 1–19. 4. Jingyang Z., Maryam R., Vincent C., George B. A. - Competition patterns among phytoplankton functional groups: How useful are the complex mathematical models, Acta Oecologica 33 (2008) 324-344. 5. Jorgensen S. E. - Fundamentals of Ecological Modelling (2nd Edition), Elsevier, California (US) 1994. 6. Jorgensen S. E. - Mathematical submodels in Water Quality Systems, Elsevier, California (US) (1989). 7. Li L., Yakupitiyage A. - A Model for food nutrient dynamics of semi-intensive pond fish culture, Journal Aquaculture Engineering (Elsevier) 27 (2003) 9 - 38. 8. APHA - Standard Methods for the Examination of Water and Wastewater. 19th Edition, American Public Health Association Inc., New York, 1995. 9. Akihiko Shirota - The Plankton of South Viet Nam Fresh water and Marine Plankton (book) Published by Overseas Technical Cooperation Agency in Tokyo, Japan, 1966. 10. Gurbir Perhar, George B. Arhonditsis, Michael T. Brett - Modeling zooplankton growth in Lake Washington: A mechanistic approach to physiology in a eutrophication model, Ecological Modelling 258 (2013) 101-121. 11. George B. Arhonditsis, Michael T. Brett - Eutrophication model for Lake Washington (USA) Part I, Ecological Modelling 187 (2005) 140-178.
File đính kèm:
 application_of_a_mathematic_model_to_evaluate_the_impact_of.pdf

