Journal of Fisheries science and Technology - No.3/2016
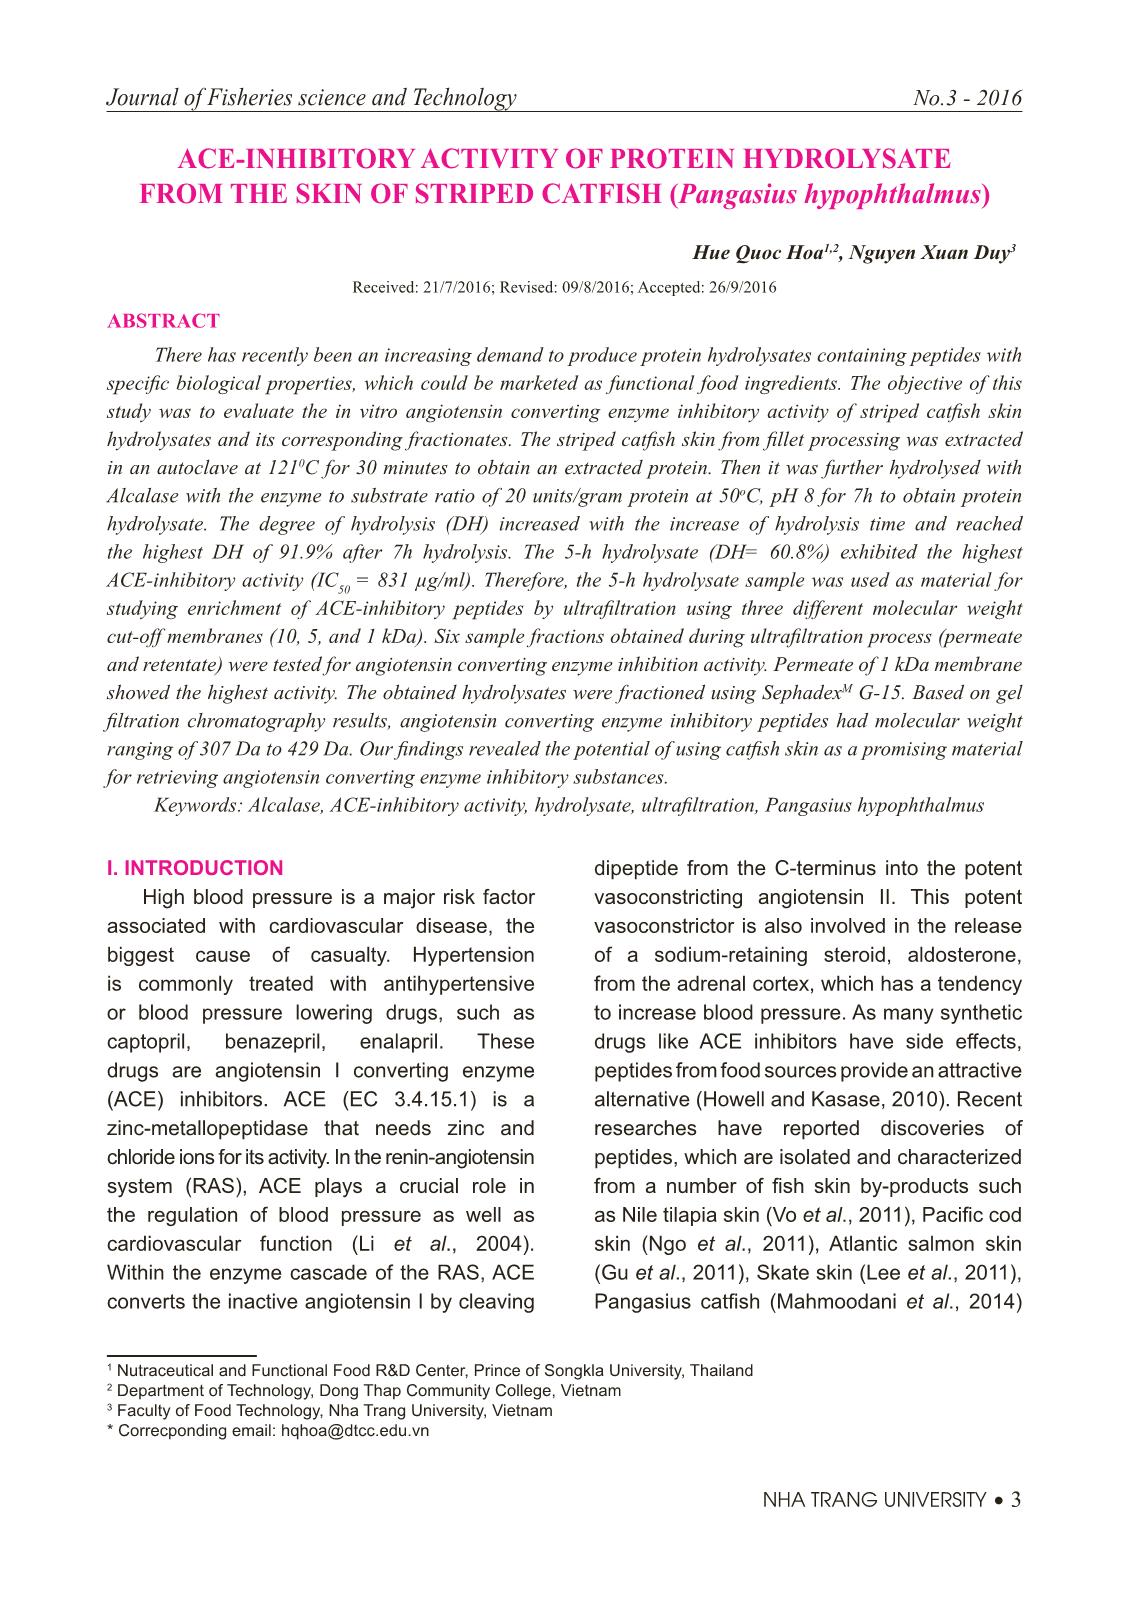
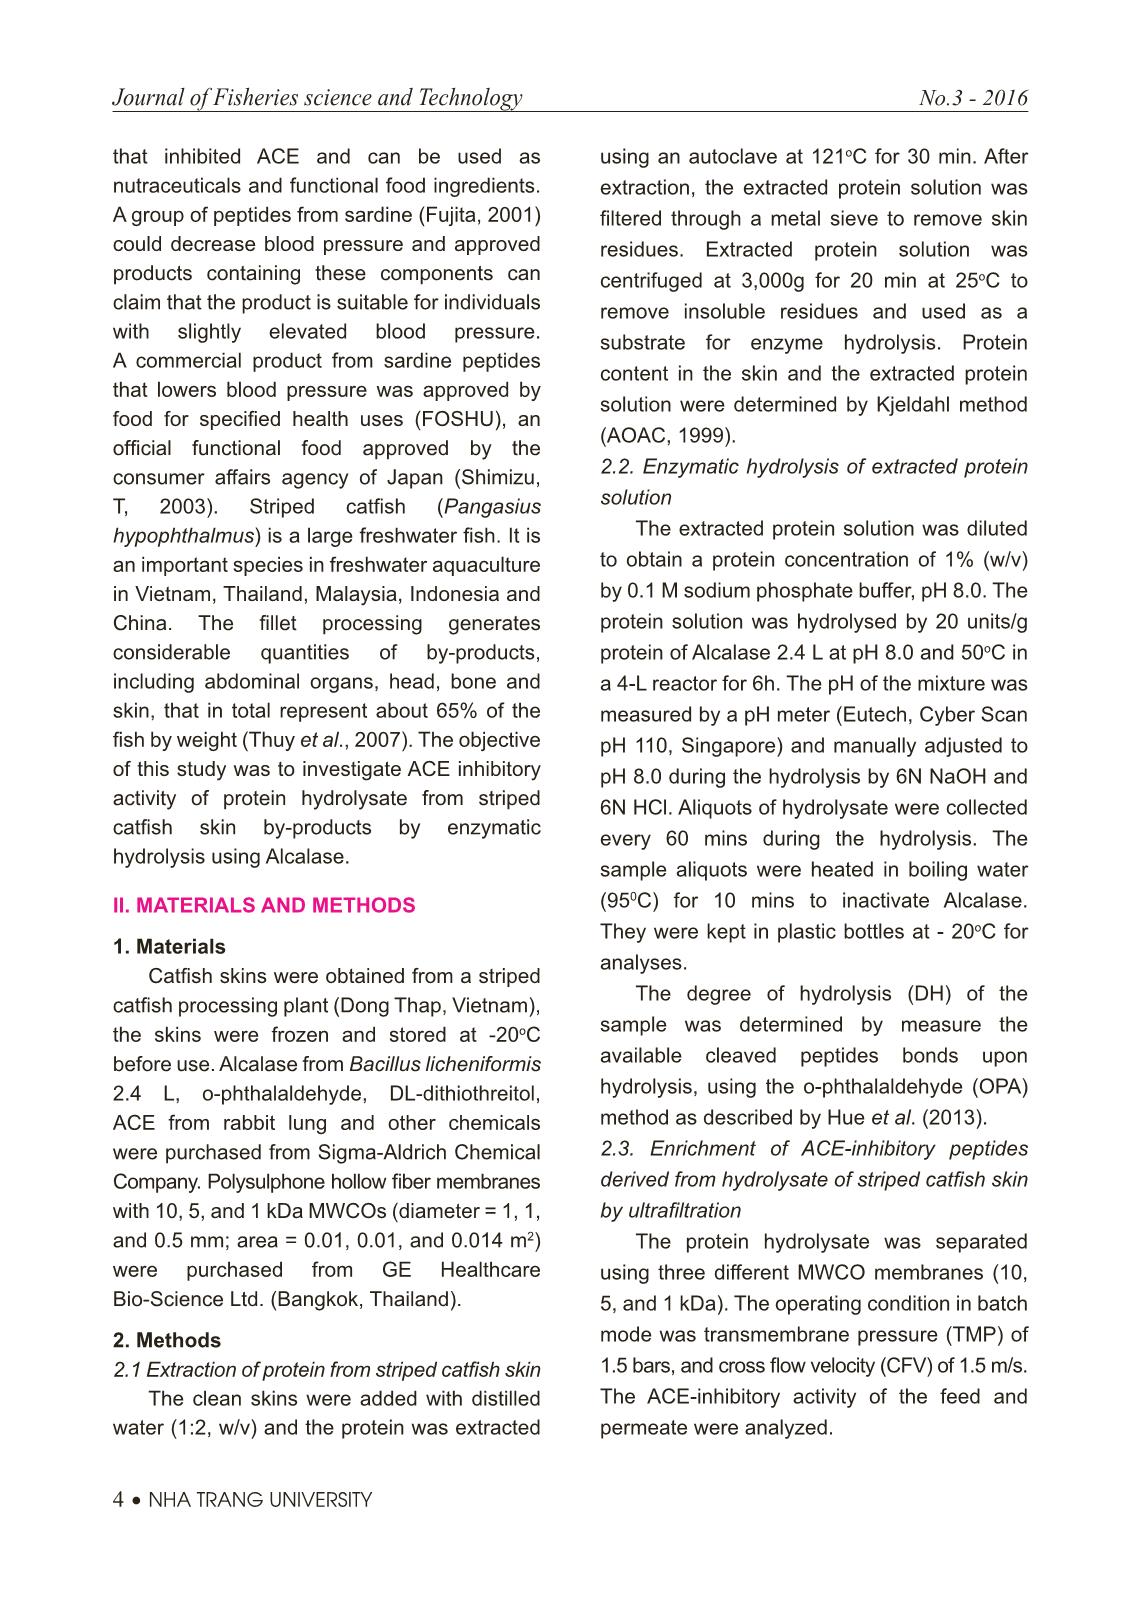
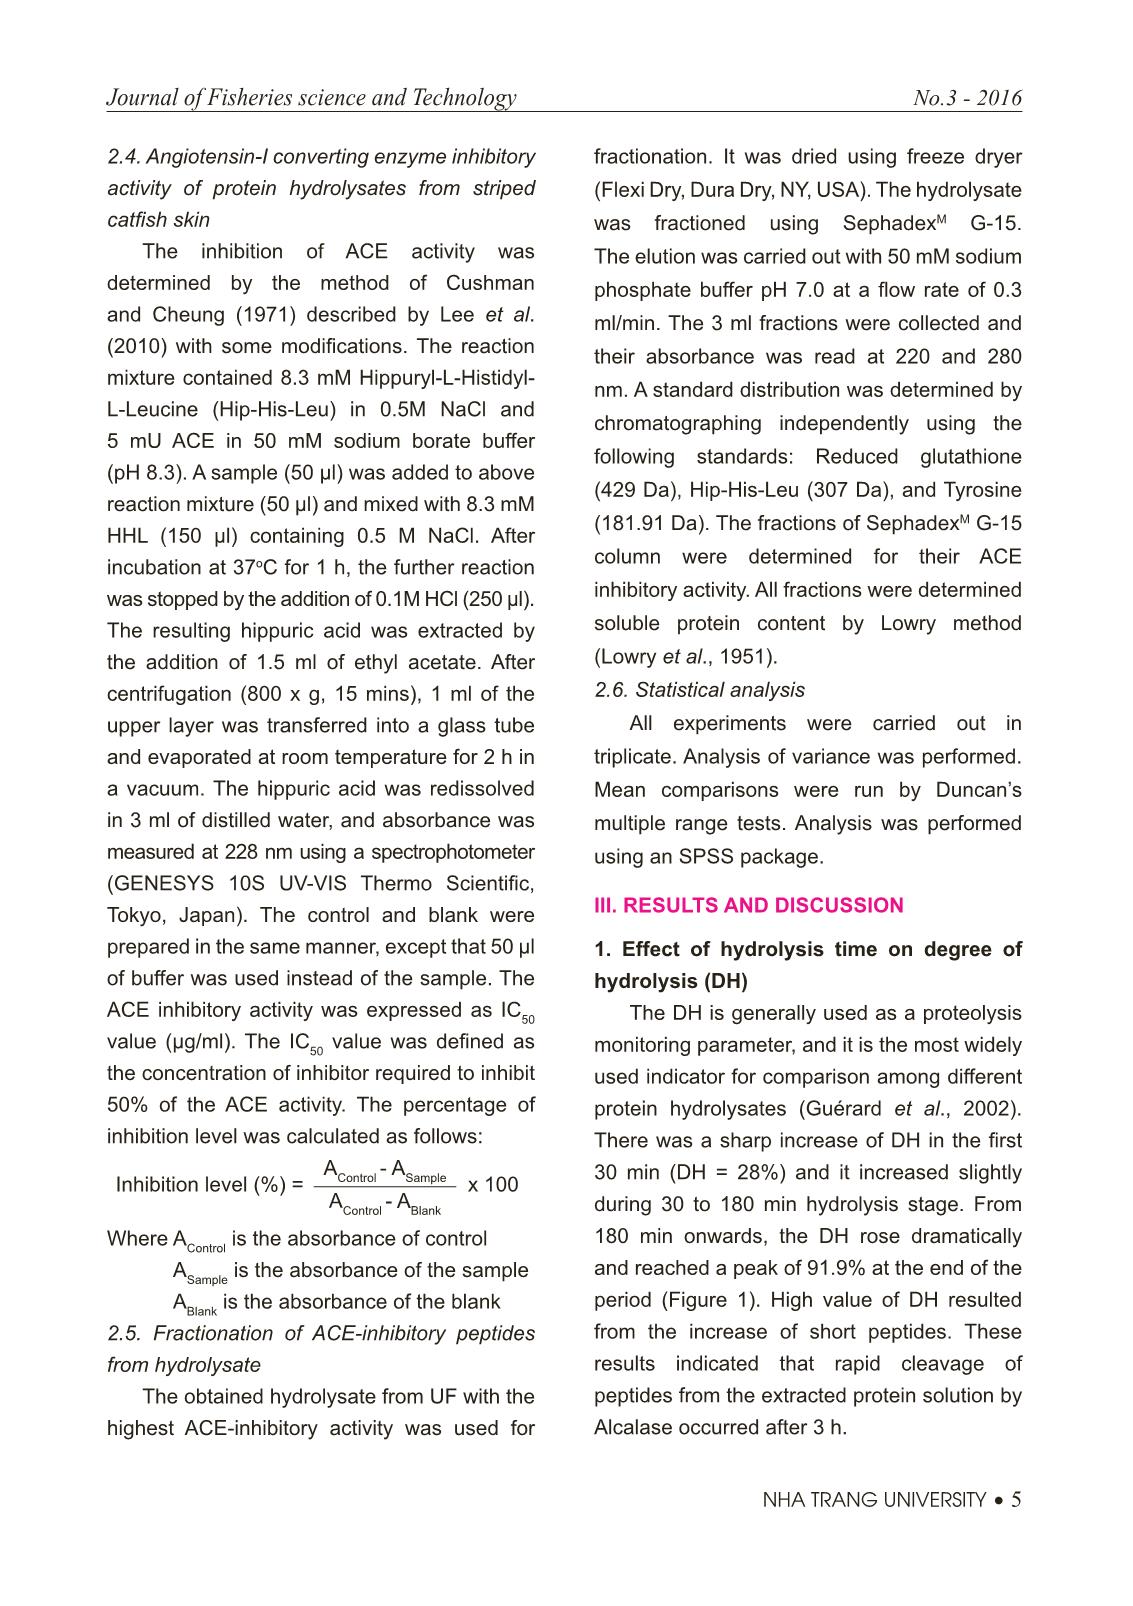
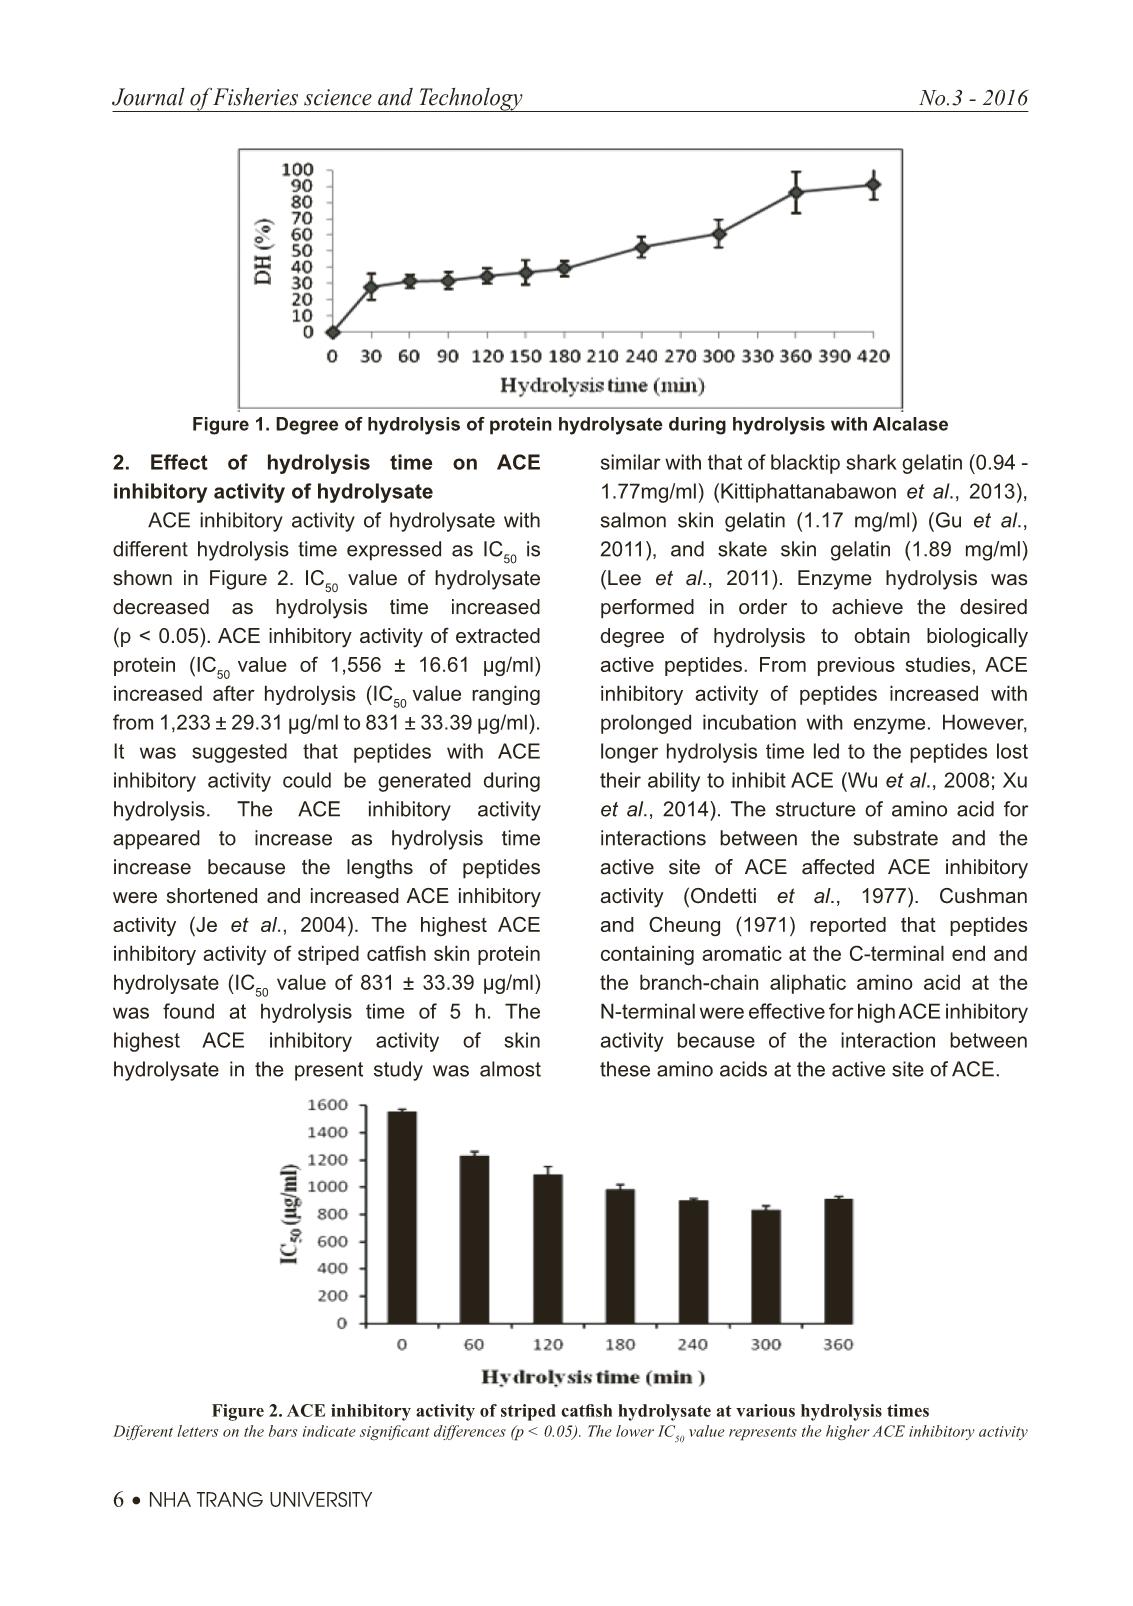
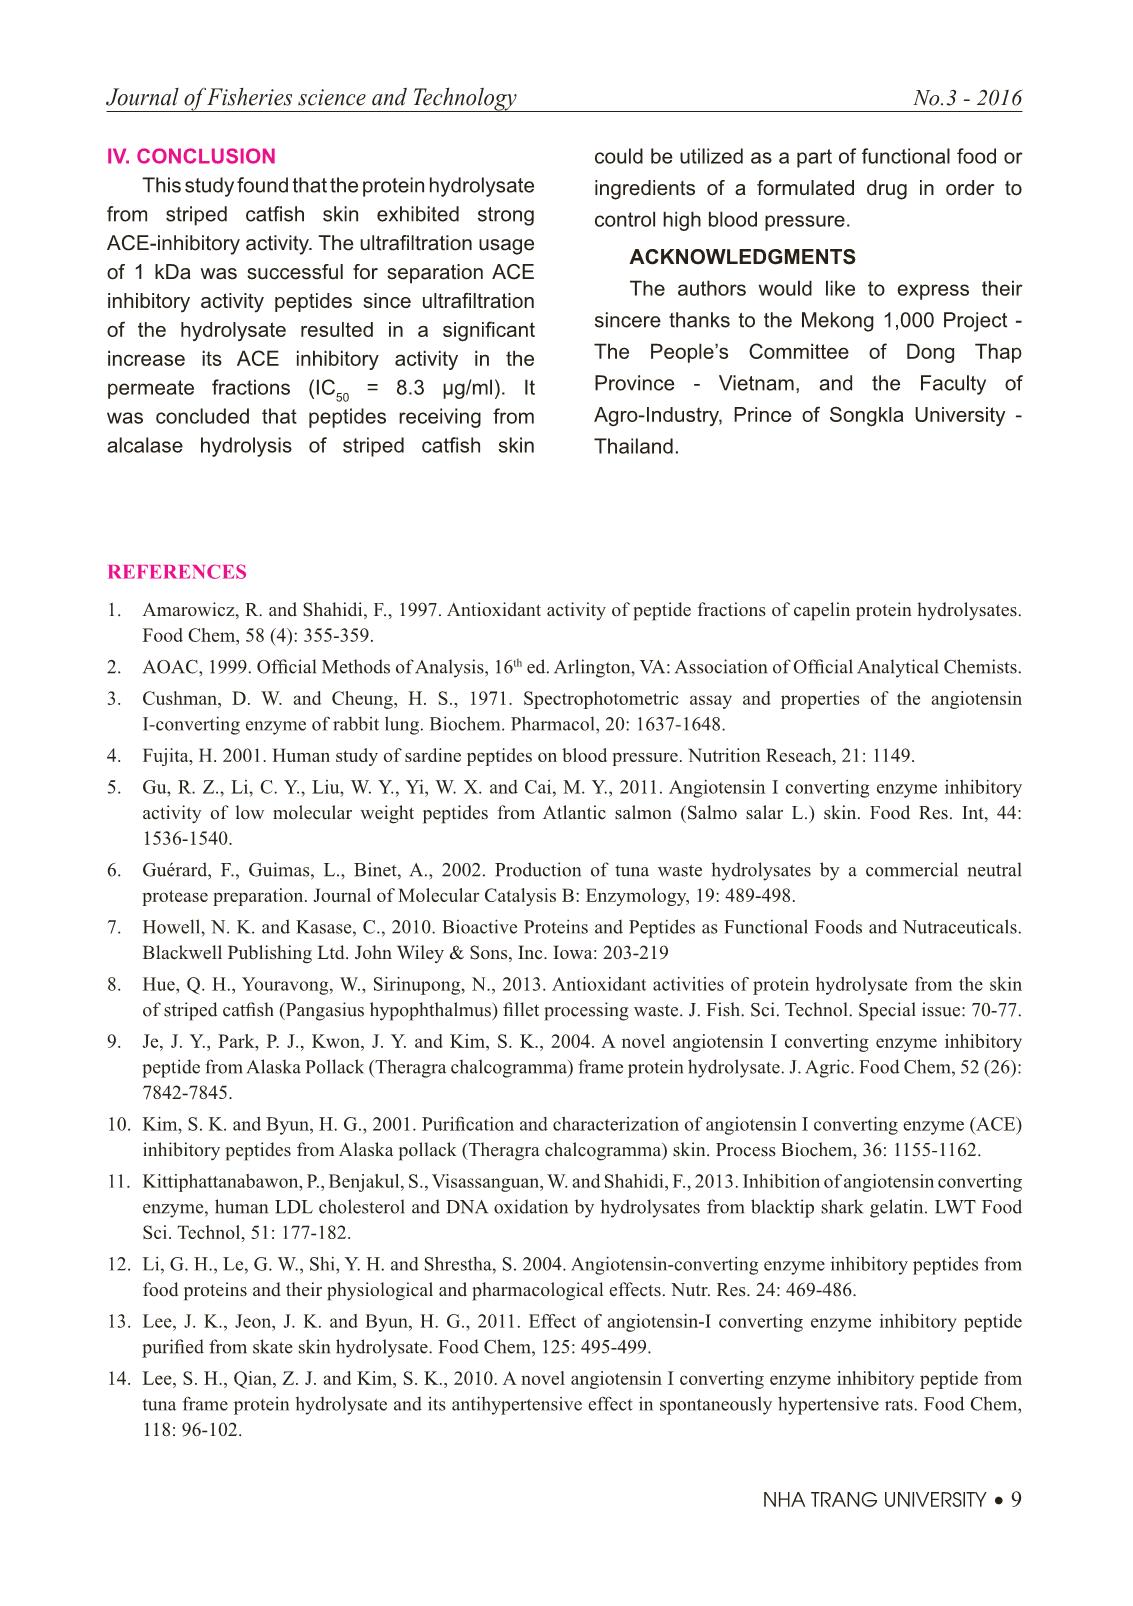
ABSTRACT There has recently been an increasing demand to produce protein hydrolysates containing peptides with specifi c biological properties, which could be marketed as functional food ingredients. The objective of this study was to evaluate the in vitro angiotensin converting enzyme inhibitory activity of striped catfi sh skin hydrolysates and its corresponding fractionates. The striped catfi sh skin from fi llet processing was extracted in an autoclave at 1210C for 30 minutes to obtain an extracted protein. Then it was further hydrolysed with Alcalase with the enzyme to substrate ratio of 20 units/gram protein at 50oC, pH 8 for 7h to obtain protein hydrolysate. The degree of hydrolysis (DH) increased with the increase of hydrolysis time and reached the highest DH of 91.9% after 7h hydrolysis. The 5-H hydrolysate (DH= 60.8%) exhibited the highest ACE-inhibitory activity (IC50 = 831 µg/ml). Therefore, the 5-h hydrolysate sample was used as material for studying enrichment of ACE-inhibitory peptides by ultrafi ltration using three different molecular weight cut-off membranes (10, 5, and 1 kDa). Six sample fractions obtained during ultrafi ltration process (permeate and retentate) were tested for angiotensin converting enzyme inhibition activity. Permeate of 1 kDa membrane showed the highest activity. The obtained hydrolysates were fractioned using SephadexM G-15. Based on gel fi ltration chromatography results, angiotensin converting enzyme inhibitory peptides had molecular weight ranging of 307 Da to 429 Da. Our fi ndings revealed the potential of using catfi sh skin as a promising material for retrieving angiotensin converting enzyme inhibitory substances
Trang 1
Trang 2
Trang 3
Trang 4
Trang 5

Trang 6
Trang 7
Trang 8
Trang 9
Trang 10
Tải về để xem bản đầy đủ
Tóm tắt nội dung tài liệu: Journal of Fisheries science and Technology - No.3/2016
distributions and cohort slicing analysis, the
data were used to compute for only males. The
total length was calculated based on the
relationship equation with CL and then the
asymptotic length (L∞) was estimated based
on total length according to Sarda et al.,
(1998) [13].
The length-frequency distributions were
plotted by year and analysed as a combination
of cohort length distributions, each of
which was assumed to be in the form of a
Gaussian distribution [15]. The mean length at
age of each cohort and the standard deviations
was estimated and then the average growth
rate can be modelled. The von-Bertalanffy (VB)
growth equation was applied to the estimated
mean length-at-age and the standard deviation
data according to the equation:
Lt = L∞ (1− e
−k(t−t0))
(where Lt as the average length-at-age t,
L∞ as the asymptotic length, k as the growth
rate parameter and t0 as hypothetical age at
length equal to 0).
The VB growth model assumes that growth
was faster when the species was young and
get slow onwards after they become mature.
In order to run this equation in R, some initial
values as L∞, k and t0 were set and the least
sums of squared error (SSE) was minimised
using an iterative process [15]. The parameter
t0 was fi xed at 0.1 as the fi rst two age groups
were completely missing from the data series
and t0 was always estimated really low.
To compare the estimated growth parameters
of nephrops in this study with other studies,
the growth performance index (Φ’) were used
which calculated according to equation:
Φ = log10k + 2 * log10 L∞
(where k as the growth rate parameter and L∞
as the asymptotic length).
These data were analysed by models in the
R software package according to Stefansson
(2012) [14].
III. RESULTS AND DISCUSSION
1. Characteristics of age distribution
1.1. Age distribution at different years
The age distribution of lobster population
from 1970 to 2011 had twenty fi ve age
groups corresponding several peaks of
carapace length (CL) frequency distribution
(Figure 1). The mean CL of N. norvegicus at age
estimated was ranged from 7.22 mm at age 1
to 76.08 mm at age 25.
124 • NHA TRANG UNIVERSITY
Journal of Fisheries science and Technology No.3 - 2016
Figure 1. The age distribution of N. norvegicus based
on CL distribution in catches from 1970 to 2011
The growth rate of nephrops was high in
the fi rst four years with mean increment of
about 7.0 mm per year. After this age, they
reached a maturity size, therefore, the growth
rate gradually decreased. The proportions
corresponding to relative ages revealed a
difference between decades. In the period
1970 - 1979, the age groups of 5 to 9 year olds
were in high abundant as the mean CL ranged
32.41 - 49.19 mm. The age groups of 5 to 10
year olds of Nephrops showed a dominant
proportion in the catches in the periods from
1980 - 1989 corresponding to mean CL of
32.41 - 52.42 mm. On the other hand, in
recent years (1990 - 2009) and the whole data
from 1970 to 2011, the landings showed high
abundant of age groups from 6 to 10 year olds
or mean CL of 37.26 - 52.42 mm. For the other
groups, the age proportions were small (Table 1).
Table 1. Mean CL and age proportion of N. norvegicus in catches from 1970 to 2011
Age Mean CL (mm)
Proportion (%)
SD
1970-1979 1980-1989 1990-1999 2000-2009 1970-2011
1 7.22 3.904e-04 4.026e-04 9.454e-05 3.805e-06 1.471e-04 0.37146
2 14.51 6.690e-04 7.699e-04 1.606e-04 1.172e-04 2.719e-04 0.74646
3 21.09 0.00333 0.00135 6.967e-04 4.670e-04 0.00155 1.08544
4 27.03 0.04052 0.02019 0.02611 0.00776 0.02083 1.39185
5 32.41 0.12999 0.10445 0.09711 0.06046 0.09547 1.66882
6 37.26 0.23606 0.14914 0.20350 0.12269 0.16539 1.91919
7 41.64 0.15564 0.21745 0.19869 0.15398 0.18045 2.14551
8 45.61 0.16582 0.16544 0.14899 0.17378 0.15539 2.35008
9 49.19 0.10511 0.11656 0.11814 0.11922 0.11871 2.35008
10 52.42 0.04347 0.12218 0.10038 0.13062 0.10176 2.70215
11 55.34 0.06881 0.04140 0.06161 0.06519 0.05339 2.85326
12 57.98 0.02776 0.03125 0.03545 0.08298 0.06087 2.98984
13 60.36 6.564e-07 0.01685 1.367e-06 3.115e-06 8.279e-08 3.11330
14 62.52 0.01122 4.244e-07 0.02809 0.05616 0.03708 3.22490
15 64.46 0.00688 0.00959 2.685e-07 0.02014 1.075e-04 3.32578
16 66.22 5.898e-07 3.531e-07 4.401e-07 2.007e-06 9.292e-07 3.41697
17 67.81 2.331e-07 8.992e-08 7.086e-10 6.164e-06 0.00543 3.49939
18 69.25 5.413e-04 5.351e-08 4.058e-07 6.843e-04 0.00211 3.57391
19 70.54 9.469e-04 7.151e-08 1.810e-07 0.00549 2.967e-07 3.64126
20 71.71 3.102e-06 3.660e-08 9.089e-05 2.262e-04 3.539e-07 3.70214
21 72.77 3.665e-07 1.911e-08 2.404e-04 3.802e-06 2.488e-07 3.75713
22 73.73 3.959e-07 8.855e-08 1.732e-04 2.856e-06 7.566e-07 3.80691
23 74.59 6.670e-08 1.921e-07 3.134e-05 1.450e-06 1.331e-07 3.85189
24 75.37 9.341e-08 3.232e-07 5.930e-06 1.744e-06 1.397e-06 3.89253
25 76.08 0.00285 0.00296 4.472e-04 1.065e-06 0.00103 3.92928
NHA TRANG UNIVERSITY • 125
Journal of Fisheries science and Technology No.3 - 2016
The mean CL of this species caught in 1970
was 45.10 mm and presented a fl uctuation
onwards with minimum value of 42.60 mm in
1973. Until 1995, the CL increased rapidly and
reached a peak of 49.66 mm in 2010.
1.2. Age distribution at different fi shing areas
The age distributions of N. norvegicus
were compared the Southeast with Southwest
fi shing grounds based on the mean of CL
frequency distributions.
In general, the mean CL of N. norvegicus in catches increased from 1970 to 2011 (Figure 2).
Figure 2. The mean CL of N. norvegicus in catches from 1970 to 2011
Figure 3. The age distribution of N. norvegicus based on CL distribution in catches from 1970 to 2011
at different fi shing areas (A: Southeast area and B: the Southwest area).
Figure 3 showed that the plotted of age
distributions as CL frequency distributions
were similar, but in the Southwest areas, the
distribution was wider than in the Southeast
areas, which revealed a difference in the
proportion of age groups (Table 2).
126 • NHA TRANG UNIVERSITY
Journal of Fisheries science and Technology No.3 - 2016
Figure 4 showed that the mean CL of
nephrops caught in the Southeast areas
fl uctuated but did not show any consistent
trend with the mean CL was 44.84 mm from
1970 to 2011. Meanwhile, in the Southwest
areas, the mean CL of this species revealed
an increase from a minimum value of 40.27
mm in 1970 to maximum value of 61.42 mm
in 2003 and then gradually decreased to 50.0
mm in 2011. The mean carapace length of
N. norvegicus in this fi shing areas was 47.94
which is signifi cantly higher when compared to
Southeast areas (p<0.01).
The signifi cant difference of mean CL
of N. norvegicus caught in Southwest and
Southeast fi shing areas may be caused by
different type of bottom structure in their
habitat. This was in good agreement with
Figure 4. The mean CL of N. norvegicus in catches at different fi shing areas from 1970 to 2011
Table 2. Age proportion of N. norvegicus in catches
at different fi shing areas from 1970 to 2010
Age
Proportion (%)
Age
Proportion (%)
Southeast areas Southwest areas Southeast areas Southwest areas
1 2.106e-04 2.023e-04 14 0.01436 0.06853
2 3.733e-04 3.489e-04 15 0.00406 0.01124
3 0.00159 0.00144 16 4.538e-04 2.992e-05
4 0.02245 0.02029 17 7.999e-04 0.01403
5 0.11301 0.08017 18 8.431e-04 0.01562
6 0.19184 0.13409 19 6.784e-06 5.318e-08
7 0.19557 0.15062 20 3.183e-07 3.339e-07
8 0.16140 0.13479 21 1.625e-07 2.269e-07
9 0.10207 0.12198 22 1.087e-07 4.741e-07
10 0.10534 0.09338 23 4.469e-07 1.386e-09
11 0.02944 0.07735 24 1.988e-07 7.967e-06
12 0.05462 0.07474 25 0.00155 0.00142
13 5.323e-07 3.542e-07
In the Southeast fi shing areas, age groups with the highest proportions ranged between 5 and
10 corresponding to mean CL of 32.41 - 52.42 mm, while the proportion of age groups 5 to 12 with
mean CL ranged from 32.44 mm to 57.98 mm were most abundant in the Southwest fi shing areas.
NHA TRANG UNIVERSITY • 127
Journal of Fisheries science and Technology No.3 - 2016
previously observation by Tuck et al. (1997),
who stated that local variations in size
composition, density and growth of this species
might be related to type of bottom sediment [16].
Moreover, the mean CL size of nephrops
was positively correlated with increasing
clay/silt content from 30 - 90% and showed
an inversely relationship in the Irish Sea with
bottom sediment ranges between 4 - 49% of
clay/silt [16].
Moreover, the variation in mean CL of
nephrops is also negatively correlated
with depth [5]. In the Southwest areas, the
depth ranged from 130 - 180 m and it could
explain the higher average CL than found in
the Southeast areas with depth of 180 - 250 m.
2. The growth parameters
The mean CL at ages of N. norvegicus
obtained from the length frequency
distribution and cohort slicing analysis were
then fi tted to the von Bertalanffy growth curve
model to calculate the growth parameters:
CL∞ = 82.5 (mm), k = 0.1 (yr
-1), t0 = - 0.1 and the
growth performance index Φ’) were 3.87.
Mytilineou and Sarda (1995), the CL∞ of lobster
in the Catalan Sea ranged from 84.4 to 96.6
mm [9]. Meanwhile, the asymptotic length (L∞)
calculated based on the relationship equation
between CL and total length in this study was
300 mm which was higher than L∞ of 226 mm
in Ancona Sea [13].
The growth rate parameter (k) of this
species obtained in this study (0.1 yr-1) was
higher than those stated by Mytilineou and
Sarda (1995) in Catalan Sea (0.05-0.08 yr-1)
but consistent with value of 0.11 in Ancona
Sea [7].
On the other hand, the growth performance
index (Φ,) calculated 3.87 in this study was
higher than the results reported by Mytilineou
and Sarda (1995) in Catalan Sea (2.6 – 2.8) [9]
but lower than values of 6.33 – 6.64 in Ancona
Sea [7]. The values of k and Φ’ (0.1 yr-1 and
3.87) obtained in this study were in good
agreement with observation before in Iceland
(0.1 yr-1 and 2.81, respectively) [4]. These
results were contrary to Pauly (1984), who
stated that growth performance index was
constant [11]. However, it was consistent
with other studies on N. norvegicus which
presented the growth rate can vary considerably
due to environmental forces such as
temperature, sediment particle size, food
availability, population density and fi shing
pressure, each of which may have different
and possibly interactive effects [1].
IV. CONCLUSION
Age distributions of N. norvegicus in Iceland
revealed twenty fi ve age groups corresponding
to mean CL ranging from 7.22 mm at age 1 to
76.08 mm at age 25. The dominant age groups
in the catch were 5 to 10 year olds. The mean
CL of this species increased from 45.10 mm
in 1970 to 49.3 mm in 2011. The mean CL of
N. norvegicus caught in the Southwest areas
Figure 5. von-Bertalanfy growth curve of N. norvegicus
at different ages in catches from 1970 to 2011
(Broken lines showed standard deviation)
 Figure 5 showed that N. norvegicus
caught in Icelandic waters had a CL∞ of 82.5
mm that was fairly similar when compared
with previous studies in different fi shing areas
although using different methods. According to
128 • NHA TRANG UNIVERSITY
Journal of Fisheries science and Technology No.3 - 2016
(47.94 mm) was signifi cantly higher than those
of 44.84 mm caught in the Southeast areas
(p<0.01).
The growth parameters of nephrops were:
CL∞ = 82.5 (mm), k = 0.1 (yr
-1), t0 = - 0.1 and
the growth performance index (Φ’) were 3.87.
ACKNOWLEDGEMENTS
The authors would like to thank the United
Nations University - Fisheries Training
Programme and Marine Research Institute
in Iceland for great supportted and excellent
guidance for this research.
REFERENCES
1. Bell M., Redant F., and Tuck I., 2006. Nephrops species. In B. Philipps, Lobsters: Biology, Management,
Aquaculture and Fisheries. Oxford: Blackwell Publishing Ltd.: 412-450.
2. Bennett D., 1980. Perspectives on European lobster management. In J. Cobb, & B. Phillips, The Biology and
Management of Lobsters (Vol. 2, p. 390). New York: Academic Press.
3. Campbell N., Allan L., Weetman A. and Dobby H., 2009. Investigating the link between Nephrops norvegicus
burrow density and sediment coposition in Scottish waters. ICES Journal of Marine Science, 66, 2052-2059.
4. Eiriksson H., 1982. Estimating the growth of Nephrops at Iceland. ICES. Shellfi sh Committee, C.M. 1982/K:16, 9.
5. Eiriksson H., 1999. Spatial variabilities of CPUE and mean size as possible criteria for unit stock demarcations
in analytical assessments of Nephrops at Iceland. Rit Fiskideildar 16, 239-245.
6. FAO, 2012. Fisheries and Aquaculture Department. Retrieved December 15, 2012, from Food and Agriculture
Organization of the United Nations: fi shery/species/2674/en
7. Marano G., Marsan R., Pastorelli A., Vaccarella R., 1998. Areale di distribuzione e pesca dello scampo,
Nephrops norvegicus (L), nelle acque del basso Adriatico. Biology Marine Mediterranean, 2, 284-292.
8. Morello E., Froglia C., Atkinson R., 2007. Underwater television as a fi shery-independent method for stock
aassessment of Norway lobster (Nephrops norvegicus) in the Central Adriatic Sea (Italy). ICES Journal of
Marine Science, 64, 1116-1123.
9. Mytilineou C. and Sarda F., 1995. Age and growth of Nephrops norvegicus in the Catalan Sea, using
length-frequency analysis. Fisheries Research, 23, 283-299.
10. Pampoulie C., Skirnisdottir S., Hauksdottir S., Olafsson K., Eiriksson H., Chosson V., 2011. A pilot
genetic study reveals the absence of spatial genetic structure in Norway lobster (Nephrops norvegicus) on
fi shing grounds in Icelandic waters. ICES Journal of Marine Science, 68, 20-25.
11. Pauly D., 1984. Some simple methods for the assessment of tropical fi sh stocks. Fish. Tech. Pap. No. 234,
 p. 52. Rome: FAO.
12. Robertson J. and Shanks A., 1989. Further studies of the size selection of nephrops by different condents.
Scottish Fisheries Working.
13. Sarda F., Leonart J. and Cartes J., 1998. An analysis of the population dynamics of Nephrops norvegicus (L.)
in the Mediterranean Sea. Scientia Marina, 62, 135-143.
14. Stefansson G., 2012. Yield per recruit analysis. Retrieved January 15, 2012, from Tutor web:
net/fi sh510.5
15. Stefansson G. and Taylor L., 2012. Modelling length at age distribution. Retrieved December 24, 2012, from
Tutor web: fi sh510.3
16. 16. Tuck I., Chapman C. and Atkinson R., 1997. Population biology of the Norway lobster, Nephrops norvegicus
(L.) in the Firth of Clyde, Scotland - I: Growth and density. ICES Journal of Marine Science, 54, 125-135.
17. 17. Tuck I. and Bailey N., 2000. Assessment of Nephrops stocks in Loch Torridon area. Aberdeen: Marine
Laboratory Report.
File đính kèm:
 journal_of_fisheries_science_and_technology_no_32016.pdf

