Nutritional composition and lipid content of skin and muscle of wild giant mottle eels anguilla marmorata in Thua Thien Hue, Vietnam
Abstract: In Vietnam, the giant mottle eel Anguilla marmorata is the most widely distributed species and being exploited for seed in aquaculture as well as for human consumption. This study aims to investigate the basic nutritional components of the fish. The eels were collected from six locations of Thua Thien Hue province, with weights from 5 to 3200 g. In addition, the content of lipid in skin and tissue was also examined. The results show that eel flesh has a relatively high nutritional value. The water, protein, lipid, and total sugar content of the fish meat is 60.4 ± 0.94%, 19.54 ± 4.31%, 18.2 ± 1.02%, and 1.34 ± 0.34 (mg/g), respectively. The nutritional components of the eel have a good correlation with the weight according to the equation: Y = a × ln (W) + b (where W is the weight of eels; Y is the content of nutritional components; a is the correlation coefficient b is a constant) with r > 0.9. The lipid content of the fish skin is higher than that of muscle and meat
Trang 1
Trang 2
Trang 3
Trang 4
Trang 5
Trang 6
Trang 7
Trang 8
Trang 9
Trang 10
Tóm tắt nội dung tài liệu: Nutritional composition and lipid content of skin and muscle of wild giant mottle eels anguilla marmorata in Thua Thien Hue, Vietnam
ent
The protein content of the sample was determined with the Bradford method [11]. The basic
principle of this method is based on the change of the maximum absorption wavelength of
Coomassie dye Brilliant Blue when creating complexes with proteins. In an acidic solution
without protein, the red dye has a maximum absorption wavelength of 465 nm. When combined
with the protein, the color turns blue and maximizes absorption at 595 nm. The absorption at 596
nm is directly related to protein concentration.
To determine the protein in a sample, first, a calibration curve with a known standard
protein solution was constructed. After adding the protein solution to the dye, the color appeared
after two minutes and lasted up to one hour. The absorbance of the solution was measured on a
spectrophotometer (ODX). The absorbance is proportional to the amount of protein in the sample.
A control with HCl (ODO) was carried out. The value ODOD = ODX – ODO was calculated. The
amount of protein in a sample was determined according to the calibration curve from the ØOD
value on the vertical axis, thus deducing the corresponding protein concentration on the
horizontal axis. From the standard equation and the optical density of the sample, the protein
content of the sample is given by formula (3)
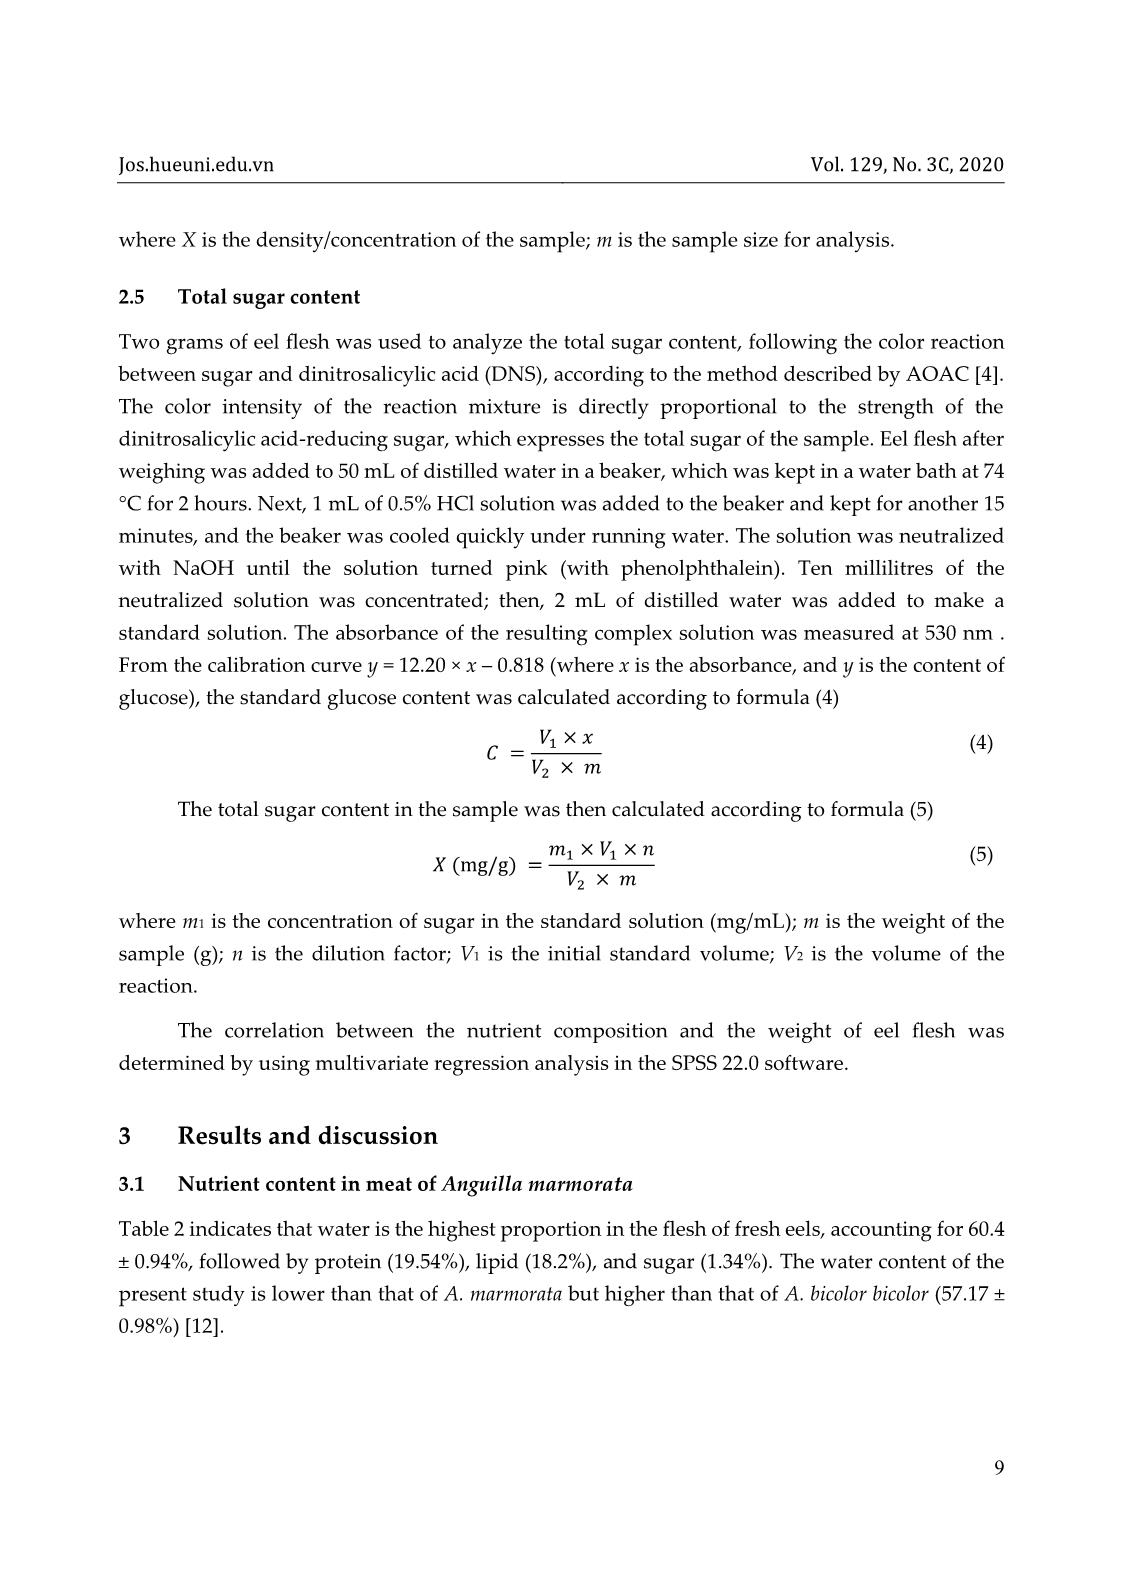
Protein content (mg/g) =
𝑋
1000 × 𝑚
 (3)
Jos.hueuni.edu.vn Vol. 129, No. 3C, 2020
9
where X is the density/concentration of the sample; m is the sample size for analysis.
2.5 Total sugar content
Two grams of eel flesh was used to analyze the total sugar content, following the color reaction
between sugar and dinitrosalicylic acid (DNS), according to the method described by AOAC [4].
The color intensity of the reaction mixture is directly proportional to the strength of the
dinitrosalicylic acid-reducing sugar, which expresses the total sugar of the sample. Eel flesh after
weighing was added to 50 mL of distilled water in a beaker, which was kept in a water bath at 74
°C for 2 hours. Next, 1 mL of 0.5% HCl solution was added to the beaker and kept for another 15
minutes, and the beaker was cooled quickly under running water. The solution was neutralized
with NaOH until the solution turned pink (with phenolphthalein). Ten millilitres of the
neutralized solution was concentrated; then, 2 mL of distilled water was added to make a
standard solution. The absorbance of the resulting complex solution was measured at 530 nm .
From the calibration curve y = 12.20 × x – 0.818 (where x is the absorbance, and y is the content of
glucose), the standard glucose content was calculated according to formula (4)
𝐶 =
𝑉1 × 𝑥
𝑉2 × 𝑚
 (4)
The total sugar content in the sample was then calculated according to formula (5)
𝑋 (mg/g) =
𝑚1 × 𝑉1 × 𝑛
𝑉2 × 𝑚
 (5)
where m1 is the concentration of sugar in the standard solution (mg/mL); m is the weight of the
sample (g); n is the dilution factor; V1 is the initial standard volume; V2 is the volume of the
reaction.
The correlation between the nutrient composition and the weight of eel flesh was
determined by using multivariate regression analysis in the SPSS 22.0 software.
3 Results and discussion
3.1 Nutrient content in meat of Anguilla marmorata
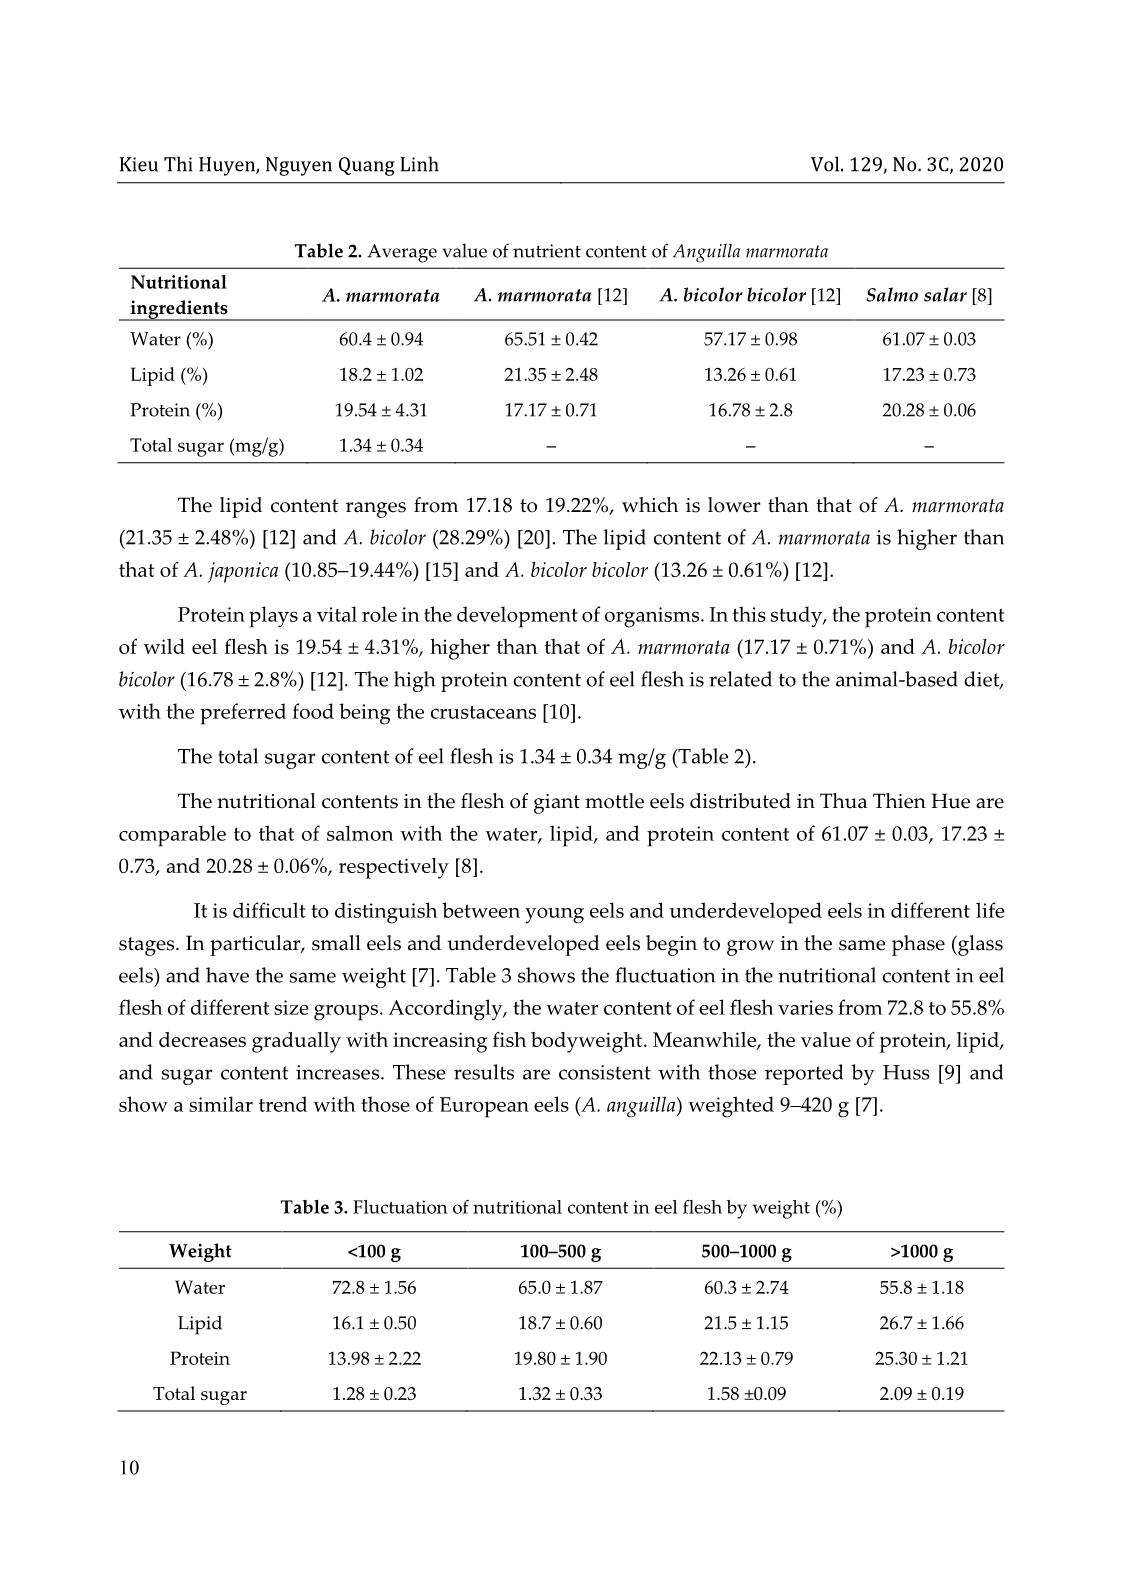
Table 2 indicates that water is the highest proportion in the flesh of fresh eels, accounting for 60.4
± 0.94%, followed by protein (19.54%), lipid (18.2%), and sugar (1.34%). The water content of the
present study is lower than that of A. marmorata but higher than that of A. bicolor bicolor (57.17 ±
0.98%) [12].
Kieu Thi Huyen, Nguyen Quang Linh Vol. 129, No. 3C, 2020
10
The lipid content ranges from 17.18 to 19.22%, which is lower than that of A. marmorata
(21.35 ± 2.48%) [12] and A. bicolor (28.29%) [20]. The lipid content of A. marmorata is higher than
that of A. japonica (10.85–19.44%) [15] and A. bicolor bicolor (13.26 ± 0.61%) [12].
Protein plays a vital role in the development of organisms. In this study, the protein content
of wild eel flesh is 19.54 ± 4.31%, higher than that of A. marmorata (17.17 ± 0.71%) and A. bicolor
bicolor (16.78 ± 2.8%) [12]. The high protein content of eel flesh is related to the animal-based diet,
with the preferred food being the crustaceans [10].
The total sugar content of eel flesh is 1.34 ± 0.34 mg/g (Table 2).
The nutritional contents in the flesh of giant mottle eels distributed in Thua Thien Hue are
comparable to that of salmon with the water, lipid, and protein content of 61.07 ± 0.03, 17.23 ±
0.73, and 20.28 ± 0.06%, respectively [8].
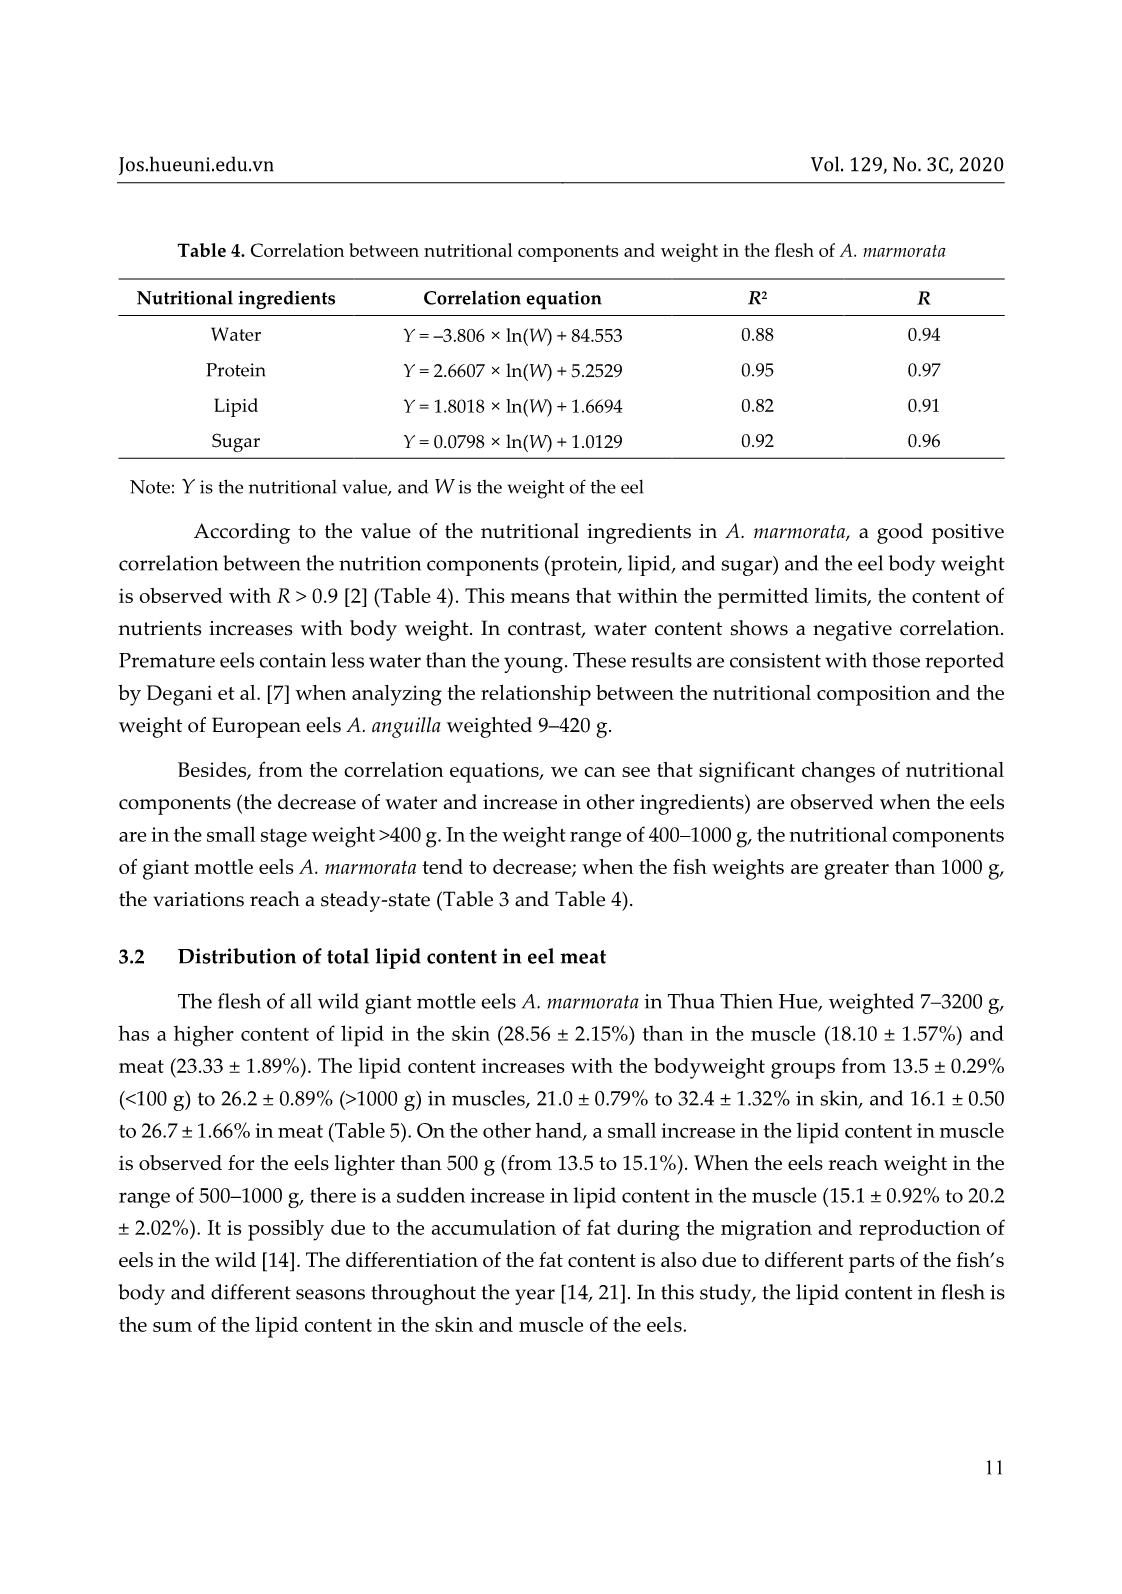
It is difficult to distinguish between young eels and underdeveloped eels in different life
stages. In particular, small eels and underdeveloped eels begin to grow in the same phase (glass
eels) and have the same weight [7]. Table 3 shows the fluctuation in the nutritional content in eel
flesh of different size groups. Accordingly, the water content of eel flesh varies from 72.8 to 55.8%
and decreases gradually with increasing fish bodyweight. Meanwhile, the value of protein, lipid,
and sugar content increases. These results are consistent with those reported by Huss [9] and
show a similar trend with those of European eels (A. anguilla) weighted 9–420 g [7].
Table 3. Fluctuation of nutritional content in eel flesh by weight (%)
Weight 1000 g
Water 72.8 ± 1.56 65.0 ± 1.87 60.3 ± 2.74 55.8 ± 1.18
Lipid 16.1 ± 0.50 18.7 ± 0.60 21.5 ± 1.15 26.7 ± 1.66
Protein 13.98 ± 2.22 19.80 ± 1.90 22.13 ± 0.79 25.30 ± 1.21
Total sugar 1.28 ± 0.23 1.32 ± 0.33 1.58 ±0.09 2.09 ± 0.19
Table 2. Average value of nutrient content of Anguilla marmorata
Nutritional
ingredients
A. marmorata A. marmorata [12] A. bicolor bicolor [12] Salmo salar [8]
Water (%) 60.4 ± 0.94 65.51 ± 0.42 57.17 ± 0.98 61.07 ± 0.03
Lipid (%) 18.2 ± 1.02 21.35 ± 2.48 13.26 ± 0.61 17.23 ± 0.73
Protein (%) 19.54 ± 4.31 17.17 ± 0.71 16.78 ± 2.8 20.28 ± 0.06
Total sugar (mg/g) 1.34 ± 0.34 – – –
Jos.hueuni.edu.vn Vol. 129, No. 3C, 2020
11
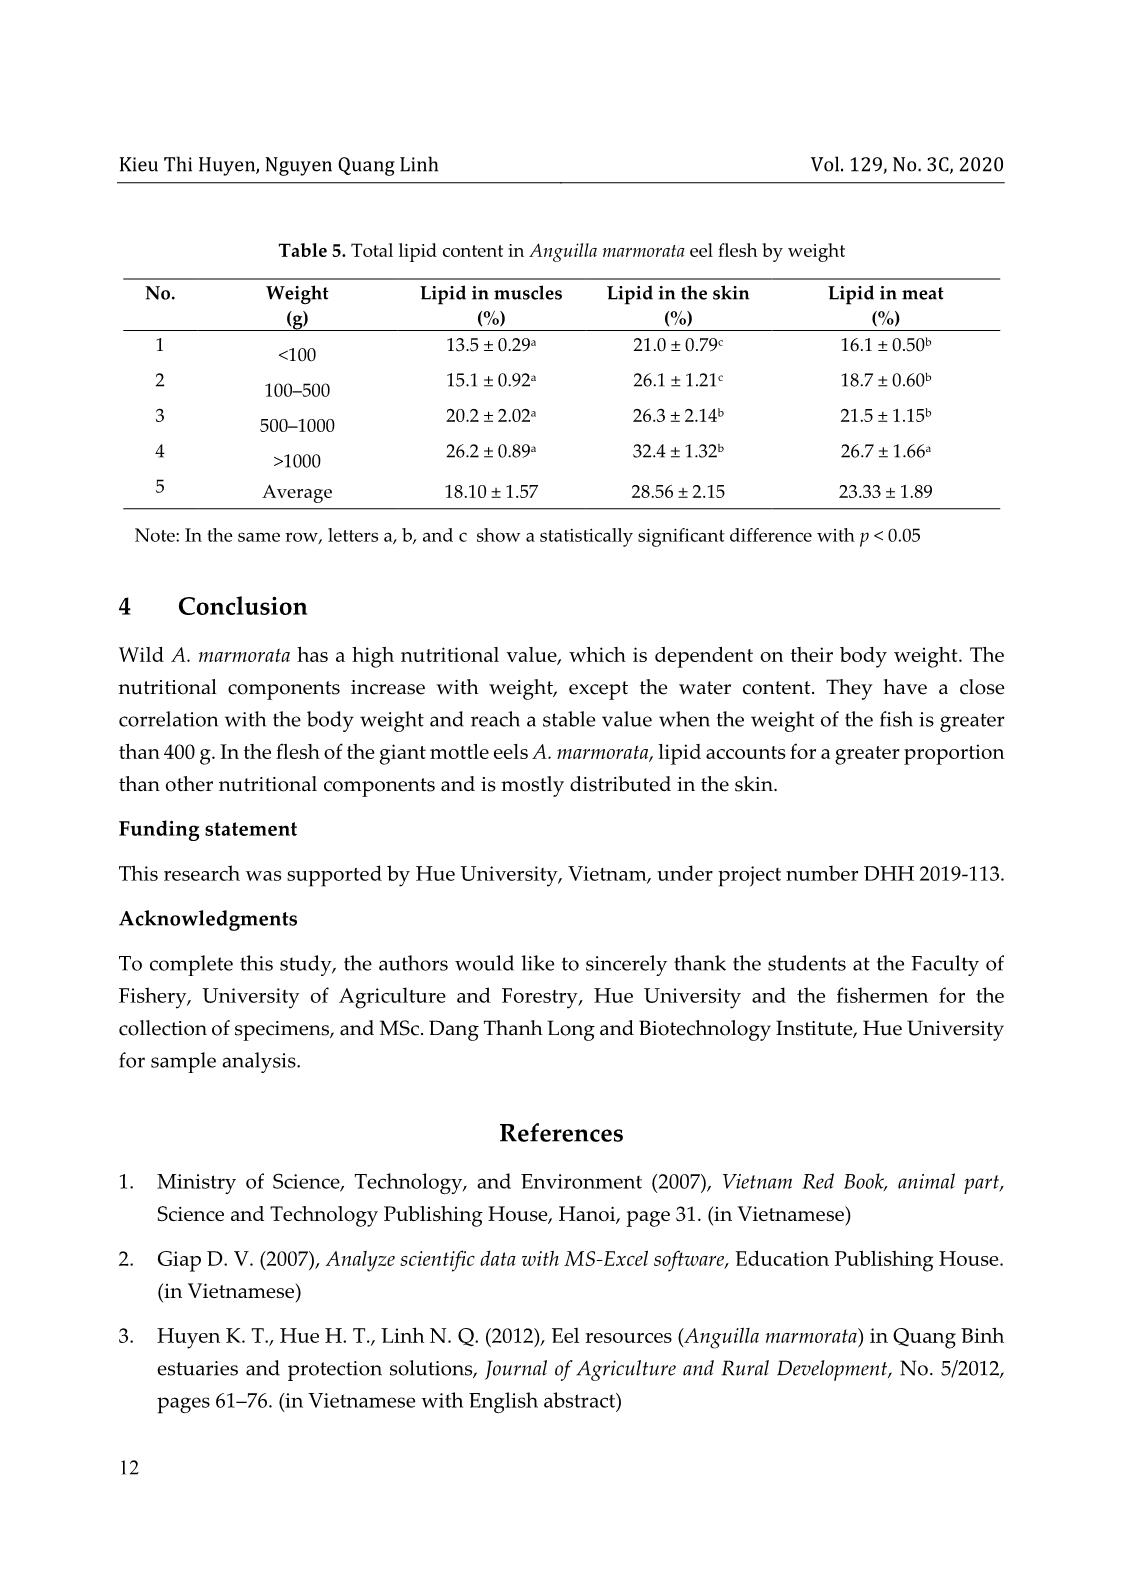
Table 4. Correlation between nutritional components and weight in the flesh of A. marmorata
Nutritional ingredients Correlation equation R2 R
Water Y = –3.806 × ln(W) + 84.553 0.88 0.94
Protein Y = 2.6607 × ln(W) + 5.2529 0.95 0.97
Lipid Y = 1.8018 × ln(W) + 1.6694 0.82 0.91
Sugar Y = 0.0798 × ln(W) + 1.0129 0.92 0.96
Note: Y is the nutritional value, and W is the weight of the eel
According to the value of the nutritional ingredients in A. marmorata, a good positive
correlation between the nutrition components (protein, lipid, and sugar) and the eel body weight
is observed with R > 0.9 [2] (Table 4). This means that within the permitted limits, the content of
nutrients increases with body weight. In contrast, water content shows a negative correlation.
Premature eels contain less water than the young. These results are consistent with those reported
by Degani et al. [7] when analyzing the relationship between the nutritional composition and the
weight of European eels A. anguilla weighted 9–420 g.
Besides, from the correlation equations, we can see that significant changes of nutritional
components (the decrease of water and increase in other ingredients) are observed when the eels
are in the small stage weight >400 g. In the weight range of 400–1000 g, the nutritional components
of giant mottle eels A. marmorata tend to decrease; when the fish weights are greater than 1000 g,
the variations reach a steady-state (Table 3 and Table 4).
3.2 Distribution of total lipid content in eel meat
The flesh of all wild giant mottle eels A. marmorata in Thua Thien Hue, weighted 7–3200 g,
has a higher content of lipid in the skin (28.56 ± 2.15%) than in the muscle (18.10 ± 1.57%) and
meat (23.33 ± 1.89%). The lipid content increases with the bodyweight groups from 13.5 ± 0.29%
(1000 g) in muscles, 21.0 ± 0.79% to 32.4 ± 1.32% in skin, and 16.1 ± 0.50
to 26.7 ± 1.66% in meat (Table 5). On the other hand, a small increase in the lipid content in muscle
is observed for the eels lighter than 500 g (from 13.5 to 15.1%). When the eels reach weight in the
range of 500–1000 g, there is a sudden increase in lipid content in the muscle (15.1 ± 0.92% to 20.2
± 2.02%). It is possibly due to the accumulation of fat during the migration and reproduction of
eels in the wild [14]. The differentiation of the fat content is also due to different parts of the fish’s
body and different seasons throughout the year [14, 21]. In this study, the lipid content in flesh is
the sum of the lipid content in the skin and muscle of the eels.
Kieu Thi Huyen, Nguyen Quang Linh Vol. 129, No. 3C, 2020
12
Table 5. Total lipid content in Anguilla marmorata eel flesh by weight
No. Weight
(g)
Lipid in muscles
(%)
Lipid in the skin
(%)
Lipid in meat
(%)
1
<100
13.5 ± 0.29a 21.0 ± 0.79c 16.1 ± 0.50b
2
100–500
15.1 ± 0.92a 26.1 ± 1.21c 18.7 ± 0.60b
3
500–1000
20.2 ± 2.02a 26.3 ± 2.14b 21.5 ± 1.15b
4
>1000
26.2 ± 0.89a 32.4 ± 1.32b 26.7 ± 1.66a
5 Average 18.10 ± 1.57 28.56 ± 2.15 23.33 ± 1.89
Note: In the same row, letters a, b, and c show a statistically significant difference with p < 0.05
4 Conclusion
Wild A. marmorata has a high nutritional value, which is dependent on their body weight. The
nutritional components increase with weight, except the water content. They have a close
correlation with the body weight and reach a stable value when the weight of the fish is greater
than 400 g. In the flesh of the giant mottle eels A. marmorata, lipid accounts for a greater proportion
than other nutritional components and is mostly distributed in the skin.
Funding statement
This research was supported by Hue University, Vietnam, under project number DHH 2019-113.
Acknowledgments
To complete this study, the authors would like to sincerely thank the students at the Faculty of
Fishery, University of Agriculture and Forestry, Hue University and the fishermen for the
collection of specimens, and MSc. Dang Thanh Long and Biotechnology Institute, Hue University
for sample analysis.
References
1. Ministry of Science, Technology, and Environment (2007), Vietnam Red Book, animal part,
Science and Technology Publishing House, Hanoi, page 31. (in Vietnamese)
2. Giap D. V. (2007), Analyze scientific data with MS-Excel software, Education Publishing House.
(in Vietnamese)
3. Huyen K. T., Hue H. T., Linh N. Q. (2012), Eel resources (Anguilla marmorata) in Quang Binh
estuaries and protection solutions, Journal of Agriculture and Rural Development, No. 5/2012,
pages 61–76. (in Vietnamese with English abstract)
Jos.hueuni.edu.vn Vol. 129, No. 3C, 2020
13
4. Association of Official Analytical Chemist (AOAC) (2005), Official Method of Analysis of The
Association of Official Analytical of Chemist. Arlington (U.S.): The Association of Official
Analytical Chemist, Inc.
5. Ashraf M., Zafar A., Rauf A., Mehboob S., Qureshi N. A. (2011), Nutritional values of wild
and cultivated silver carp (Hypophthalmichthys molitrix) and grass carp (Ctenopharyngodon
idella), Int. J. Agric. Biol., 13, 210–214.
6. Ege V. (1939), A Revision of the Genus Anguilla Shaw, a Systematic, Phylogenetic and
Geographical Study, Dana Rep. 16, 1–256.
7. Gad Degani, Hani Hahamu and Dan Levanon (1986), The relationship of eel Anguilla
Anguilla (L) body size, lipid, protein, glucose, ash, moisture composition and enzyme
activity (Aldolase), Comp. Biochem. Physiol, 84A(4), 739–745.
8. Gulgun F., Sengor U., Alakavuk D. U., Tosun S. Y. (2013), Effect of cooking methods on
proxymate composition, fatty acid composition, and cholesterol content of Atlantic salmon
(Salmo salar), Journal Aquatic product technology, 22(2), 160–167.
9. Huss H. H. (1988), Fresh fish quality and quality changes, Food and Agriculture Organization of the
United Nations, Danish International Development Agency, No. 29, Rome, FAO Fisheries
Series 29.
10. Huyen K. T., Linh N. Q. (2019), Characterization of giant mottled eel (Anguilla marmorata)
gastrointestinal tract that origin from Thua Thien Hue, Vietnam, J Fish Res., 3(2), 4–9.
DOI: 10.35841/fisheries-research.3.2.4-9.
11. Marion M. B. (1976), A rapid and a sensitive method for the quantitation of microgram
protein utilising the principle of protein-dye binding, Anal. Biochem., 72, 248–254.
12. Nafsiyah I., Nurilmala M., Abdullah A. (2018), Komposisi nutrisi ikan sidat Anguilla bicolor
bicolor dan Anguilla marmorata/ Nutrient Composition of Eel Anguilla bicolor bicolor and
Anguilla marmorata, Jurnal Pengolahan Hasil Perikanan Indonesia, 21(3), 504–512.
13. Pike C., Crook V., Gollock M., Jacoby D. (2019), Anguilla marmorata (errata version published
in 2020). The IUCN Red List of Threatened Species 2019: e.T166189A167699312. [Downloaded
on 08 May 2020]. https://dx.doi.org/10.2305/IUCN.UK.2019-3.RLTS.T166189A167699312.en.
14. Oduor-Odote P. M., Kazungu J. M. (2008), The body composition of low-value fish and their
preparation into higher value snack food, Western Indian Ocean Journal of Marine Science, 7(1),
111–117. DOI: 10.4314/wiojms.v7i1.48271.
15. Seo J. S., Choi J. H., Seo J. H., Ahn T. H., Chong W. S., Kim S. H., Ahn J. C. (2013),
Comparison of major nutrients in eels Anguilla japonica cultured with different formula
Kieu Thi Huyen, Nguyen Quang Linh Vol. 129, No. 3C, 2020
14
feeds or at different farms, Fish. Aqua. Sci., 16(2), 85–92.
16. Watanabe S. (2003), Taxonomy of the Freshwater Eels, Genus Anguilla Schrank, 1798. In: Aida
K., Tsukamoto K., Yamauchi K. (eds) Eel Biology . Springer, Tokyo.
https://link.springer.com/chapter/10.1007%2F978-4-431-65907-5_1.
17. Watanabe S., Aoyama J., Tsukamoto K. (2004), Reexamination of Ege’s (1939) Use of
taxonomic characters of the genus Anguilla, Bulletin of Marine Science, 74, 337–351.
18. Watanabe S., Aoyama J., Nishida M., Tsukamoto K. (2005), A molecular genetic evaluation
of the taxonomy of eels of the genus Anguilla (Pisces: Anguilliformes), Bulletin of Marine
Science 76(3), 675–690.
19. Watanabe S., Miller M. J., Aoyama J., Tsukamoto K. (2009), Morphological and meristic
evaluation of the population structure of Anguilla marmorata across its range, J. Fish Biol., 74
(2069–2093). https://doi.org/10.1111/j.1095-8649.2009.02297.x.
20. Widyasari R. H. E., Kusharto C. M., Wiryawan B., Wiyono E. S., Suseno S.H. (2014),
Pemanfaatan Limbah Ikan Sidat Indonesia (Anguilla bicolor) sebagai Tepung pada Industri
Pengolahan Ikan di Palabuhanratu, Kabupaten Sukabumi, J. Gizi dan Pangan, 8(3), 215—220.
21. Wijayanti I., Setiyorini E. S. S. (2018), Nutritional Content of Wild and Cultured Eel (Anguilla
bicolor) from Southern Coast of Central Java, Jurnal Ilmu Kelautan, 23(1), 37–44.
DOI: https://doi.org/10.14710/ik.ijms.23.1.37-44.
File đính kèm:
 nutritional_composition_and_lipid_content_of_skin_and_muscle.pdf

