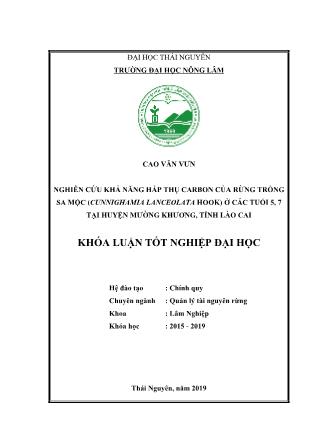
Khóa luận Nghiên cứu khả năng hấp thụ carbon của rừng trồng sa mộc (Cunnighamia lanceolata Hook ) ở các tuổi 5,7 tại huyện Mường Khương, tỉnh Lào Cai
PHẦN 1
MỞ ĐẦU
1.1. Đặt vấn đề
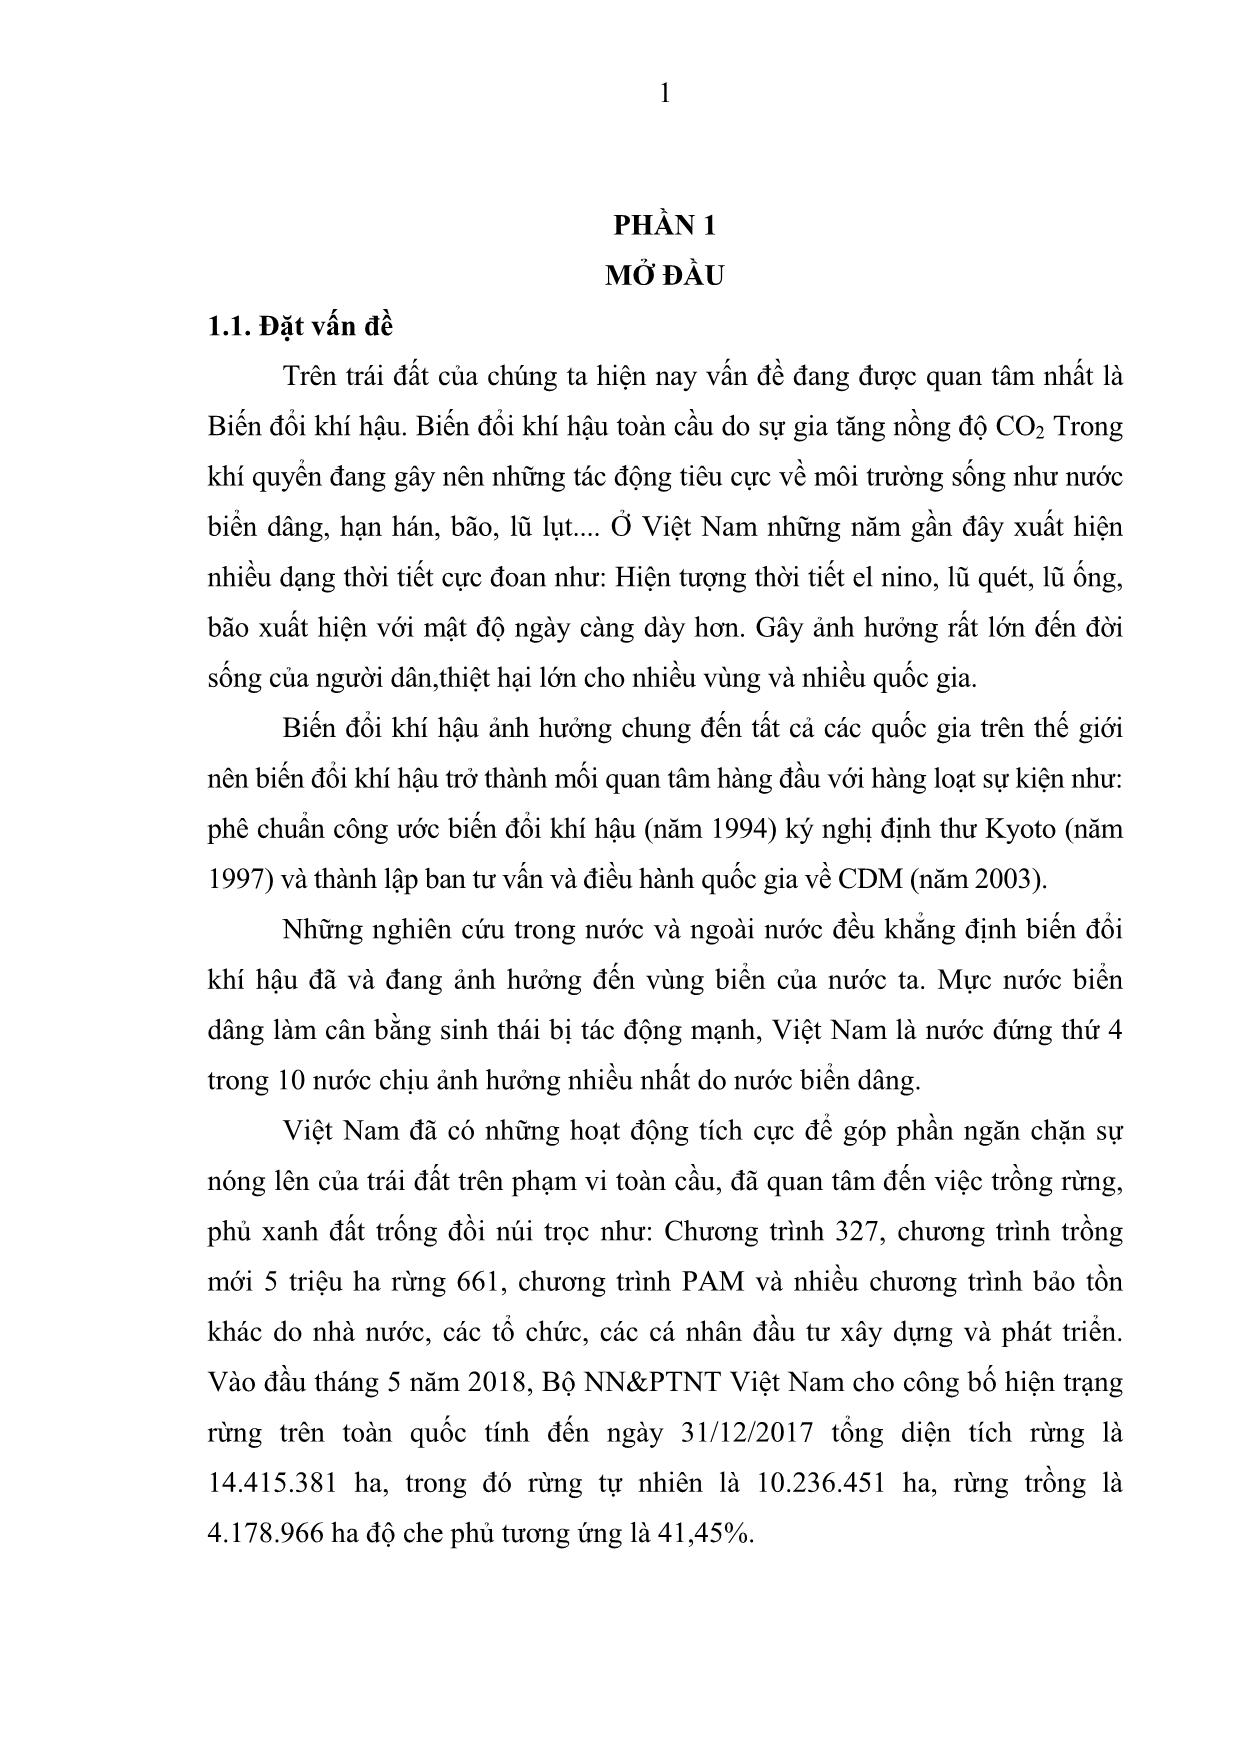
Trên trái đất của chúng ta hiện nay vấn đề đang được quan tâm nhất là
Biến đổi khí hậu. Biến đổi khí hậu toàn cầu do sự gia tăng nồng độ CO2 Trong
khí quyển đang gây nên những tác động tiêu cực về môi trường sống như nước
biển dâng, hạn hán, bão, lũ lụt. Ở Việt Nam những năm gần đây xuất hiện
nhiều dạng thời tiết cực đoan như: Hiện tượng thời tiết el nino, lũ quét, lũ ống,
bão xuất hiện với mật độ ngày càng dày hơn. Gây ảnh hưởng rất lớn đến đời
sống của người dân,thiệt hại lớn cho nhiều vùng và nhiều quốc gia.
Biến đổi khí hậu ảnh hưởng chung đến tất cả các quốc gia trên thế giới
nên biến đổi khí hậu trở thành mối quan tâm hàng đầu với hàng loạt sự kiện như:
phê chuẩn công ước biến đổi khí hậu (năm 1994) ký nghị định thư Kyoto (năm
1997) và thành lập ban tư vấn và điều hành quốc gia về CDM (năm 2003).
Những nghiên cứu trong nước và ngoài nước đều khẳng định biến đổi
khí hậu đã và đang ảnh hưởng đến vùng biển của nước ta. Mực nước biển
dâng làm cân bằng sinh thái bị tác động mạnh, Việt Nam là nước đứng thứ 4
trong 10 nước chịu ảnh hưởng nhiều nhất do nước biển dâng.
Việt Nam đã có những hoạt động tích cực để góp phần ngăn chặn sự
nóng lên của trái đất trên phạm vi toàn cầu, đã quan tâm đến việc trồng rừng,
phủ xanh đất trống đồi núi trọc như: Chương trình 327, chương trình trồng
mới 5 triệu ha rừng 661, chương trình PAM và nhiều chương trình bảo tồn
khác do nhà nước, các tổ chức, các cá nhân đầu tư xây dựng và phát triển.
Vào đầu tháng 5 năm 2018, Bộ NN&PTNT Việt Nam cho công bố hiện trạng
rừng trên toàn quốc tính đến ngày 31/12/2017 tổng diện tích rừng là
14.415.381 ha, trong đó rừng tự nhiên là 10.236.451 ha, rừng trồng là
4.178.966 ha độ che phủ tương ứng là 41,45%.2
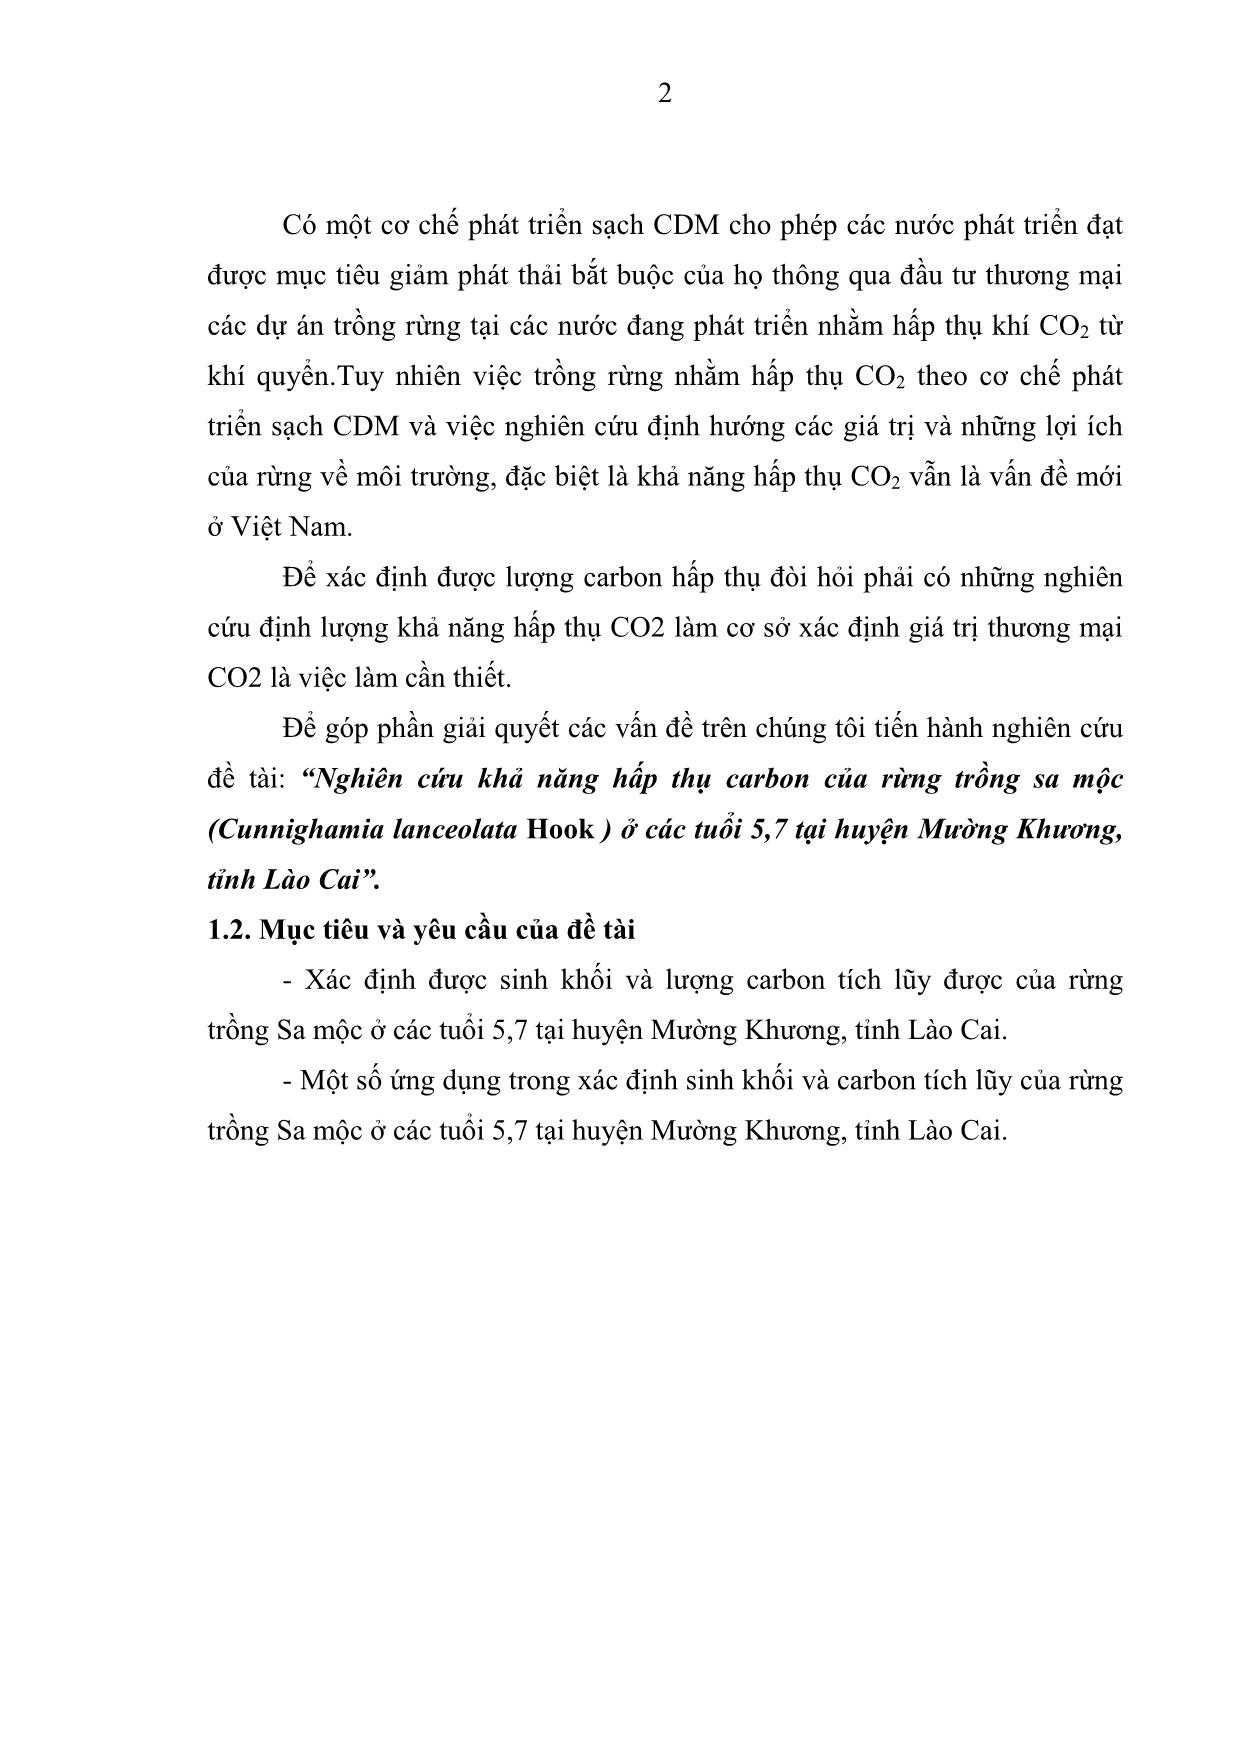
Có một cơ chế phát triển sạch CDM cho phép các nước phát triển đạt
được mục tiêu giảm phát thải bắt buộc của họ thông qua đầu tư thương mại
các dự án trồng rừng tại các nước đang phát triển nhằm hấp thụ khí CO2 từ
khí quyển.Tuy nhiên việc trồng rừng nhằm hấp thụ CO2 theo cơ chế phát
triển sạch CDM và việc nghiên cứu định hướng các giá trị và những lợi ích
của rừng về môi trường, đặc biệt là khả năng hấp thụ CO2 vẫn là vấn đề mới
ở Việt Nam.
Để xác định được lượng carbon hấp thụ đòi hỏi phải có những nghiên
cứu định lượng khả năng hấp thụ CO2 làm cơ sở xác định giá trị thương mại
CO2 là việc làm cần thiết.
Để góp phần giải quyết các vấn đề trên chúng tôi tiến hành nghiên cứu
đề tài: “Nghiên cứu khả năng hấp thụ carbon của rừng trồng sa mộc
(Cunnighamia lanceolata Hook ) ở các tuổi 5,7 tại huyện Mường Khương,
tỉnh Lào Cai”.
1.2. Mục tiêu và yêu cầu của đề tài
- Xác định được sinh khối và lượng carbon tích lũy được của rừng
trồng Sa mộc ở các tuổi 5,7 tại huyện Mường Khương, tỉnh Lào Cai.
- Một số ứng dụng trong xác định sinh khối và carbon tích lũy của rừng
trồng Sa mộc ở các tuổi 5,7 tại huyện Mường Khương, tỉnh Lào Cai.
Trang 1
Trang 2
Trang 3
Trang 4
Trang 5
Trang 6
Trang 7
Trang 8
Trang 9
Trang 10
Tải về để xem bản đầy đủ
Tóm tắt nội dung tài liệu: Khóa luận Nghiên cứu khả năng hấp thụ carbon của rừng trồng sa mộc (Cunnighamia lanceolata Hook ) ở các tuổi 5,7 tại huyện Mường Khương, tỉnh Lào Cai
reated Cases 0
a. Cases with a missing value in any variable are excluded from the analysis.
Variable Processing Summary
 Variables
Dependent Independent
SKT D1.3
Number of Positive Values 6 6
Number of Zeros 0 0
Number of Negative Values 0 0
Number of Missing Values
User-Missing 0 0
System-Missing 0 0
SKT
Linear
Model Summary
R R Square Adjusted R
Square
Std. Error of the
Estimate
.840 .706 .632 .792
The independent variable is D1.3.
ANOVA
 Sum of Squares df Mean Square F Sig.
Regression 6.022 1 6.022 9.594 .036
Residual 2.511 4 .628
Total 8.533 5
The independent variable is D1.3.
Coefficients
 Unstandardized Coefficients Standardized
Coefficients
t Sig.
B Std. Error Beta
D1.3 1.445 .466 .840 3.097 .036
(Constant) 1.626 3.065 .531 .624
 Logarithmic
Model Summary
R R Square Adjusted R
Square
Std. Error of the
Estimate
.841 .707 .634 .790
The independent variable is D1.3.
ANOVA
 Sum of Squares df Mean Square F Sig.
Regression 6.036 1 6.036 9.669 .036
Residual 2.497 4 .624
Total 8.533 5
The independent variable is D1.3.
Coefficients
 Unstandardized Coefficients Standardized
Coefficients
t Sig.
B Std. Error Beta
ln(D1.3) 9.411 3.027 .841 3.110 .036
(Constant) -6.546 5.673 -1.154 .313
Compound
Model Summary
R R Square Adjusted R
Square
Std. Error of the
Estimate
.839 .703 .629 .072
The independent variable is D1.3.
ANOVA
 Sum of Squares df Mean Square F Sig.
Regression .050 1 .050 9.474 .037
Residual .021 4 .005
Total .071 5
The independent variable is D1.3.
Coefficients
 Unstandardized Coefficients Standardized
Coefficients
t Sig.
B Std. Error Beta
D1.3 1.140 .049 2.313 23.476 .000
(Constant) 4.670 1.307 3.572 .023
The dependent variable is ln(SKT).
 Power
Model Summary
R R Square Adjusted R
Square
Std. Error of the
Estimate
.840 .705 .631 .072
The independent variable is D1.3.
ANOVA
 Sum of Squares df Mean Square F Sig.
Regression .050 1 .050 9.568 .036
Residual .021 4 .005
Total .071 5
The independent variable is D1.3.
Coefficients
 Unstandardized Coefficients Standardized
Coefficients
t Sig.
B Std. Error Beta
ln(D1.3) .854 .276 .840 3.093 .036
(Constant) 2.223 1.151 1.931 .126
The dependent variable is ln(SKT).
 2. Sinh khối khô tuổi 5
a. The model requires all non-missing values to be positive.
Case Processing Summary
 N
Total Cases 6
Excluded Casesa 0
Forecasted Cases 0
Newly Created Cases 0
a. Cases with a missing value in any variable are excluded from the analysis.
Variable Processing Summary
 Variables
Dependent Independent
SKK D1.3
Number of Positive Values 6 6
Number of Zeros 0 0
Number of Negative Values 0 0
Number of Missing Values
User-Missing 0 0
System-Missing 0 0
SKK
Linear
Model Summary
R R Square Adjusted R
Square
Std. Error of the
Estimate
.848 .719 .649 .372
The independent variable is D1.3.
ANOVA
 Sum of Squares df Mean Square F Sig.
Regression 1.418 1 1.418 10.243 .033
Residual .554 4 .138
Total 1.972 5
The independent variable is D1.3.
Coefficients
 Unstandardized Coefficients Standardized
Coefficients
t Sig.
B Std. Error Beta
D1.3 .701 .219 .848 3.201 .033
(Constant) 1.684 1.439 1.170 .307
 Logarithmic
Model Summary
R R Square Adjusted R
Square
Std. Error of the
Estimate
.850 .723 .654 .369
The independent variable is D1.3.
ANOVA
 Sum of Squares df Mean Square F Sig.
Regression 1.426 1 1.426 10.443 .032
Residual .546 4 .137
Total 1.972 5
The independent variable is D1.3.
Coefficients
 Unstandardized Coefficients Standardized
Coefficients
t Sig.
B Std. Error Beta
ln(D1.3) 4.573 1.415 .850 3.231 .032
(Constant) -2.294 2.653 -.865 .436
Compound
Model Summary
R R Square Adjusted R
Square
Std. Error of the
Estimate
.833 .694 .618 .064
The independent variable is D1.3.
ANOVA
 Sum of Squares df Mean Square F Sig.
Regression .038 1 .038 9.090 .039
Residual .017 4 .004
Total .054 5
The independent variable is D1.3.
Coefficients
 Unstandardized Coefficients Standardized
Coefficients
t Sig.
B Std. Error Beta
D1.3 1.121 .042 2.301 26.392 .000
(Constant) 2.957 .736 4.016 .016
The dependent variable is ln(SKK).
 Power
Model Summary
R R Square Adjusted R
Square
Std. Error of the
Estimate
.836 .699 .623 .064
The independent variable is D1.3.
ANOVA
 Sum of Squares df Mean Square F Sig.
Regression .038 1 .038 9.267 .038
Residual .016 4 .004
Total .054 5
The independent variable is D1.3.
Coefficients
 Unstandardized Coefficients Standardized
Coefficients
t Sig.
B Std. Error Beta
ln(D1.3) .746 .245 .836 3.044 .038
(Constant) 1.545 .709 2.178 .095
The dependent variable is ln(SKK).
 3. Carbon
a. The model requires all non-missing values to be positive.
Case Processing Summary
 N
Total Cases 6
Excluded Casesa 0
Forecasted Cases 0
Newly Created Cases 0
a. Cases with a missing value in any variable are excluded from the analysis.
Variable Processing Summary
 Variables
Dependent Independent
CARBON D1.3
Number of Positive Values 6 6
Number of Zeros 0 0
Number of Negative Values 0 0
Number of Missing Values
User-Missing 0 0
System-Missing 0 0
CARBON
Linear
Model Summary
R R Square Adjusted R
Square
Std. Error of the
Estimate
.908 .825 .781 .112
The independent variable is D1.3.
ANOVA
 Sum of Squares df Mean Square F Sig.
Regression .237 1 .237 18.875 .012
Residual .050 4 .013
Total .287 5
The independent variable is D1.3.
Coefficients
 Unstandardized Coefficients Standardized
Coefficients
t Sig.
B Std. Error Beta
D1.3 .286 .066 .908 4.345 .012
(Constant) 1.328 .433 3.065 .037
 Logarithmic
Model Summary
R R Square Adjusted R
Square
Std. Error of the
Estimate
.907 .822 .777 .113
The independent variable is D1.3.
ANOVA
 Sum of Squares df Mean Square F Sig.
Regression .236 1 .236 18.444 .013
Residual .051 4 .013
Total .287 5
The independent variable is D1.3.
Coefficients
 Unstandardized Coefficients Standardized
Coefficients
t Sig.
B Std. Error Beta
ln(D1.3) 1.860 .433 .907 4.295 .013
(Constant) -.281 .812 -.347 .746
Compound
Model Summary
R R Square Adjusted R
Square
Std. Error of the
Estimate
.912 .831 .789 .034
The independent variable is D1.3.
ANOVA
 Sum of Squares df Mean Square F Sig.
Regression .023 1 .023 19.677 .011
Residual .005 4 .001
Total .028 5
The independent variable is D1.3.
Coefficients
 Unstandardized Coefficients Standardized
Coefficients
t Sig.
B Std. Error Beta
D1.3 1.093 .022 2.488 49.638 .000
(Constant) 1.780 .236 7.553 .002
The dependent variable is ln(CARBON).
 Power
Model Summary
R R Square Adjusted R
Square
Std. Error of the
Estimate
.910 .828 .785 .035
The independent variable is D1.3.
ANOVA
 Sum of Squares df Mean Square F Sig.
Regression .023 1 .023 19.234 .012
Residual .005 4 .001
Total .028 5
The independent variable is D1.3.
Coefficients
 Unstandardized Coefficients Standardized
Coefficients
t Sig.
B Std. Error Beta
ln(D1.3) .580 .132 .910 4.386 .012
(Constant) 1.078 .267 4.031 .016
The dependent variable is ln(CARBON).
 4. Sinh khối khô tuổi 7
a. The model requires all non-missing values to be positive.
Case Processing Summary
 N
Total Cases 6
Excluded Casesa 0
Forecasted Cases 0
Newly Created Cases 0
a. Cases with a missing value in any variable are excluded from the analysis.
Variable Processing Summary
 Variables
Dependent Independent
SKK D1.3
Number of Positive Values 6 6
Number of Zeros 0 0
Number of Negative Values 0 0
Number of Missing Values
User-Missing 0 0
System-Missing 0 0
SKK
Linear
Model Summary
R R Square Adjusted R
Square
Std. Error of the
Estimate
.979 .959 .949 .102
The independent variable is D1.3.
ANOVA
 Sum of Squares df Mean Square F Sig.
Regression .989 1 .989 94.394 .001
Residual .042 4 .010
Total 1.031 5
The independent variable is D1.3.
Coefficients
 Unstandardized Coefficients Standardized
Coefficients
t Sig.
B Std. Error Beta
D1.3 2.424 .249 .979 9.716 .001
(Constant) -6.796 2.167 -3.137 .035
Logarithmic
Model Summary
R R Square Adjusted R
Square
Std. Error of the
Estimate
.978 .957 .946 .105
The independent variable is D1.3.
ANOVA
 Sum of Squares df Mean Square F Sig.
Regression .987 1 .987 89.435 .001
Residual .044 4 .011
Total 1.031 5
The independent variable is D1.3.
Coefficients
 Unstandardized Coefficients Standardized
Coefficients
t Sig.
B Std. Error Beta
ln(D1.3) 20.941 2.214 .978 9.457 .001
(Constant) -31.008 4.786 -6.479 .003
Compound
Model Summary
R R Square Adjusted R
Square
Std. Error of the
Estimate
.981 .961 .952 .007
The independent variable is D1.3.
ANOVA
 Sum of Squares df Mean Square F Sig.
Regression .005 1 .005 99.753 .001
Residual .000 4 .000
Total .005 5
The independent variable is D1.3.
Coefficients
 Unstandardized Coefficients Standardized
Coefficients
t Sig.
B Std. Error Beta
D1.3 1.186 .020 2.666 58.553 .000
(Constant) 3.239 .480 6.742 .003
The dependent variable is ln(SKK).
Power
Model Summary
R R Square Adjusted R
Square
Std. Error of the
Estimate
.980 .959 .949 .007
The independent variable is D1.3.
 ANOVA
 Sum of Squares df Mean Square F Sig.
Regression .005 1 .005 94.590 .001
Residual .000 4 .000
Total .005 5
The independent variable is D1.3.
Coefficients
 Unstandardized Coefficients Standardized
Coefficients
t Sig.
B Std. Error Beta
ln(D1.3) 1.474 .152 .980 9.726 .001
(Constant) .589 .193 3.053 .038
The dependent variable is ln(SKK).
 5. Sinh khối tươi tuổi 7
a. The model requires all non-missing values to be positive.
Case Processing Summary
 N
Total Cases 6
Excluded Casesa 0
Forecasted Cases 0
Newly Created Cases 0
a. Cases with a missing value in any variable are excluded from the analysis.
Variable Processing Summary
 Variables
Dependent Independent
SKT D1.3
Number of Positive Values 6 6
Number of Zeros 0 0
Number of Negative Values 0 0
Number of Missing Values
User-Missing 0 0
System-Missing 0 0
SKT
Linear
Model Summary
R R Square Adjusted R
Square
Std. Error of the
Estimate
.910 .829 .786 .494
The independent variable is D1.3.
ANOVA
 Sum of Squares df Mean Square F Sig.
Regression 4.732 1 4.732 19.379 .012
Residual .977 4 .244
Total 5.709 5
The independent variable is D1.3.
Coefficients
 Unstandardized Coefficients Standardized
Coefficients
t Sig.
B Std. Error Beta
D1.3 5.302 1.204 .910 4.402 .012
(Constant) -15.964 10.460 -1.526 .202
 Logarithmic
Model Summary
R R Square Adjusted R
Square
Std. Error of the
Estimate
.911 .831 .789 .491
The independent variable is D1.3.
ANOVA
 Sum of Squares df Mean Square F Sig.
Regression 4.743 1 4.743 19.642 .011
Residual .966 4 .241
Total 5.709 5
The independent variable is D1.3.
Coefficients
 Unstandardized Coefficients Standardized
Coefficients
t Sig.
B Std. Error Beta
ln(D1.3) 45.913 10.360 .911 4.432 .011
(Constant) -69.153 22.390 -3.089 .037
Compound
Model Summary
R R Square Adjusted R
Square
Std. Error of the
Estimate
.914 .836 .795 .016
The independent variable is D1.3.
ANOVA
 Sum of Squares df Mean Square F Sig.
Regression .005 1 .005 20.384 .011
Residual .001 4 .000
Total .006 5
The independent variable is D1.3.
Coefficients
 Unstandardized Coefficients Standardized
Coefficients
t Sig.
B Std. Error Beta
D1.3 1.194 .047 2.495 25.414 .000
(Constant) 6.427 2.196 2.926 .043
The dependent variable is ln(SKT).
 Power
Model Summary
R R Square Adjusted R
Square
Std. Error of the
Estimate
.915 .838 .797 .016
The independent variable is D1.3.
ANOVA
 Sum of Squares df Mean Square F Sig.
Regression .005 1 .005 20.691 .010
Residual .001 4 .000
Total .006 5
The independent variable is D1.3.
Coefficients
 Unstandardized Coefficients Standardized
Coefficients
t Sig.
B Std. Error Beta
ln(D1.3) 1.539 .338 .915 4.549 .010
(Constant) 1.081 .790 1.368 .243
The dependent variable is ln(SKT).
 6. Carbon
a. The model requires all non-missing values to be positive.
Case Processing Summary
 N
Total Cases 6
Excluded Casesa 0
Forecasted Cases 0
Newly Created Cases 0
a. Cases with a missing value in any variable are excluded from the analysis.
Variable Processing Summary
 Variables
Dependent Independent
CARBON D1.3
Number of Positive Values 6 6
Number of Zeros 0 0
Number of Negative Values 0 0
Number of Missing Values
User-Missing 0 0
System-Missing 0 0
CARBON
Linear
Model Summary
R R Square Adjusted R
Square
Std. Error of the
Estimate
.953 .907 .884 .107
The independent variable is D1.3.
ANOVA
 Sum of Squares df Mean Square F Sig.
Regression .450 1 .450 39.215 .003
Residual .046 4 .011
Total .496 5
The independent variable is D1.3.
Coefficients
 Unstandardized Coefficients Standardized
Coefficients
t Sig.
B Std. Error Beta
D1.3 1.635 .261 .953 6.262 .003
(Constant) -7.103 2.267 -3.133 .035
Logarithmic
Model Summary
R R Square Adjusted R
Square
Std. Error of the
Estimate
.950 .903 .879 .110
 The independent variable is D1.3.
ANOVA
 Sum of Squares df Mean Square F Sig.
Regression .448 1 .448 37.200 .004
Residual .048 4 .012
Total .496 5
The independent variable is D1.3.
Coefficients
 Unstandardized Coefficients Standardized
Coefficients
t Sig.
B Std. Error Beta
ln(D1.3) 14.104 2.312 .950 6.099 .004
(Constant) -23.390 4.998 -4.680 .009
Compound
Model Summary
R R Square Adjusted R
Square
Std. Error of the
Estimate
.954 .910 .888 .015
The independent variable is D1.3.
ANOVA
 Sum of Squares df Mean Square F Sig.
Regression .009 1 .009 40.672 .003
Residual .001 4 .000
Total .010 5
The independent variable is D1.3.
Coefficients
 Unstandardized Coefficients Standardized
Coefficients
t Sig.
B Std. Error Beta
D1.3 1.259 .045 2.597 27.679 .000
(Constant) .958 .301 3.187 .033
The dependent variable is ln(CARBON).
Power
Model Summary
R R Square Adjusted R
Square
Std. Error of the
Estimate
.952 .906 .883 .015
The independent variable is D1.3.
 ANOVA
 Sum of Squares df Mean Square F Sig.
Regression .009 1 .009 38.585 .003
Residual .001 4 .000
Total .010 5
The independent variable is D1.3.
Coefficients
 Unstandardized Coefficients Standardized
Coefficients
t Sig.
B Std. Error Beta
ln(D1.3) 1.988 .320 .952 6.212 .003
(Constant) .096 .067 1.446 .222
The dependent variable is ln(CARBON).
File đính kèm:
 khoa_luan_nghien_cuu_kha_nang_hap_thu_carbon_cua_rung_trong.pdf

