Labor productivity gap between export and non-exporting firms in industrialization: The case of the Vietnamese manufacturing sector
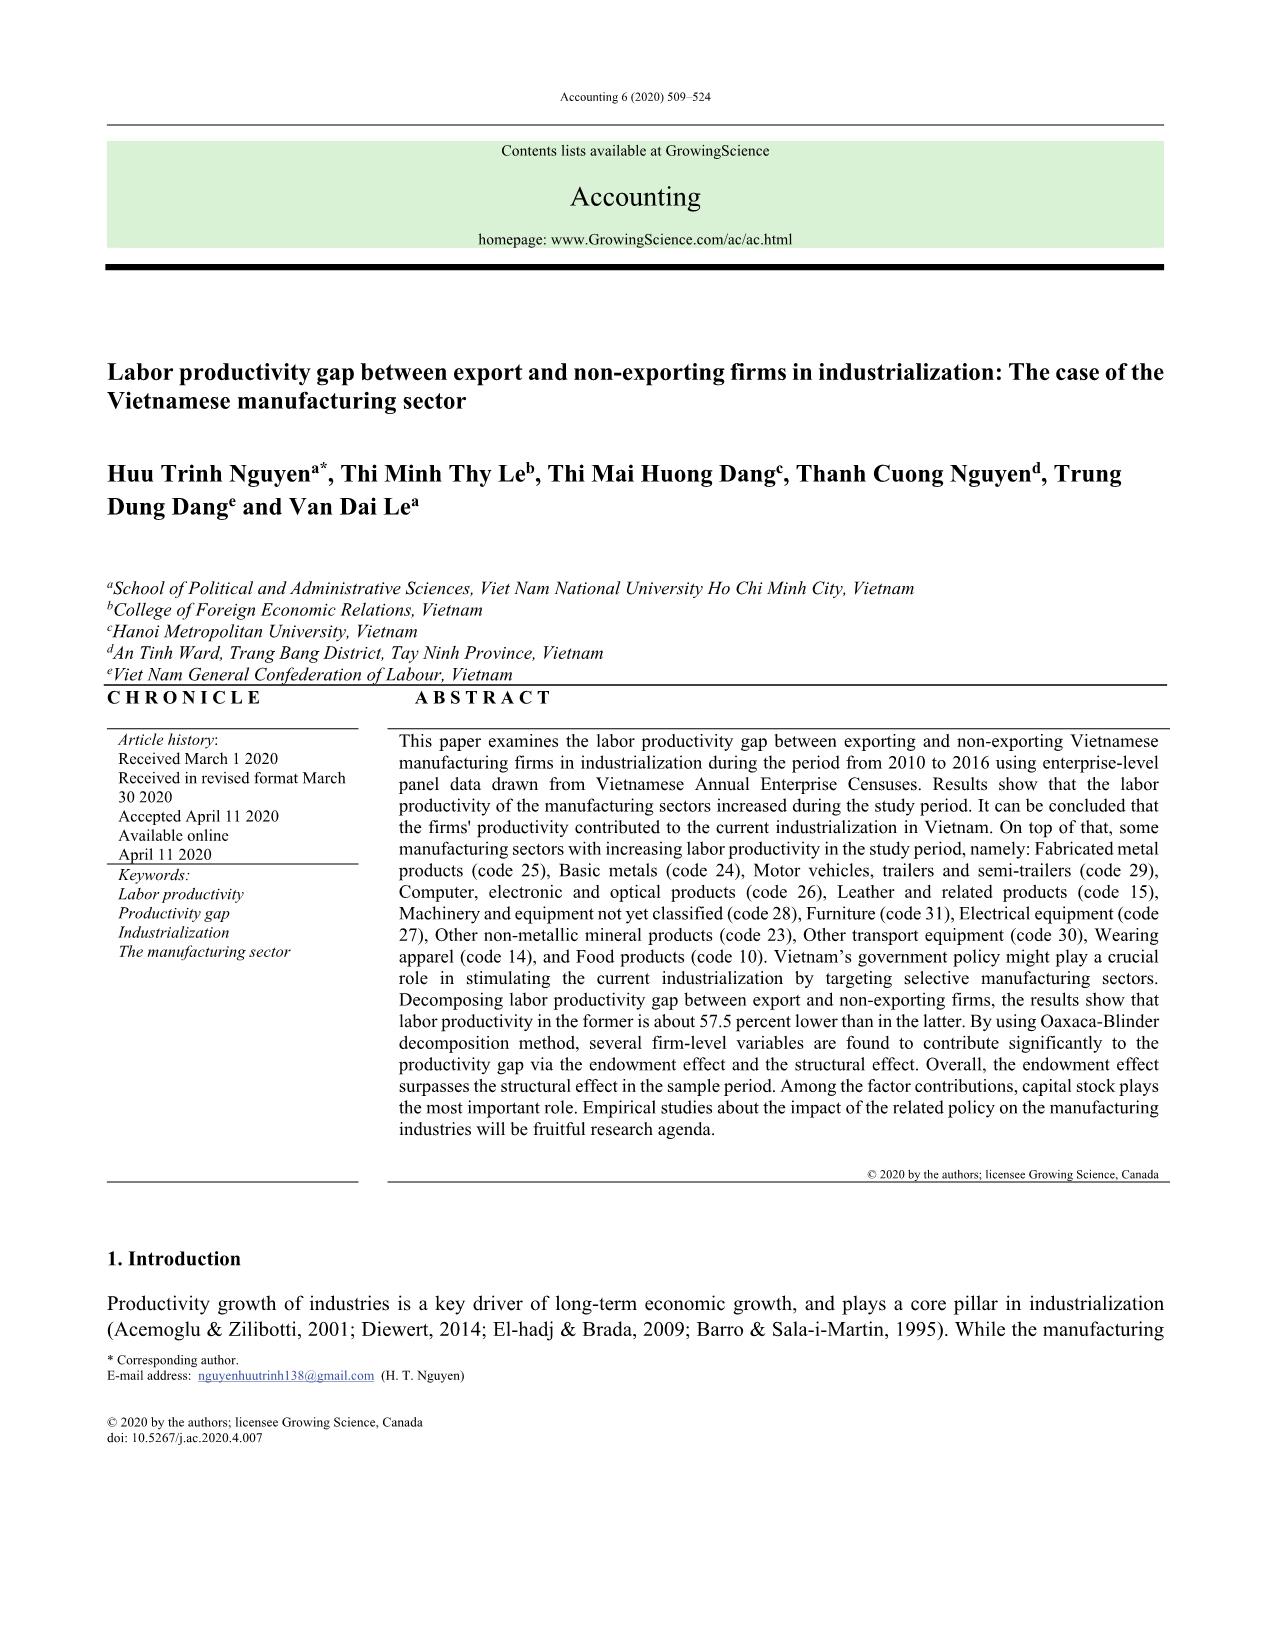
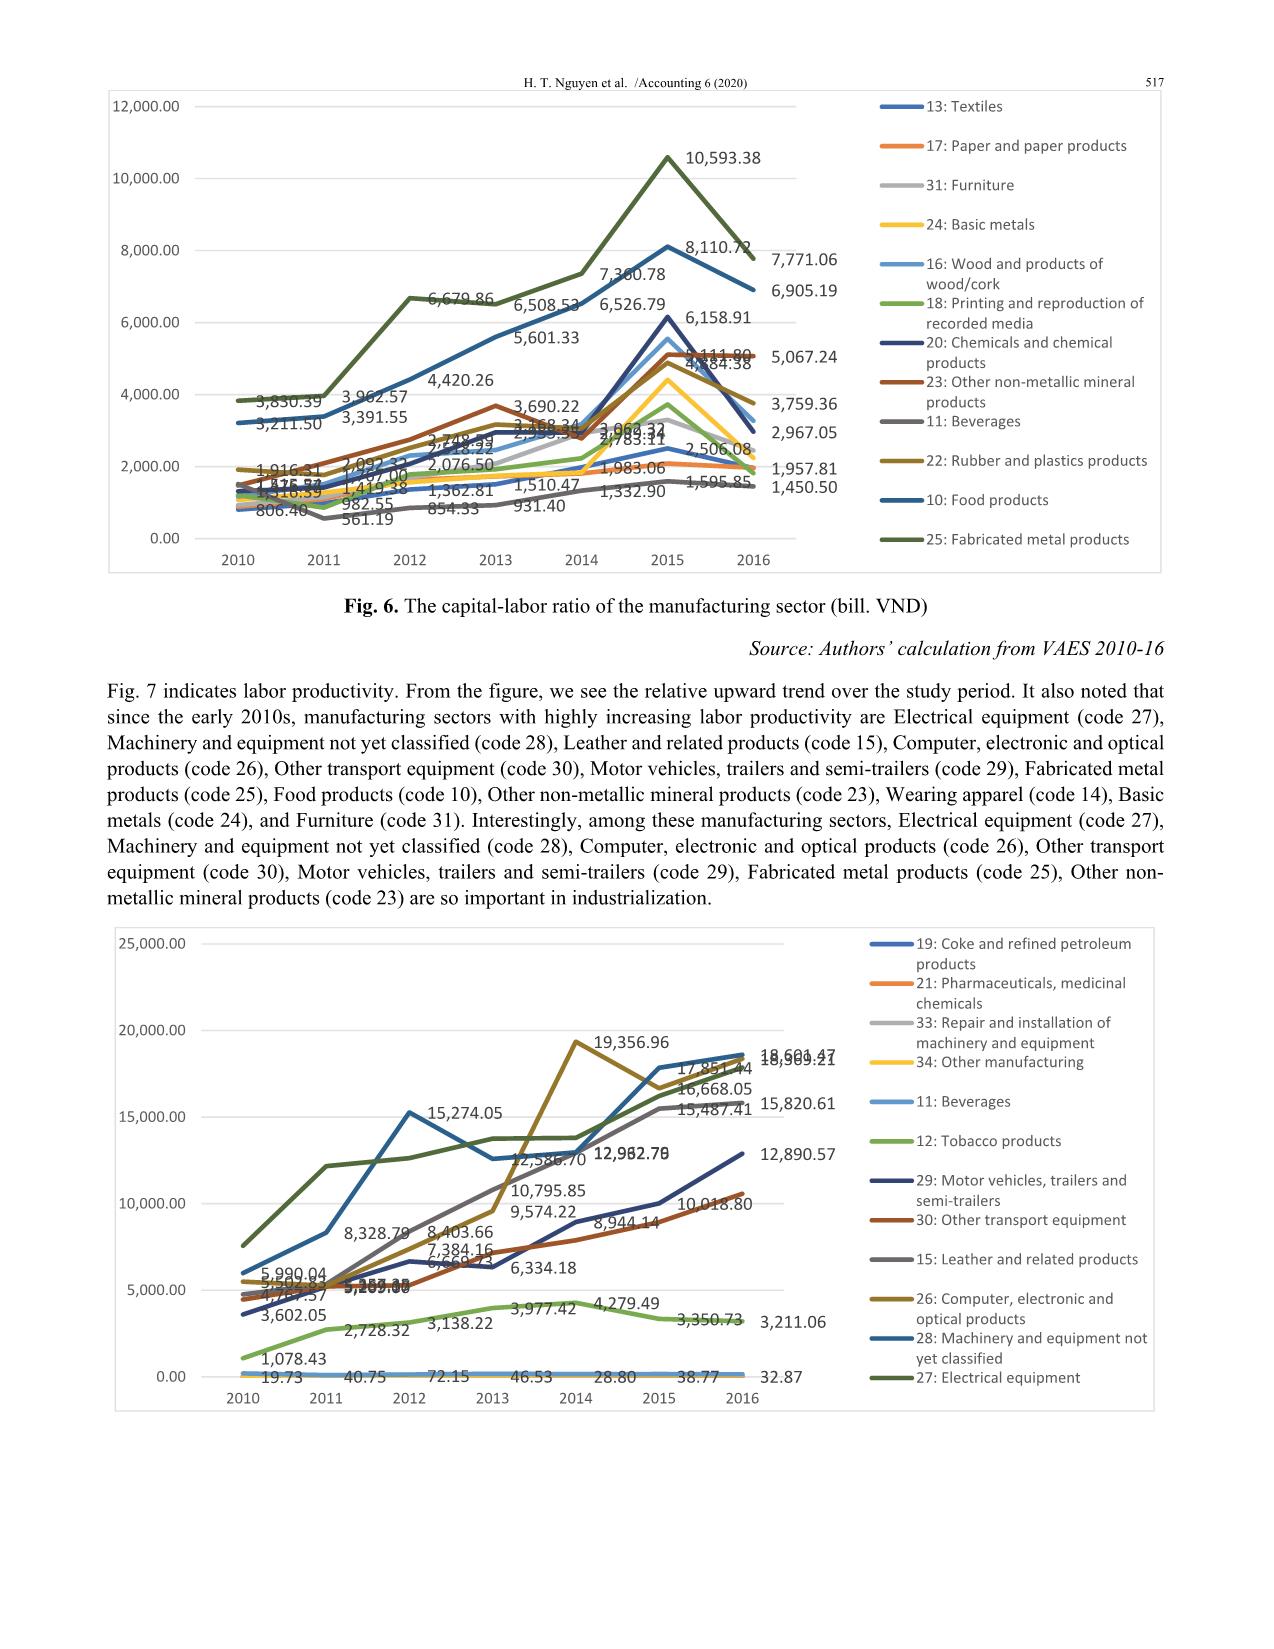
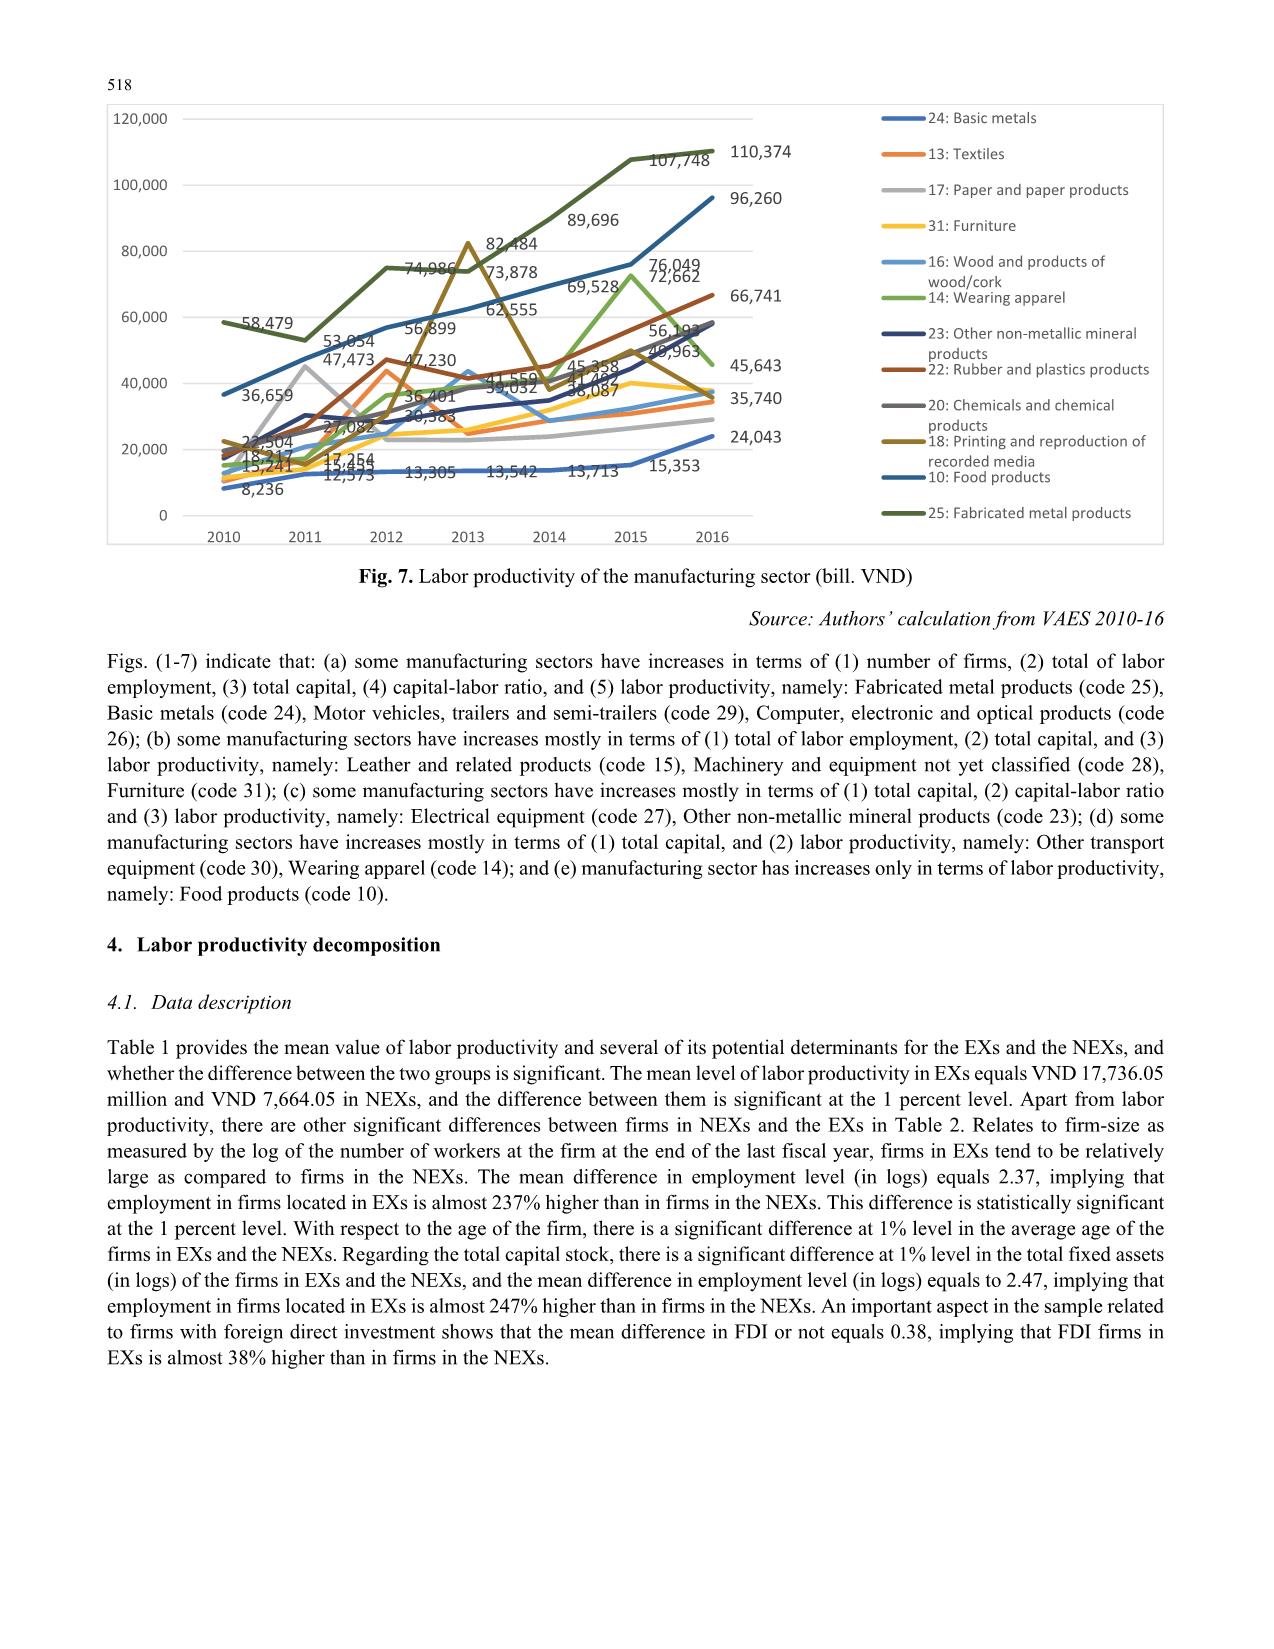
This paper examines the labor productivity gap between exporting and non-exporting Vietnamese
manufacturing firms in industrialization during the period from 2010 to 2016 using enterprise-level
panel data drawn from Vietnamese Annual Enterprise Censuses. Results show that the labor
productivity of the manufacturing sectors increased during the study period. It can be concluded that
the firms' productivity contributed to the current industrialization in Vietnam. On top of that, some
manufacturing sectors with increasing labor productivity in the study period, namely: Fabricated metal
products (code 25), Basic metals (code 24), Motor vehicles, trailers and semi-trailers (code 29),
Computer, electronic and optical products (code 26), Leather and related products (code 15),
Machinery and equipment not yet classified (code 28), Furniture (code 31), Electrical equipment (code
27), Other non-metallic mineral products (code 23), Other transport equipment (code 30), Wearing
apparel (code 14), and Food products (code 10). Vietnam’s government policy might play a crucial
role in stimulating the current industrialization by targeting selective manufacturing sectors.
Decomposing labor productivity gap between export and non-exporting firms, the results show that
labor productivity in the former is about 57.5 percent lower than in the latter. By using Oaxaca-Blinder
decomposition method, several firm-level variables are found to contribute significantly to the
productivity gap via the endowment effect and the structural effect. Overall, the endowment effect
surpasses the structural effect in the sample period. Among the factor contributions, capital stock plays
the most important role. Empirical studies about the impact of the related policy on the manufacturing
industries will be fruitful research agenda.
Trang 1
Trang 2
Trang 3
Trang 4
Trang 5
Trang 6
Trang 7
Trang 8
Trang 9
Trang 10
Tải về để xem bản đầy đủ
Tóm tắt nội dung tài liệu: Labor productivity gap between export and non-exporting firms in industrialization: The case of the Vietnamese manufacturing sector
Firm’s age (log) -14.29*** -34.84*** -3.543** -6.144*** -7.802*** -2.537
 (1.555) (2.355) (1.738) (1.588) (2.108) (1.803)
Total fixed assets (log) 0.406*** 0.361*** 0.367*** 0.345*** 0.266*** 0.258***
 (0.00515) (0.00542) (0.00556) (0.00488) (0.00554) (0.00565)
FDI (dummy) 0.228*** 0.255*** 0.192*** 0.281*** 0.515*** 0.494***
 (0.0336) (0.0417) (0.0431) (0.0456) (0.0399) (0.0537)
Manufacturing sector (dummies) Yes Yes Yes Yes Yes Yes
Constant 109.7*** 266.0*** 28.54** 48.39*** 61.29*** 21.47
 (11.83) (17.92) (13.22) (12.08) (16.03) (13.71)
Observations 38,735 32,571 45,550 44,522 35,100 29,111
Adjusted R squared 0.822 0.731 0.814 0.823 0.744 0.811
Note: For the sake of brevity, coefficients of manufacturing sectors (dummies) are not presented.
Robust standard errors in parentheses
*** p<0.01, ** p<0.05, * p<0.1
Source: Authors’ estimation from VAES 2010-15
4.3. Decomposition Results
Table 5 presents the decomposition results. The labor productivity among firms in the EXs is, on average 58.1 percent higher
than among firms in the NEXs (log difference of 0.581) and it is significant at 1 percent level. This labor productivity gap is
further decomposed into an endowment effect and a structural effect. Endowment effect refers to the attributes of certain factors
experienced by the firm, whereas the structural effect refers to the returns to these attributes or factors. For example, the size of
a firm. Firms in EXs are on average larger than the firms in the NEXs, and this contributes to the labor productivity gap via the
endowment effect. Furthermore, the returns of a unit increase in firm-size (or marginal working labor) may have differential
effects for firms in EXs vs. NEXs, and this would be captured as a structural effect. Our results show that the labor productivity
gap is almost come from the endowment. That is, the structural effect explains 34.4 percent of the productivity gap while the
endowment effect explains the remaining 65.6 percent of the productivity gap (0.380 divided by 0.581). Firm-level factors
contribute significantly to the productivity gap via the structural effect and the endowment effect. These factors are discussed
below (Table 6).
Endowment effect
Recall that firms in the NEXs are less productive than firms in the EXs. Thus, any factor that narrows the productivity gap
favors firms in NEXs over firms in EXs. The findings for the endowment effect are presented in column 1 of every year in 2010-
2015 in Table 8. The biggest contribution to the productivity gap via the endowment effect comes from the difference between
NEXs and EXs in the level of total fixed assets followed by firm’s age, and then being an FDI.
H. T. Nguyen et al. /Accounting 6 (2020) 521
Structural effect
The structural effect refers to the role of the returns to production factors or attributes of firms that
lead to the widening or narrowing of the productivity gap. In Table 6, the structural effect is displayed in columns 2 and 3 of
every year in 2010-2015. The biggest contribution comes from differences between the NEXs and the EXs in returns to total
fixed assets, firm size and being an FDI.
Table 5
Decomposition results: the endowment and structural effects
VARIABLES 2010 2011 2012 2013 2014 2015
Labor productivity (log) in the NEXs 7.888*** 7.908*** 8.216*** 8.263*** 8.253*** 8.472***
 (0.00794) (0.00948) (0.00775) (0.00802) (0.00931) (0.00970)
Labor productivity (log) in the EXs 8.469*** 8.868*** 9.000*** 9.041*** 9.234*** 9.315***
 (0.0195) (0.0159) (0.0164) (0.0147) (0.0153) (0.0151)
Labor productivity difference (NEXs
minus EXs labor productivity)
-0.581*** -0.960*** -0.784*** -0.777*** -0.981*** -0.843***
 (0.0210) (0.0185) (0.0181) (0.0168) (0.0179) (0.0180)
Endowments -0.380*** -0.632*** -0.544*** -0.596*** -0.596*** -0.511***
 (0.0285) (0.0220) (0.0254) (0.0205) (0.0218) (0.0212)
Coefficients -0.0997*** -0.0695*** -0.272*** -0.230*** -0.265*** -0.165***
 (0.0194) (0.0191) (0.0208) (0.0183) (0.0184) (0.0222)
Interaction -0.101*** -0.258*** 0.0319 0.0486** -0.121*** -0.167***
 (0.0271) (0.0229) (0.0273) (0.0217) (0.0224) (0.0251)
Observations 44,252 41,407 53,994 55,024 44,343 38,532
Note: Robust standard errors in parentheses
*** p<0.01, ** p<0.05, * p<0.1
Source: Authors’ estimation from VAES 2010-15
2. Conclusions and implication
The manufacturing sector in Vietnam is accounted for large shares of the labor force and capital accumulation during the process
of economic growth. It is also expected to contribute to structural transformation and industrialization. Nevertheless, the
literature related to Vietnam is still silent on evidence on the productivity of the manufacturing sector. This knowledge gap in
the manufacturing sector’s productivity presents a serious space in the realization of industrialization in Vietnam.
Results show that the labor productivity of the manufacturing sectors increased during the study period. It can be concluded that
the firms' productivity contributed to the current industrialization in Vietnam. On top of that, some manufacturing sectors with
increasing labor productivity in the study period, namely: Fabricated metal products (code 25), Basic metals (code 24), Motor
vehicles, trailers and semi-trailers (code 29), Computer, electronic and optical products (code 26), Leather and related products
(code 15), Machinery and equipment not yet classified (code 28), Furniture (code 31), Electrical equipment (code 27), Other
non-metallic mineral products (code 23), Other transport equipment (code 30), Wearing apparel (code 14), and Food products
(code 10), and some are not. Thus, it can be argued that Vietnam’s government policy plays a crucial role in stimulating the
current industrialization. By targeting selective manufacturing sectors, policies might strengthen relevant advanced
manufacturing sectors with currently high labor productivity, and give supports to potential manufacturing sectors those need
to go advance in the future.
By using Oaxaca-Blinder decomposition method, several firm-level variables are found to contribute significantly to the
productivity gap via the endowment effect and the structural effect. In overall, the endowment effect surpasses the structural
effect in our sample period. Among the factor contributions, capital stock plays the most important role. Empirical studies about
the impact of the related policy on the manufacturing industries will be fruitful research agenda.
52
2
 Ta
bl
e 6
D
ec
om
po
sit
io
n
re
su
lts
: F
irm
-le
ve
l f
ac
to
r c
on
tri
bu
tio
ns
VARIABLE
20
10
20
11
20
12
Endowments
Coefficients
Interaction
Endowments
Coefficients
Interaction
Endowments
Coefficients
Interaction
Em
pl
oy
m
en
t
(lo
g)
0.
88
8*
**
0.
29
9*
**
-0
.1
44
**
*
0.
72
3*
**
1.
02
1*
**
-0
.4
49
**
*
0.
83
4*
**
0.
22
3*
**
-0
.1
17
**
*
-0
.0
36
4
-0
.0
79
2
-0
.0
38
1
-0
.0
23
9
-0
.0
62
1
-0
.0
27
6
-0
.0
34
3
-0
.0
69
9
-0
.0
36
7
Fi
rm
’s
 a
ge
 (l
og
)
-0
.0
35
3*
**
52
.8
5*
0.
01
15
*
-0
.0
41
0*
**
-4
9.
03
*
-0
.0
09
32
*
-0
.0
36
8*
**
12
3.
0*
**
0.
03
02
**
*
-0
.0
05
52
-2
7.
59
-0
.0
06
02
-0
.0
04
15
-2
7.
68
-0
.0
05
26
-0
.0
04
9
-2
3.
75
-0
.0
05
86
To
ta
l f
ix
ed
 a
ss
et
s
(lo
g)
-1
.1
38
**
*
-0
.7
44
**
*
0.
16
6*
**
-1
.2
11
**
*
-1
.1
79
**
*
0.
28
4*
**
-1
.1
62
**
*
-0
.7
99
**
*
0.
19
3*
**
-0
.0
31
3
-0
.1
42
-0
.0
31
7
-0
.0
25
6
-0
.1
14
-0
.0
27
6
-0
.0
32
1
-0
.1
42
-0
.0
34
4
FD
I (
du
m
m
y)
-0
.0
14
5
0.
09
00
**
*
-0
.0
84
9*
**
-0
.0
39
3*
**
0.
05
30
**
*
-0
.0
50
5*
**
-0
.0
64
5*
**
0.
01
25
-0
.0
12
1
-0
.0
10
2
-0
.0
19
-0
.0
17
9
-0
.0
06
98
-0
.0
17
-0
.0
16
3
-0
.0
07
78
-0
.0
19
5
-0
.0
18
8
A
ll
se
ct
or
s
(d
um
m
ie
s)
-0
.0
80
6*
**
0.
19
7*
*
-0
.0
50
1*
**
-0
.0
63
8*
**
-0
.0
67
6
-0
.0
33
5*
**
-0
.1
14
**
*
-0
.0
36
2
-0
.0
61
7*
**
-0
.0
19
3
-0
.0
86
8
-0
.0
12
2
-0
.0
15
6
-0
.0
44
5
-0
.0
08
18
-0
.0
16
3
-0
.0
43
7
-0
.0
09
25
To
ta
l
-0
.3
80
**
*
-0
.0
99
7*
**
-0
.1
01
**
*
-0
.6
32
**
*
-0
.0
69
5*
**
-0
.2
58
**
*
-0
.5
44
**
*
-0
.2
72
**
*
0.
03
19
-0
.0
28
5
-0
.0
19
4
-0
.0
27
1
-0
.0
22
-0
.0
19
1
-0
.0
22
9
-0
.0
25
4
-0
.0
20
8
-0
.0
27
3
VARIABLE
20
13
20
14
20
15
Endowments
Coefficients
Interaction
Endowments
Coefficients
Interaction
Endowments
Coefficients
Interaction
Em
pl
oy
m
en
t
(lo
g)
0.
63
8*
**
0.
13
8*
*
-0
.0
70
3*
*
0.
68
3*
**
0.
75
9*
**
-0
.3
84
**
*
0.
55
9*
**
0.
67
1*
**
-0
.3
37
**
*
-0
.0
27
-0
.0
57
1
-0
.0
29
1
-0
.0
26
4
-0
.0
58
2
-0
.0
29
6
-0
.0
28
-0
.0
61
9
-0
.0
31
2
Fi
rm
’s
 a
ge
 (l
og
)
-0
.0
34
9*
**
10
3.
4*
**
0.
02
40
**
*
-0
.0
21
6*
**
45
.2
5*
*
0.
00
93
4*
*
-0
.0
15
3*
**
58
.3
9*
**
0.
01
15
**
*
-0
.0
04
18
-2
1.
46
-0
.0
05
01
-0
.0
03
41
-2
2.
88
-0
.0
04
73
-0
.0
03
42
-2
2.
03
-0
.0
04
35
To
ta
l f
ix
ed
 a
ss
et
s
(lo
g)
-1
.0
04
**
*
-0
.7
19
**
*
0.
16
3*
**
-1
.0
33
**
*
-1
.7
12
**
*
0.
38
3*
**
-0
.8
75
**
*
-1
.4
01
**
*
0.
28
9*
**
-0
.0
28
8
-0
.1
34
-0
.0
30
3
-0
.0
26
4
-0
.1
28
-0
.0
28
8
-0
.0
27
6
-0
.1
44
-0
.0
29
7
FD
I (
du
m
m
y)
-0
.0
67
9*
**
0.
02
90
*
-0
.0
27
9*
-0
.1
01
**
*
0.
09
38
**
*
-0
.0
90
2*
**
-0
.1
09
**
*
0.
07
13
**
*
-0
.0
68
8*
**
-0
.0
06
63
-0
.0
17
5
-0
.0
16
9
-0
.0
06
64
-0
.0
16
9
-0
.0
16
3
-0
.0
06
36
-0
.0
21
-0
.0
20
3
A
ll
se
ct
or
s
(d
um
m
ie
s)
-0
.1
26
**
*
-0
.0
25
8
-0
.0
40
4*
**
-0
.1
24
**
*
-0
.0
55
9
-0
.0
38
2*
**
-0
.0
71
5*
**
-0
.1
02
**
*
-0
.0
60
9*
**
-0
.0
14
9
-0
.0
35
8
-0
.0
07
67
-0
.0
15
9
-0
.0
41
4
-0
.0
08
23
-0
.0
16
-0
.0
35
4
-0
.0
07
9
To
ta
l
-0
.5
96
**
*
-0
.2
30
**
*
0.
04
86
**
-0
.5
96
**
*
-0
.2
65
**
*
-0
.1
21
**
*
-0
.5
11
**
*
-0
.1
65
**
*
-0
.1
67
**
*
-0
.0
20
5
-0
.0
18
3
-0
.0
21
7
-0
.0
21
8
-0
.0
18
4
-0
.0
22
4
-0
.0
21
2
-0
.0
22
2
-0
.0
25
1
 N
ot
e:
 R
ob
us
t s
ta
nd
ar
d
er
ro
rs
 in
 p
ar
en
th
es
es
**
*
p<
0.
01
, *
*
p<
0.
05
, *
 p
<0
.1
So
ur
ce
: A
ut
ho
rs
’ e
st
im
at
io
n
fr
om
 V
AE
S
20
10
-1
5
H. T. Nguyen et al. /Accounting 6 (2020) 523
Acknowledgment
The authors would like to thank the anonymous referees for constrictive comments on earlier version of this paper.
References
Acemoglu, D., & Zilibotti, F. (2001). Productivity differences. The Quarterly Journal of Economics, 116(2), 563-606.
Acs, Z. J., & Audretsch, D. B. (1988). Innovation in large and small firms: an empirical analysis. The American Economic
Review, 78(4), 678-690.
Bahk, B.-H., & Gort, M. (1993). Decomposing learning by doing in new plants. Journal of Political Economy, 101(4), 561-583.
Barro, R. J., & Sala-i-Martin, X. (1995). Economic Growth. McGraw-Hill. New York.
Bernard, A. B., & Jensen, J. B. (1999). Exporting and productivity. Retrieved from
Blinder, A. S. (1973). Wage discrimination: reduced form and structural estimates. Journal of Human Resources, 8(4), 436-455.
Cohen, W. M., & Klepper, S. (1996). A reprise of size and R & D. The Economic Journal, 106(437), 925-951.
Diaz, M. A., & Sánchez, R. (2008). Firm size and productivity in Spain: a stochastic frontier analysis. Small Business Economics,
30(3), 315-323.
Diewert, W. E. (2014). US TFP growth and the contribution of changes in export and import prices to real income growth.
Journal of Productivity Analysis, 41(1), 19-39. doi:10.1007/s11123-013-0369-4
El-hadj, M. B., & Brada, J. C. (2009). Total factor productivity growth, structural change and convergence in the new members
of the European Union. Comparative economic studies, 51(4), 421-446.
Griffith, R., & Simpson, H. (2004). Characteristics of foreign-owned firms in British manufacturing. In Seeking a Premier
Economy: The Economic Effects of British Economic Reforms, 1980-2000 (pp. 147-180): University of Chicago Press.
Jann, B. (2008). The Blinder–Oaxaca decomposition for linear regression models. The Stata Journal, 8(4), 453-479.
Jensen, J. B., McGuckin, R. H., & Stiroh, K. J. (2001). The impact of vintage and survival on productivity: Evidence from
cohorts of US manufacturing plants. Review of Economics and Statistics, 83(2), 323-332.
Jovanovic, B. (1982). Selection and the Evolution of Industry. Econometrica: Journal of the Econometric Society, 649-670.
Melitz, M. J. (2003). The impact of trade on intra‐industry reallocations and aggregate industry productivity. Econometrica,
71(6), 1695-1725.
Ngo, Q.-T., & Nguyen, C. T. (2019). Do export transitions differently affect firm productivity? Evidence across Vietnamese
manufacturing sectors. Post-Communist Economies, 1-27.
Ngo, Q., & Tran, Q. (2020). Firm heterogeneity and total factor productivity: New panel-data evidence from Vietnamese
manufacturing firms. Management Science Letters, 10(7), 1505-1512.
Oaxaca, R. (1973). Male-female wage differentials in urban labor markets. International EconomicReview, 14(3), 693-709.
Pagano, P., & Schivardi, F. (2003). Firm size distribution and growth. Scandinavian Journal of Economics, 105(2), 255-274.
Söderbom, M., & Teal, F. (2004). Size and efficiency in African manufacturing firms: evidence from firm-level panel data.
Journal of Development Economics, 73(1), 369-394.
Van Biesebroeck, J. (2005). Firm size matters: Growth and productivity growth in African manufacturing. Economic
Development and Cultural Change, 53(3), 545-583.
Wagner, J. (2007). Exports and productivity: A survey of the evidence from firm‐level data. World Economy, 30(1), 60-82.
 524
© 2020 by the authors; licensee Growing Science, Canada. This is an open access article distributed
under the terms and conditions of the Creative Commons Attribution (CC-BY) license
(
File đính kèm:
 labor_productivity_gap_between_export_and_non_exporting_firm.pdf

