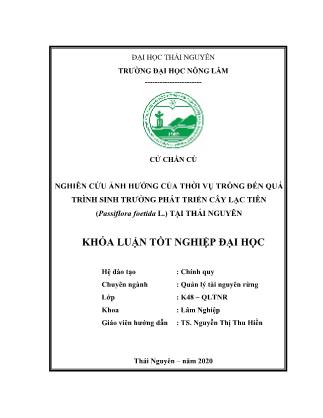
Khóa luận Nghiên cứu ảnh hưởng của thời vụ trồng đến quá trình sinh trưởng phát triển cây Lạc tiên (Passiflora foetida L.) tại Thái Nguyên
1.1. Tính cấp thiết của đề tài
Theo nghiên cứu của các nhà khoa học đã công bố, tỉ lệ người mất ngủ có
thể từ 4% cho tới 48% tùy theo đối tượng và lứa tuổi. Khoảng 33% dân số bị một
trong nhiều triệu chứng của mất ngủ, 18% không thoả mãn với giấc ngủ. 30%
bệnh mất ngủ có liên hệ bệnh tâm thần. Theo số liệu thống kê, có tới khoảng
20% dân số gặp phải tình trạng mất ngủ về đêm. Trước đây tình trạng khó ngủ
về đêm, mất ngủ thường chỉ xảy ra ở những người cao tuổi thì hiện nay càng
có nhiều người trẻ phải vật lộn chứng khó ngủ, mất ngủ. Tình trạng khó ngủ, mất
ngủ về đêm kéo dài sẽ khiến cơ thể mệt mỏi, làm ảnh hưởng tới cuộc sống và
hiệu quả công việc. Việc sử dụng thuốc ngủ và thuốc an thần trong thời gian dài
ảnh hưởng xấu đến sức khỏe và có thể gây nghiện. Hiện nay, sử dụng thảo dược
trong điều trị mất ngủ và rối loạn an thần đang được chú trọng, khắc phục được
các hạn chế của thuốc ngủ và thuốc an thần.
Cây Lạc tiên (Passiflora foetida L.) là một loại dược liệu được dùng
trong sản xuất đông dược và tân dược. Cây còn có nhiều tên gọi: cây Lạc, cây
Lồng đèn, Hồng tiên, Mắc mát, Long châu quả. Cây Lạc tiên có trong Dược
điển Pháp và được nhiều nước ở châu Âu, Mỹ sử dụng. Các nghiên cứu cho
thấy nó có tác dụng lên hệ thần kinh trung ương: trấn tĩnh, an thần, chống hồi
hộp, lo âu, mất ngủ. Nó còn có tác dụng trực tiếp lên cơ trơn, làm giãn và chống
co thắt nên chữa được các chứng đau do co thắt đường tiêu hóa, tử cung.
Dân gian thường dùng dây và lá cây Lạc tiên sắc uống làm thuốc an thần
chữa mất ngủ. Theo Đỗ Tất Lợi, dây, lá, hoa cây Lạc tiên thái nhỏ, phơi khô có
công dụng an thần, giải nhiệt, mát gan; chữa trị chữa đau đầu, mất ngủ, thường
phối hợp thêm với một số vị thuốc khác. Quả cây Lạc tiên vị ngọt, tính bình,
có tác dụng thanh nhiệt, giải độc, lợi thủy, dùng chữa ho do phế nhiệt, phù
thũng, giã đắp chữa ung nhọt lở loét ở chân.2
Thái Nguyên là một tỉnh thuộc khu vực miền núi phía Bắc có điều kiện
tự nhiên, khí hậu thích hợp với phát triển trồng cây dược liệu. Trong quy hoạch
phát triển nông nghiệp của tỉnh Thái Nguyên đến năm 2020 đã xác định rõ trồng
cây dược liệu là một hướng phát triển bên cạnh phát triển các cây trồng truyền
thống với mục tiêu hình thành một số vùng chuyên canh trông cây dược liệu.
Cây Lạc tiên là một loại thảo dược quý, dễ trồng, thích hợp với nhiều điều kiện
tự nhiên khí hậu nhiệt đới khác nhau. Do đó, trồng cây Lạc tiên và chế biến cây
Lạc tiên thành các sản phẩm điều trị và hỗ trợ điều trị an thần, mất ngủ tại Thái
Nguyên là một hướng thích hợp, đem lại hiệu quả kinh tế và y dược cao.
Xuất phát từ lý do trên chúng tôi thực hiện đề tài “Nghiên cứu ảnh
hưởng của thời vụ trồng đến quá trình sinh trưởng phát triển cây Lạc tiên
(Passiflora foetida L.) tại Thái Nguyên”.
Trang 1
Trang 2
Trang 3
Trang 4
Trang 5
Trang 6
Trang 7
Trang 8
Trang 9
Trang 10
Tải về để xem bản đầy đủ
Tóm tắt nội dung tài liệu: Khóa luận Nghiên cứu ảnh hưởng của thời vụ trồng đến quá trình sinh trưởng phát triển cây Lạc tiên (Passiflora foetida L.) tại Thái Nguyên
H_ct3_3).
Sau: 28 ngày
Linear
Model Summary
R R Square Adjusted R
Square
Std. Error of the Estimate
,367 ,134 ,126 29,985
The independent variable is D_ct3_4.
ANOVA
 Sum of
Squares
df Mean Square F Sig.
Regression 15220,509 1 15220,509 16,928 ,000
Residual 98003,185 109 899,112
21
Total 113223,694 110
The independent variable is D_ct3_4.
Coefficients
 Unstandardized Coefficients Standardized Coefficients t Sig.
B Std. Error Beta
D_ct3_4 143,814 34,954 ,367 4,114 ,000
(Constant) 151,762 14,642 10,365 ,000
Logarithmic
Model Summary
R R Square Adjusted R Square Std. Error of the
Estimate
,449 ,201 ,194 28,802
The independent variable is D_ct3_4.
ANOVA
 Sum of
Squares
df Mean Square F Sig.
Regression 22801,270 1 22801,270 27,486 ,000
Residual 90422,423 109 829,564
Total 113223,694 110
The independent variable is D_ct3_4.
Coefficients
 Unstandardized Coefficients Standardized Coefficients t Sig.
B Std. Error Beta
ln(D_ct3_4) 67,057 12,791 ,449 5,243 ,000
(Constant) 271,932 11,966 22,725 ,000
Compound
Model Summary
R R Square Adjusted R
Square
Std. Error of the
Estimate
,367 ,135 ,127 ,156
The independent variable is D_ct3_4.
ANOVA
 Sum of
Squares
df Mean Square F Sig.
Regression ,410 1 ,410 16,967 ,000
Residual 2,636 109 ,024
Total 3,046 110
The independent variable is D_ct3_4.
Coefficients
 Unstandardized Coefficients Standardized Coefficients t Sig.
B Std. Error Beta
D_ct3_4 2,110 ,382 1,443 5,516 ,000
(Constant) 153,163 11,630 13,169 ,000
The dependent variable is ln(H_ct3_4).
Power
Model Summary
R R Square Adjusted R
Square
Std. Error of the
Estimate
,458 ,210 ,203 ,149
The independent variable is D_ct3_4.
22
ANOVA
 Sum of
Squares
df Mean Square F Sig.
Regression ,640 1 ,640 28,992 ,000
Residual 2,406 109 ,022
Total 3,046 110
The independent variable is D_ct3_4.
Coefficients
 Unstandardized Coefficients Standardized Coefficients t Sig.
B Std. Error Beta
ln(D_ct3_4) ,355 ,066 ,458 5,384 ,000
(Constant) 287,693 17,759 16,200 ,000
The dependent variable is ln(H_ct3_4).
Sau: 35 ngày
Linear
Model Summary
R R Square Adjusted R
Square
Std. Error of the
Estimate
,287 ,082 ,074 34,673
The independent variable is D_ct3_5.
ANOVA
 Sum of
Squares
df Mean Square F Sig.
Regression 11743,639 1 11743,639 9,768 ,002
Residual 131039,604 109 1202,198
Total 142783,243 110
The independent variable is D_ct3_5.
Coefficients
 Unstandardized Coefficients Standardized Coefficients t Sig.
B Std. Error Beta
D_ct3_5 89,438 28,616 ,287 3,125 ,002
(Constant) 218,653 16,264 13,444 ,000
Logarithmic
Model Summary
R R Square Adjusted R
Square
Std. Error of the
Estimate
,414 ,172 ,164 32,940
The independent variable is D_ct3_5.
ANOVA
 Sum of
Squares
df Mean Square F Sig.
Regression 24510,922 1 24510,922 22,589 ,000
Residual 118272,321 109 1085,067
Total 142783,243 110
The independent variable is D_ct3_5.
Coefficients
 Unstandardized Coefficients Standardized Coefficients t Sig.
B Std. Error Beta
ln(D_ct3_5) 68,385 14,388 ,414 4,753 ,000
(Constant) 310,031 9,294 33,358 ,000
23
Compound
Model Summary
R R Square Adjusted R
Square
Std. Error of the
Estimate
,277 ,077 ,068 ,135
The independent variable is D_ct3_5.
ANOVA
 Sum of
Squares
df Mean Square F Sig.
Regression ,166 1 ,166 9,074 ,003
Residual 1,997 109 ,018
Total 2,163 110
The independent variable is D_ct3_5.
Coefficients
 Unstandardized Coefficients Standardized Coefficients t Sig.
B Std. Error Beta
D_ct3_5 1,400 ,156 1,319 8,952 ,000
(Constant) 220,498 13,999 15,751 ,000
The dependent variable is ln(H_ct3_5).
Power
Model Summary
R R Square Adjusted R
Square
Std. Error of the
Estimate
,419 ,175 ,168 ,128
The independent variable is D_ct3_5.
ANOVA
 Sum of
Squares
df Mean Square F Sig.
Regression ,379 1 ,379 23,158 ,000
Residual 1,784 109 ,016
Total 2,163 110
The independent variable is D_ct3_5.
Coefficients
 Unstandardized Coefficients Standardized
Coefficients
t Sig.
B Std. Error Beta
ln(D_ct3_5) ,269 ,056 ,419 4,812 ,000
(Constant) 313,174 11,304 27,703 ,000
The dependent variable is ln(H_ct3_5).
2.4. Cômg thức 4
Sau 7 ngày
Linear
Model Summary
R R Square Adjusted R Square Std. Error of the
Estimate
.683 .467 .462 7.805
The independent variable is D00.
ANOVA
 Sum of Squares df Mean Square F Sig.
Regression 5974.569 1 5974.569 98.066 .000
Residual 6823.501 112 60.924
24
Total 12798.070 113
The independent variable is D00.
Coefficients
 Unstandardized
Coefficients
Standardized Coefficients t Sig.
B Std. Error Beta
D00 219.519 22.167 .683 9.903 .000
(Constant) 19.390 2.937 6.601 .000
Logarithmic
Model Summary
R R Square Adjusted R Square Std. Error of the Estimate
.678 .459 .455 7.860
The independent variable is D00.
ANOVA
 Sum of Squares df Mean Square F Sig.
Regression 5879.278 1 5879.278 95.173 .000
Residual 6918.792 112 61.775
Total 12798.070 113
The independent variable is D00.
Coefficients
 Unstandardized Coefficients Standardized Coefficients t Sig.
B Std. Error Beta
ln(D00) 28.250 2.896 .678 9.756 .000
(Constant) 106.478 6.084 17.501 .000
Compound
Model Summary
R R Square Adjusted R Square Std. Error of the Estimate
.669 .447 .443 .171
The independent variable is D00.
ANOVA
 Sum of Squares df Mean Square F Sig.
Regression 2.638 1 2.638 90.703 .000
Residual 3.258 112 .029
Total 5.896 113
The independent variable is D00.
Coefficients
 Unstandardized Coefficients Standardized Coefficients t Sig.
B Std. Error Beta
D00 100.791 48.820 1.952 2.065 .041
(Constant) 25.655 1.647 15.581 .000
The dependent variable is ln(Hvn).
Power
Model Summary
R R Square Adjusted R Square Std. Error of the Estimate
.673 .453 .448 .170
The independent variable is D00.
ANOVA
 Sum of Squares df Mean Square F Sig.
Regression 2.671 1 2.671 92.783 .000
Residual 3.225 112 .029
Total 5.896 113
25
The independent variable is D00.
Coefficients
 Unstandardized Coefficients Standardized Coefficients t Sig.
B Std. Error Beta
ln(D00) .602 .063 .673 9.632 .000
(Constant) 162.819 21.386 7.613 .000
The dependent variable is ln(Hvn).
Sau: 14 ngày
Linear
Model Summary
R R Square Adjusted R Square Std. Error of the
Estimate
,389 ,151 ,144 16,305
The independent variable is D_ct4_2.
ANOVA
 Sum of
Squares
df Mean Square F Sig.
Regression 5310,484 1 5310,484 19,975 ,000
Residual 29775,455 112 265,852
Total 35085,939 113
The independent variable is D_ct4_2.
Coefficients
 Unstandardized Coefficients Standardized Coefficients t Sig.
B Std. Error Beta
D_ct4_2 193,725 43,345 ,389 4,469 ,000
(Constant) 27,097 6,842 3,961 ,000
Logarithmic
Model Summary
R R Square Adjusted R
Square
Std. Error of the Estimate
,398 ,158 ,151 16,238
The independent variable is D_ct4_2.
ANOVA
 Sum of
Squares
df Mean Square F Sig.
Regression 5555,585 1 5555,585 21,071 ,000
Residual 29530,354 112 263,664
Total 35085,939 113
The independent variable is D_ct4_2.
Coefficients
 Unstandardized Coefficients Standardized Coefficients t Sig.
B Std. Error Beta
ln(D_ct4_2) 29,530 6,433 ,398 4,590 ,000
(Constant) 112,982 12,311 9,177 ,000
Compound
Model Summary
R R Square Adjusted R Square Std. Error of the Estimate
,382 ,146 ,139 ,294
The independent variable is D_ct4_2.
26
ANOVA
 Sum of
Squares
df Mean Square F Sig.
Regression 1,659 1 1,659 19,182 ,000
Residual 9,688 112 ,086
Total 11,347 113
The independent variable is D_ct4_2.
Coefficients
 Unstandardized Coefficients Standardized Coefficients t Sig.
B Std. Error Beta
D_ct4_2 30,703 24,005 1,466 1,279 ,204
(Constant) 32,009 3,950 8,103 ,000
The dependent variable is ln(H_ct4_2).
Power
Model Summary
R R Square Adjusted R Square Std. Error of the Estimate
,393 ,154 ,147 ,293
The independent variable is D_ct4_2.
ANOVA
 Sum of
Squares
df Mean Square F Sig.
Regression 1,752 1 1,752 20,447 ,000
Residual 9,595 112 ,086
Total 11,347 113
The independent variable is D_ct4_2.
Coefficients
 Unstandardized Coefficients Standardized Coefficients t Sig.
B Std. Error Beta
ln(D_ct4_2) ,524 ,116 ,393 4,522 ,000
(Constant) 146,742 32,565 4,506 ,000
The dependent variable is ln(H_ct4_2).
Sau: 21 ngày
Linear
Model Summary
R R Square Adjusted R Square Std. Error of the Estimate
,572 ,328 ,320 26,776
The independent variable is D_ct4_3.
ANOVA
 Sum of
Squares
df Mean Square F Sig.
Regression 30041,180 1 30041,180 41,900 ,000
Residual 61659,809 86 716,975
Total 91700,989 87
The independent variable is D_ct4_3.
Coefficients
 Unstandardized Coefficients Standardized Coefficients t Sig.
B Std. Error Beta
D_ct4_3 495,865 76,605 ,572 6,473 ,000
(Constant) -,957 14,337 -,067 ,947
27
Logarithmic
Model Summary
R R Square Adjusted R Square Std. Error of the Estimate
,573 ,329 ,321 26,752
The independent variable is D_ct4_3.
ANOVA
 Sum of
Squares
df Mean Square F Sig.
Regression 30151,225 1 30151,225 42,129 ,000
Residual 61549,764 86 715,695
Total 91700,989 87
The independent variable is D_ct4_3.
Coefficients
 Unstandardized Coefficients Standardized Coefficients t Sig.
B Std. Error Beta
ln(D_ct4_3) 86,116 13,268 ,573 6,491 ,000
(Constant) 237,952 22,974 10,357 ,000
Compound
Model Summary
R R Square Adjusted R
Square
Std. Error of the Estimate
,585 ,342 ,334 ,315
The independent variable is D_ct4_3.
ANOVA
 Sum of
Squares
df Mean Square F Sig.
Regression 4,424 1 4,424 44,691 ,000
Residual 8,513 86 ,099
Total 12,937 87
The independent variable is D_ct4_3.
Coefficients
 Unstandardized Coefficients Standardized Coefficients t Sig.
B Std. Error Beta
D_ct4_3 410,515 369,512 1,795 1,111 ,270
(Constant) 27,846 4,691 5,936 ,000
The dependent variable is ln(H_ct4_3).
Power
Model Summary
R R Square Adjusted R
Square
Std. Error of the Estimate
,590 ,348 ,340 ,313
The independent variable is D_ct4_3.
ANOVA
 Sum of
Squares
df Mean Square F Sig.
Regression 4,498 1 4,498 45,844 ,000
Residual 8,439 86 ,098
Total 12,937 87
The independent variable is D_ct4_3.
28
Coefficients
 Unstandardized Coefficients Standardized Coefficients t Sig.
B Std. Error Beta
ln(D_ct4_3) 1,052 ,155 ,590 6,771 ,000
(Constant) 511,642 137,634 3,717 ,000
The dependent variable is ln(H_ct4_3).
Sau: 28 ngày
Linear
Model Summary
R R Square Adjusted R
Square
Std. Error of the Estimate
,594 ,353 ,345 37,083
The independent variable is D_ct4_4.
ANOVA
 Sum of
Squares
df Mean Square F Sig.
Regression 63002,252 1 63002,252 45,815 ,000
Residual 115512,132 84 1375,144
Total 178514,384 85
The independent variable is D_ct4_4.
Coefficients
 Unstandardized Coefficients Standardized Coefficients t Sig.
B Std. Error Beta
D_ct4_4 622,307 91,939 ,594 6,769 ,000
(Constant) 10,582 20,377 ,519 ,605
Logarithmic
Model Summary
R R Square Adjusted R Square Std. Error of the Estimate
,603 ,364 ,356 36,777
The independent variable is D_ct4_4.
ANOVA
 Sum of
Squares
df Mean Square F Sig.
Regression 64901,493 1 64901,493 47,985 ,000
Residual 113612,891 84 1352,534
Total 178514,384 85
The independent variable is D_ct4_4.
Coefficients
 Unstandardized Coefficients Standardized Coefficients t Sig.
B Std. Error Beta
ln(D_ct4_4) 133,441 19,264 ,603 6,927 ,000
(Constant) 352,270 30,065 11,717 ,000
Compound
Model Summary
R R Square Adjusted R
Square
Std. Error of the Estimate
,578 ,334 ,326 ,299
The independent variable is D_ct4_4.
ANOVA
 Sum of
Squares
df Mean Square F Sig.
29
Regression 3,774 1 3,774 42,112 ,000
Residual 7,528 84 ,090
Total 11,303 85
The independent variable is D_ct4_4.
Coefficients
 Unstandardized Coefficients Standardized Coefficients t Sig.
B Std. Error Beta
D_ct4_4 123,544 91,698 1,782 1,347 ,182
(Constant) 48,285 7,943 6,079 ,000
The dependent variable is ln(H_ct4_4).
Power
Model Summary
R R Square Adjusted R
Square
Std. Error of the Estimate
,587 ,344 ,337 ,297
The independent variable is D_ct4_4.
ANOVA
 Sum of
Squares
df Mean Square F Sig.
Regression 3,892 1 3,892 44,125 ,000
Residual 7,410 84 ,088
Total 11,303 85
The independent variable is D_ct4_4.
Coefficients
 Unstandardized Coefficients Standardized Coefficients t Sig.
B Std. Error Beta
ln(D_ct4_4) 1,033 ,156 ,587 6,643 ,000
(Constant) 680,395 165,204 4,119 ,000
The dependent variable is ln(H_ct4_4).
Sau: 35 ngày
Linear
Model Summary
R R Square Adjusted R Square Std. Error of the Estimate
,663 ,440 ,433 35,808
The independent variable is D_ct4_5.
ANOVA
 Sum of
Squares
df Mean Square F Sig.
Regression 81632,971 1 81632,971 63,665 ,000
Residual 103859,825 81 1282,220
Total 185492,795 82
The independent variable is D_ct4_5.
Coefficients
 Unstandardized Coefficients Standardized Coefficients t Sig.
B Std. Error Beta
D_ct4_5 601,397 75,372 ,663 7,979 ,000
(Constant) 48,496 19,773 2,453 ,016
Logarithmic
Model Summary
R R Square Adjusted R Square Std. Error of the Estimate
,672 ,452 ,445 35,433
30
The independent variable is D_ct4_5.
ANOVA
 Sum of
Squares
df Mean Square F Sig.
Regression 83796,115 1 83796,115 66,742 ,000
Residual 101696,681 81 1255,515
Total 185492,795 82
The independent variable is D_ct4_5.
Coefficients
 Unstandardized Coefficients Standardized Coefficients t Sig.
B Std. Error Beta
ln(D_ct4_5) 152,510 18,668 ,672 8,170 ,000
(Constant) 413,512 26,045 15,877 ,000
Compound
Model Summary
R R Square Adjusted R Square Std. Error of the Estimate
,659 ,434 ,427 ,192
The independent variable is D_ct4_5.
ANOVA
 Sum of
Squares
df Mean Square F Sig.
Regression 2,294 1 2,294 62,125 ,000
Residual 2,991 81 ,037
Total 5,285 82
The independent variable is D_ct4_5.
Coefficients
 Unstandardized Coefficients Standardized Coefficients t Sig.
B Std. Error Beta
D_ct4_5 24,239 9,804 1,933 2,472 ,016
(Constant) 86,848 9,215 9,424 ,000
The dependent variable is ln(H_ct4_5).
Power
Model Summary
R R Square Adjusted R Square Std. Error of the Estimate
,670 ,449 ,442 ,190
The independent variable is D_ct4_5.
ANOVA
 Sum of
Squares
df Mean Square F Sig.
Regression 2,371 1 2,371 65,920 ,000
Residual 2,914 81 ,036
Total 5,285 82
The independent variable is D_ct4_5.
Coefficients
 Unstandardized Coefficients Standardized Coefficients t Sig.
B Std. Error Beta
ln(D_ct4_5) ,811 ,100 ,670 8,119 ,000
(Constant) 603,642 84,152 7,173 ,000
The dependent variable is ln(H_ct4_5).
File đính kèm:
 khoa_luan_nghien_cuu_anh_huong_cua_thoi_vu_trong_den_qua_tri.pdf

