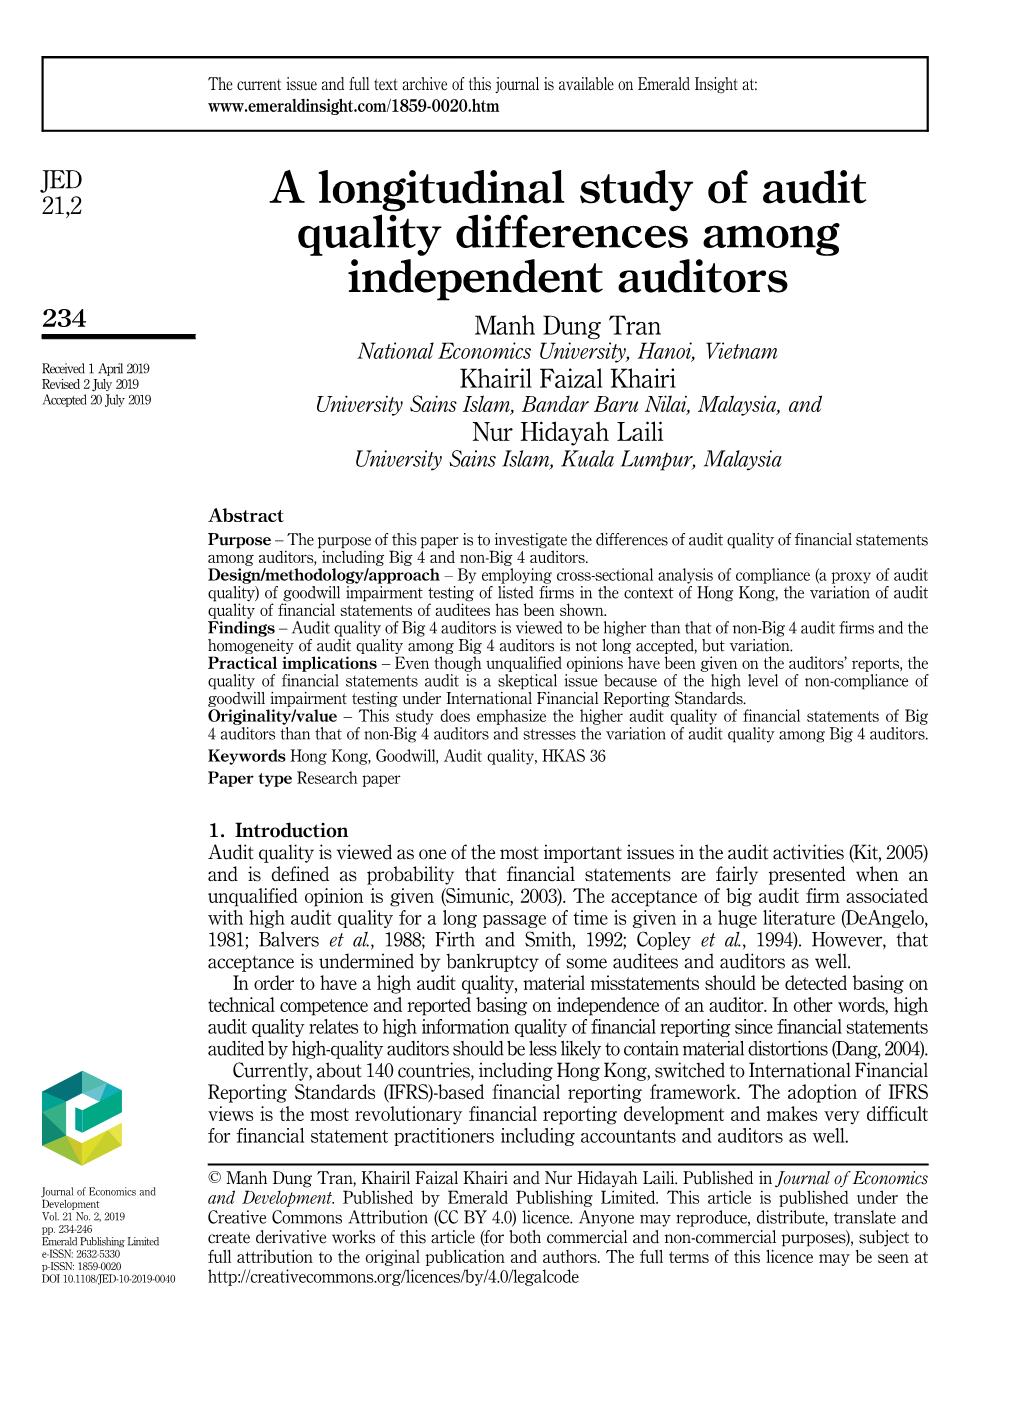
A longitudinal study of audit quality differences among independent auditors
Abstract
Purpose – The purpose of this paper is to investigate the differences of audit quality of financial statements
among auditors, including Big 4 and non-Big 4 auditors.
Design/methodology/approach – By employing cross-sectional analysis of compliance (a proxy of audit
quality) of goodwill impairment testing of listed firms in the context of Hong Kong, the variation of audit
quality of financial statements of auditees has been shown.
Findings – Audit quality of Big 4 auditors is viewed to be higher than that of non-Big 4 audit firms and the
homogeneity of audit quality among Big 4 auditors is not long accepted, but variation.
Practical implications – Even though unqualified opinions have been given on the auditors’ reports, the
quality of financial statements audit is a skeptical issue because of the high level of non-compliance of
goodwill impairment testing under International Financial Reporting Standards.
Originality/value – This study does emphasize the higher audit quality of financial statements of Big
4 auditors than that of non-Big 4 auditors and stresses the variation of audit quality among Big 4 auditors.
Trang 1
Trang 2
Trang 3
Trang 4
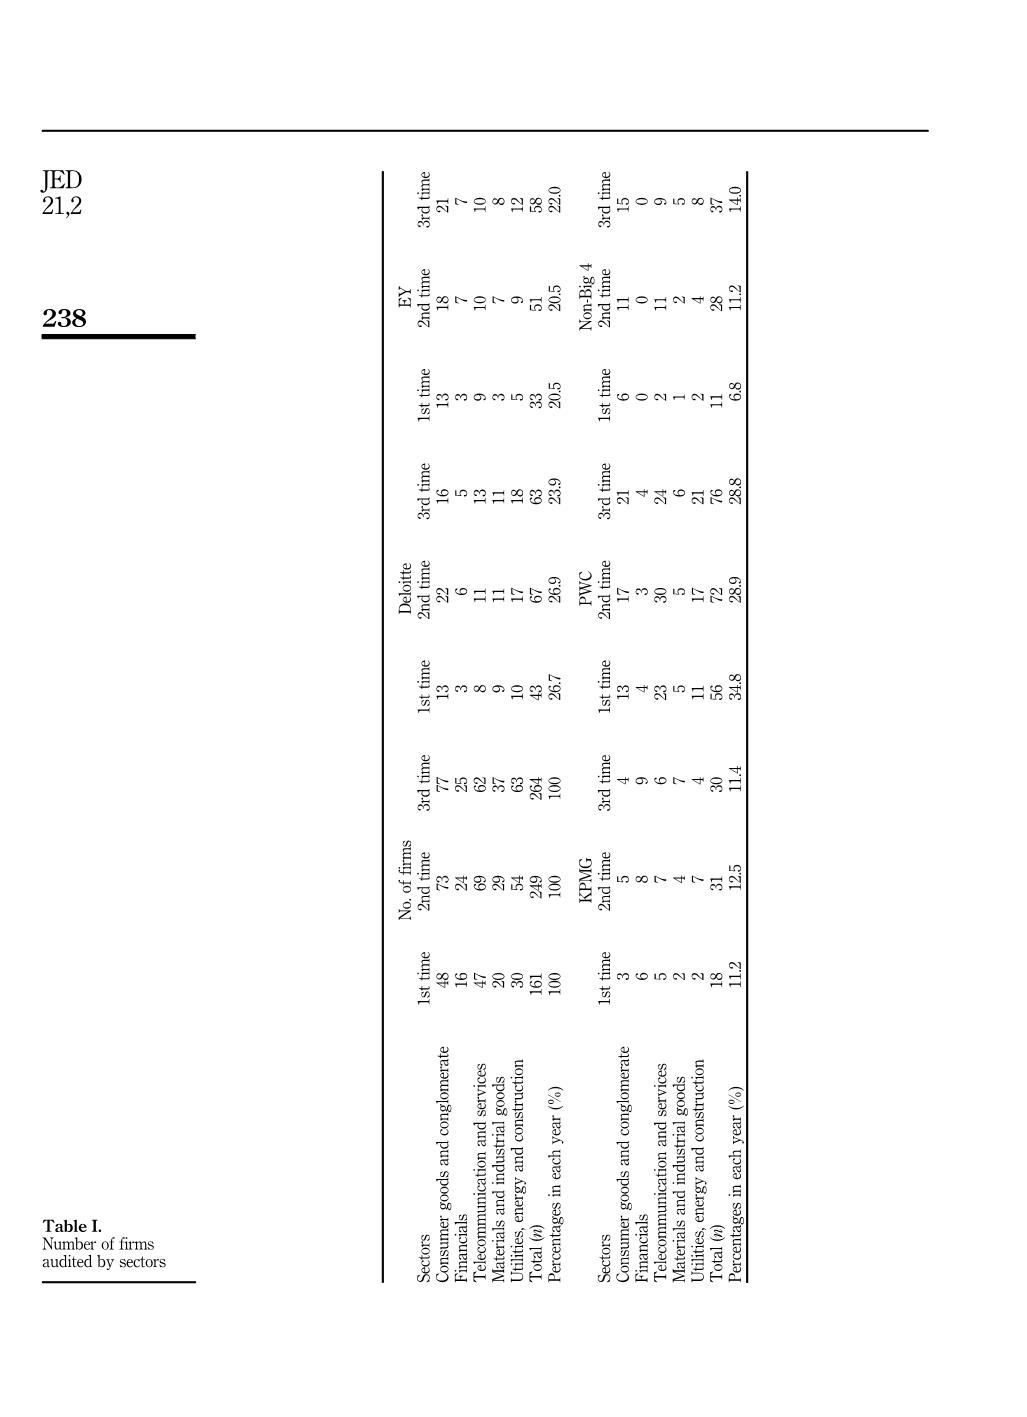
Trang 5
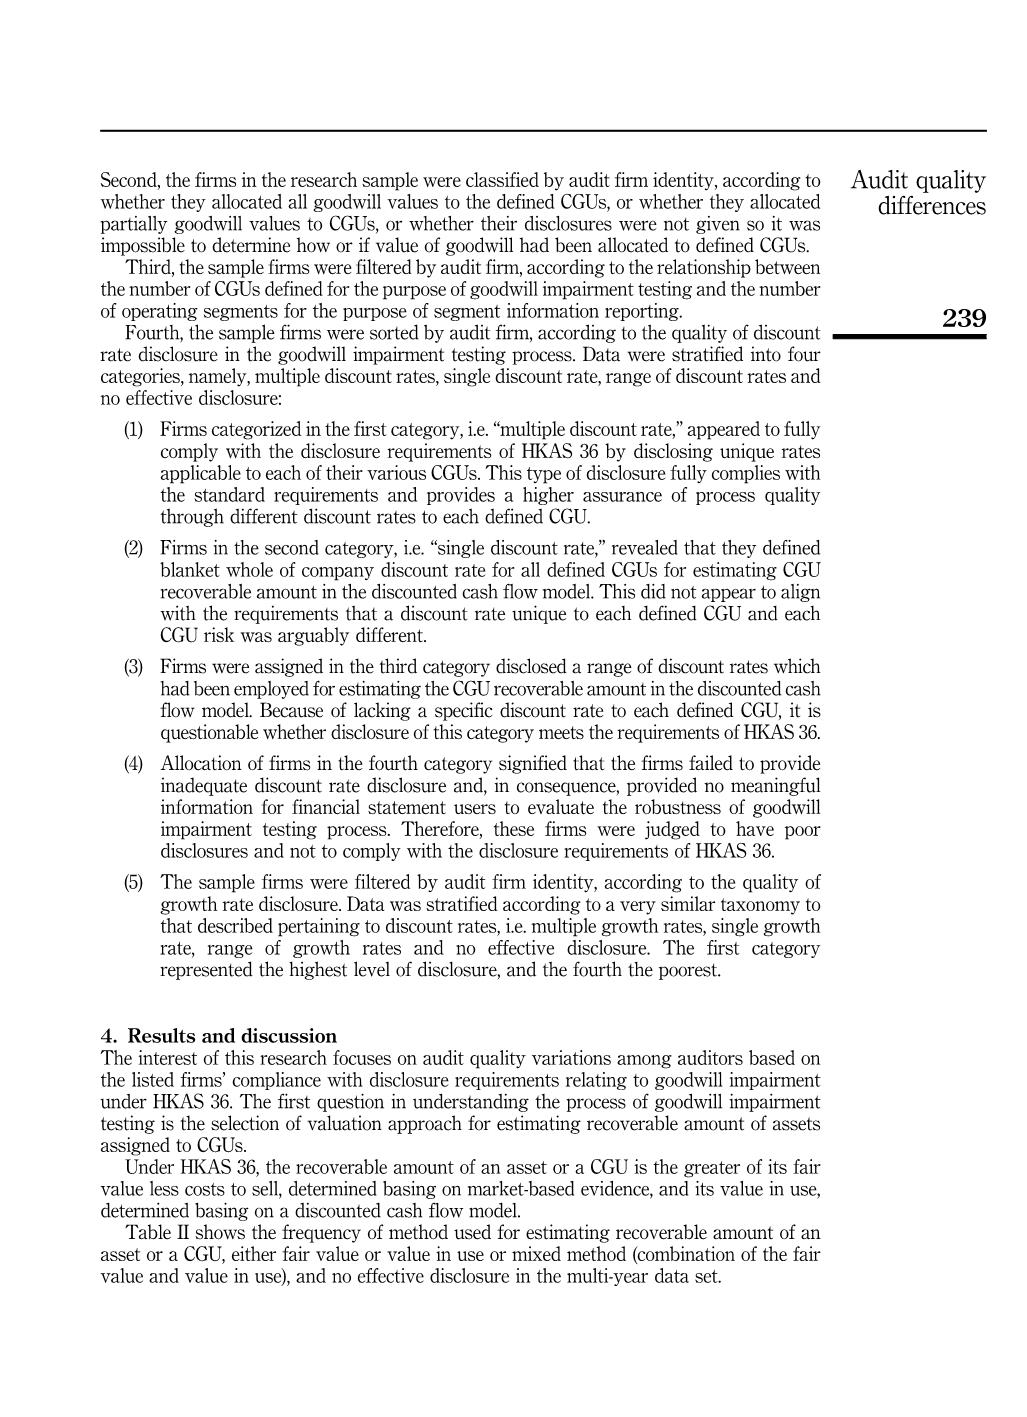
Trang 6
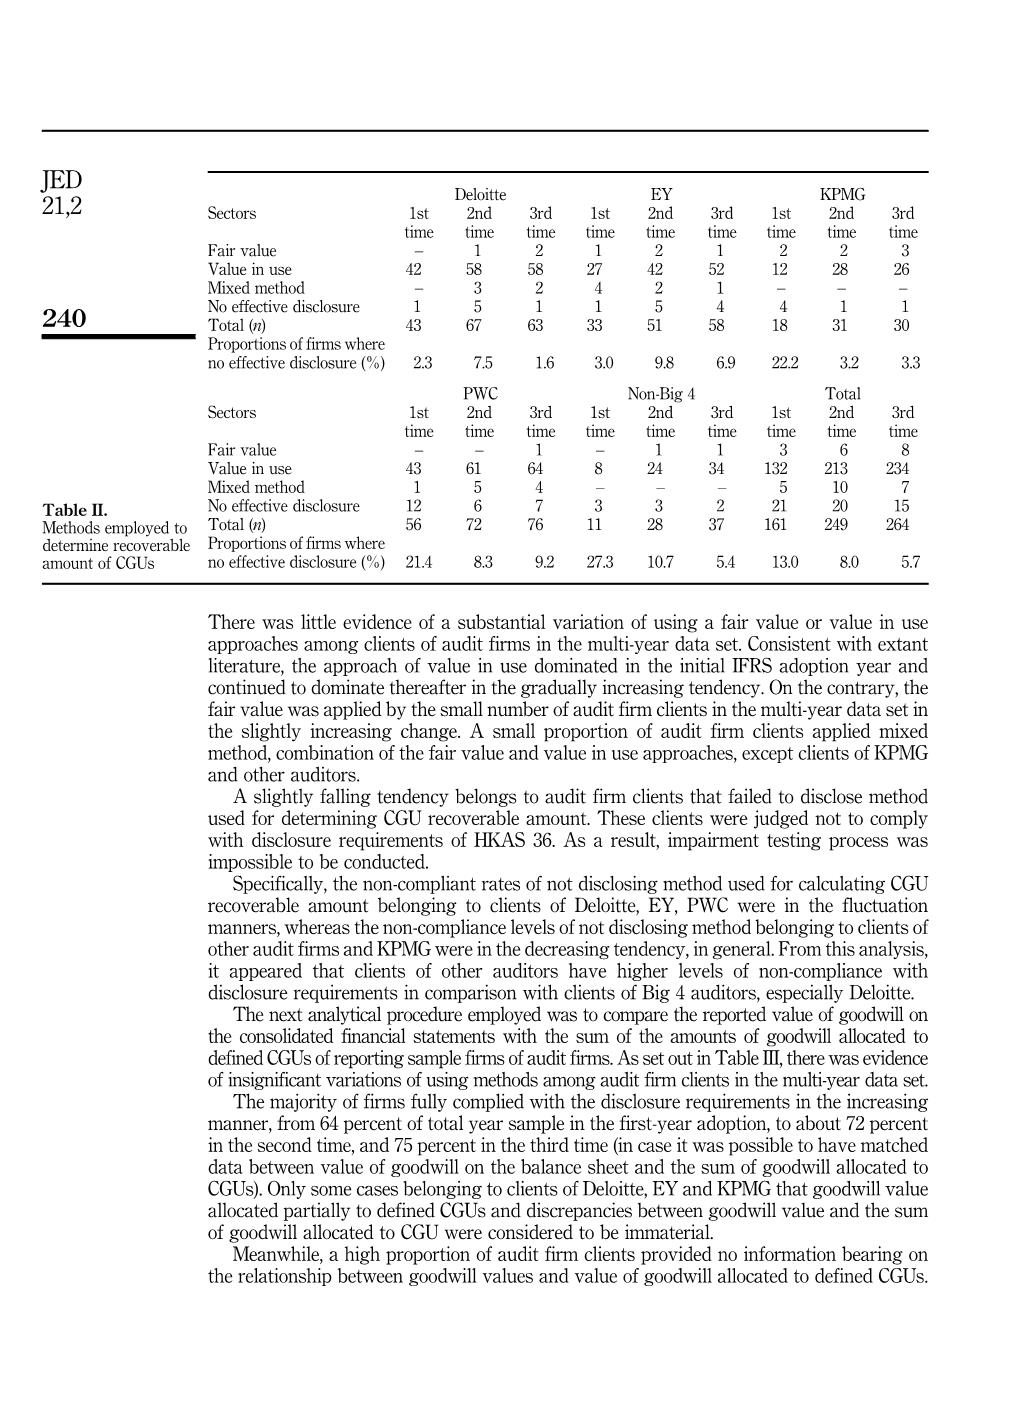
Trang 7
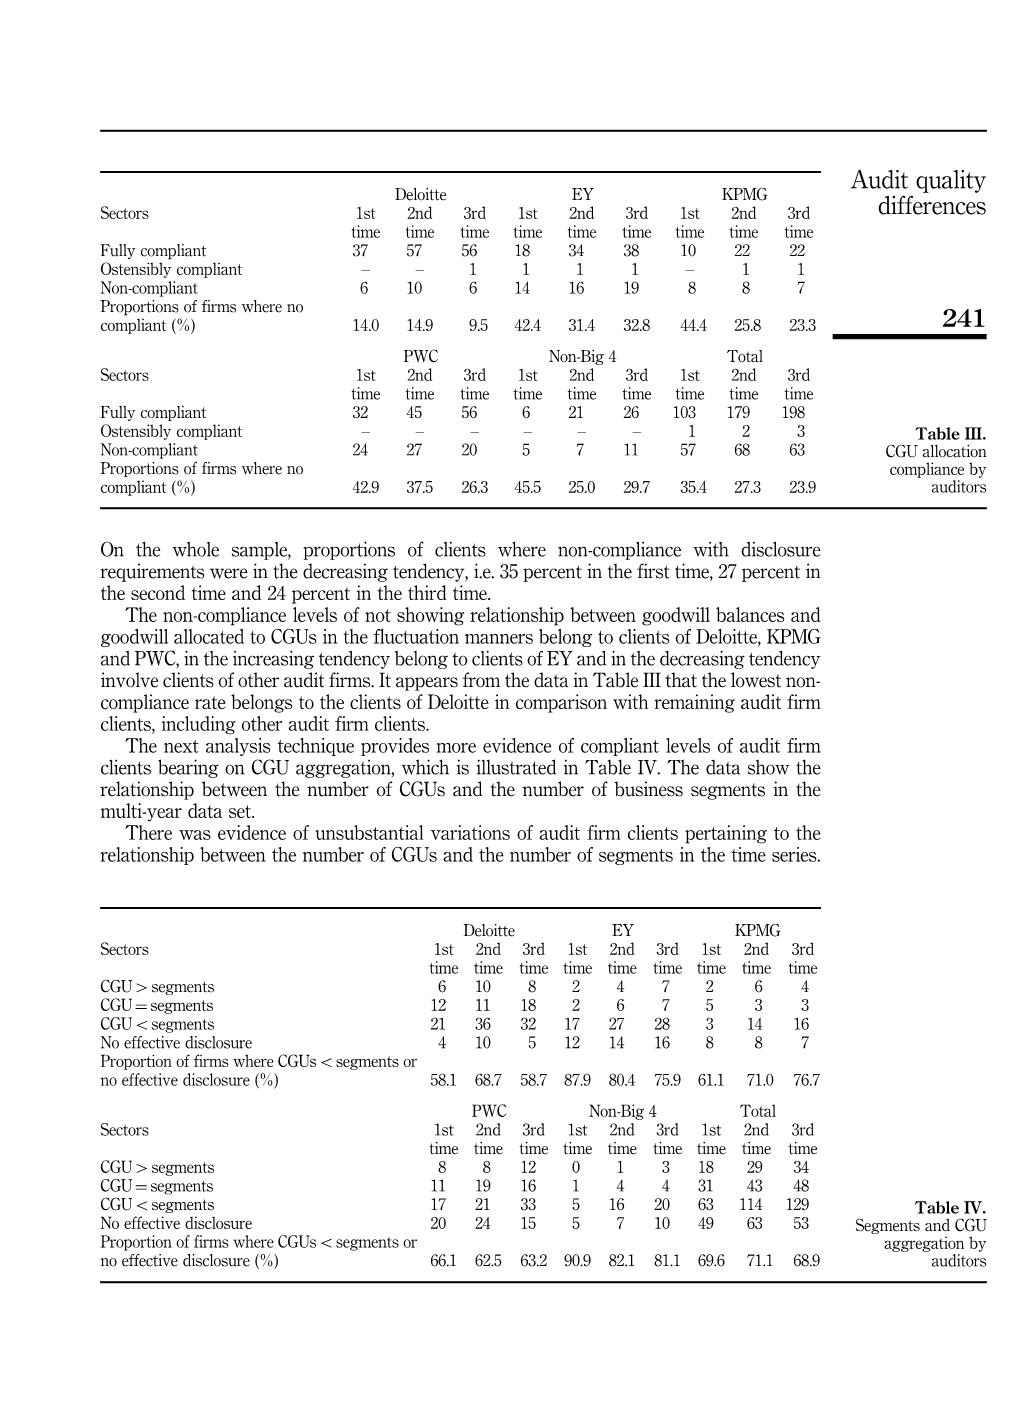
Trang 8
Trang 9
Trang 10
Tải về để xem bản đầy đủ
Tóm tắt nội dung tài liệu: A longitudinal study of audit quality differences among independent auditors
ts 8 8 12 0 1 3 18 29 34
CGU¼ segments 11 19 16 1 4 4 31 43 48
CGUosegments 17 21 33 5 16 20 63 114 129
No effective disclosure 20 24 15 5 7 10 49 63 53
Proportion of firms where CGUsosegments or
no effective disclosure (%) 66.1 62.5 63.2 90.9 82.1 81.1 69.6 71.1 68.9
Table IV.
Segments and CGU
aggregation by
auditors
241
Audit quality
differences
Clearly, the percentages of each year audit firm clients-defined fewer number of CGUs than
the number of segments and provided no effective information pertaining to the number of
CGUs were much higher than that of audit firm clients-defined number of CGUs equal or
higher than the number of segments.
Specifically, the proportion of firms where CGUs lower than segments or no effective
disclosure was in the fluctuation belonging to clients of Deloitte, PWC, and in the increasing
trend involving clients of KPMG, in the decreasing trend belonging to clients of EY and
other audit firms. The data show that clients of other audit firms have highest rates of non-
compliance compared to Big 4 audit firms, especially Deloitte. This suggests a higher risk of
CGU aggregation relating to other audit firm clients than that in clients of Big 4 firms,
particularly Deloitte.
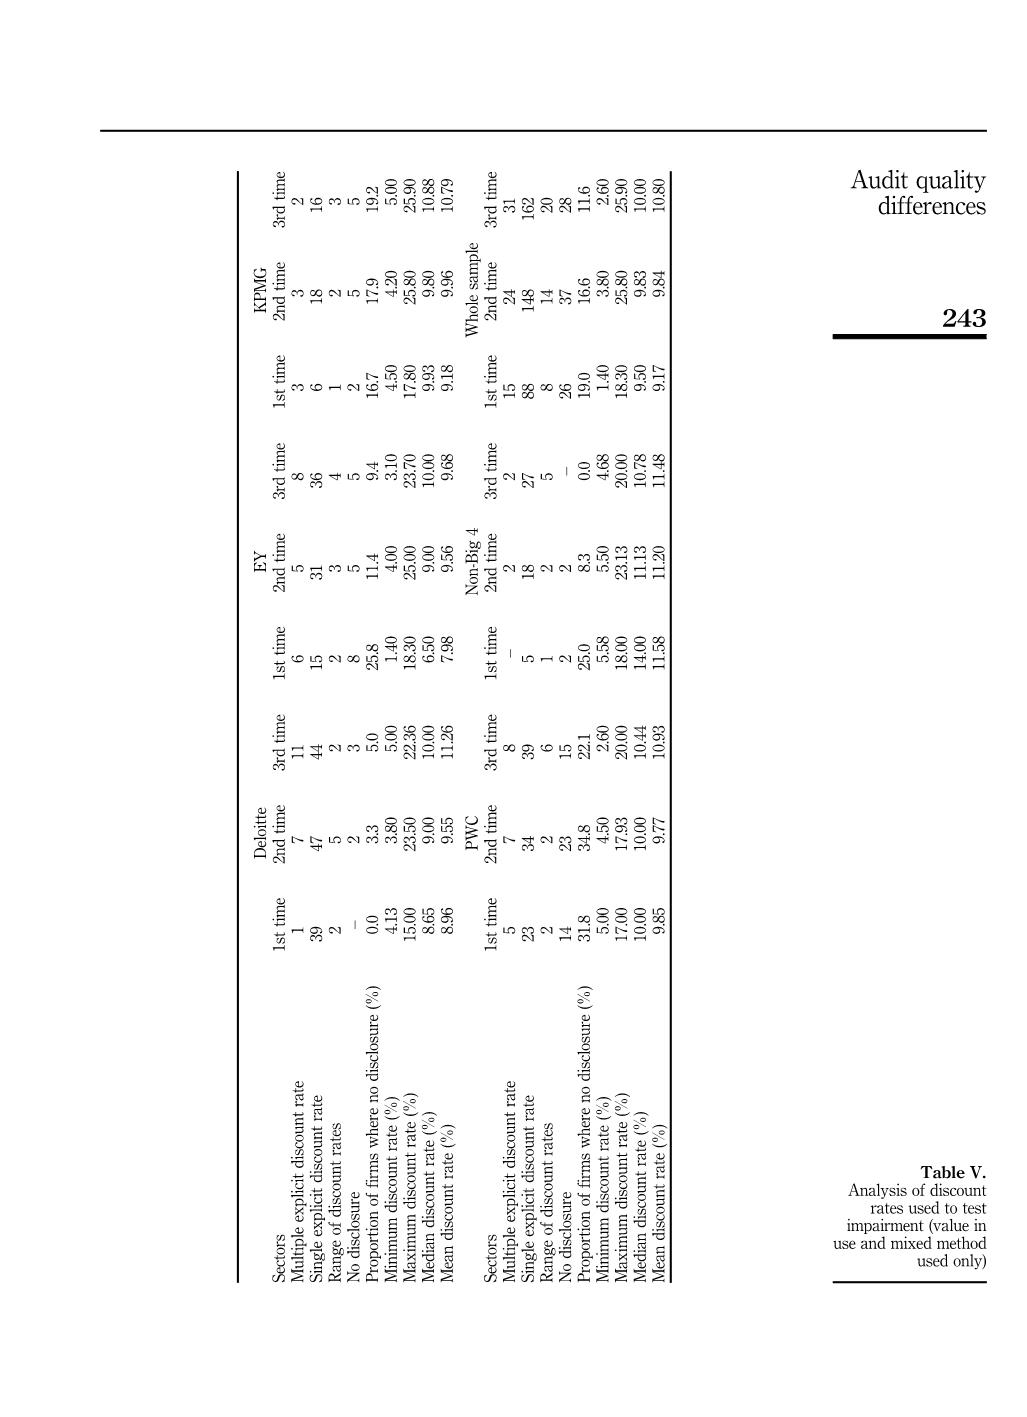
Other technique of analytical procedure is employed for identifying audit firm bearing on
the quality of discount rate disclosure for estimating the CGU-recoverable amount in the
multi-year data set, which is exhibited in Table V. The data show that there was little
evidence of material changes in the various approaches applied by audit firm clients in the
multi-year data set. The dominated method applied pertaining to the discount rate was a
single discount rate for all defined CGUs, even though each CGU has different inherent risk
characteristics, followed by the using of multiple discount rates and the providing no
effective disclosure and range of discount rates.
Overall, a high proportion of audit firm clients reporting no effective disclosure in
relation to discount rate has a falling tendency. The highest level of non-compliance
pertaining to discount rate involves clients of PWC in comparison with remaining audit firm
clients, particularly Deloitte.
The data also show that clients of audit firms employed unusually low discount rate.
Specifically, on the whole discount rate was 1.4 percent in the first-year adoption, 3.8 percent
in the second time and 2.6 percent in the third time. Applying lower mean discount rates in
the model of discounted cash flow would result in overestimating present values
(recoverable amounts), and, consequently, reduce the chance to recognize impairment
expenses in the accounting period, and to increase accounting profit recognized in the
consolidated financial statements.
A scrutiny of data to growth rates employed in the discounted cash flow model for
estimating recoverable amount of each CGU in the multi-year data set. It is striking that the
non-compliant levels of long term growth rate with disclosure requirements were very high,
but in the slightly decreasing tendency, i.e. 73 percent in the first time, 72 percent in the
second time and 67 percent in the third time.
The highest percentage of non-compliance with disclosure requirements pertaining to
growth rate belongs to clients of other auditors in comparison with clients of Big 4 audit
firms, particularly KPMG. By not disclosing long term growth rate, terminal values cannot
be calculated and the accuracy of present values in the model of discounted cash flow is
questionable.
Table VI shows the growth rate employed for testing impairment regime. The average
estimated growth rates employed by other auditor clients were higher than that chosen
by Big 4 auditor clients, particularly Deloitte and EY. By using higher growth rates in
the model of discounted cash flow, other things being equal, would increase the
determined recoverable amount of CGU assets, and reduce the chance of recognizing
goodwill impairment expenses, and increase the possibility of reporting accounting
profit in a given year.
In addition, average estimated forecast horizon chosen by other audit firm clients were
also higher than that selected by Big 4 audit firm clients of audit firms, particularly PWC.
By choosing the average forecast period higher than the stipulated forecast period in the
HKAS 36, justifications have not been pointed by reporting sample clients.
242
JED
21,2
D
el
oi
tt
e
E
Y
K
PM
G
Se
ct
or
s
1s
t
tim
e
2n
d
tim
e
3r
d
tim
e
1s
t
tim
e
2n
d
tim
e
3r
d
tim
e
1s
t
tim
e
2n
d
tim
e
3r
d
tim
e
M
ul
tip
le
ex
pl
ic
it
di
sc
ou
nt
ra
te
1
7
11
6
5
8
3
3
2
Si
ng
le
ex
pl
ic
it
di
sc
ou
nt
ra
te
39
47
44
15
31
36
6
18
16
R
an
ge
of
di
sc
ou
nt
ra
te
s
2
5
2
2
3
4
1
2
3
N
o
di
sc
lo
su
re
–
2
3
8
5
5
2
5
5
Pr
op
or
tio
n
of
fir
m
s
w
he
re
no
di
sc
lo
su
re
(%
)
0.
0
3.
3
5.
0
25
.8
11
.4
9.
4
16
.7
17
.9
19
.2
M
in
im
um
di
sc
ou
nt
ra
te
(%
)
4.
13
3.
80
5.
00
1.
40
4.
00
3.
10
4.
50
4.
20
5.
00
M
ax
im
um
di
sc
ou
nt
ra
te
(%
)
15
.0
0
23
.5
0
22
.3
6
18
.3
0
25
.0
0
23
.7
0
17
.8
0
25
.8
0
25
.9
0
M
ed
ia
n
di
sc
ou
nt
ra
te
(%
)
8.
65
9.
00
10
.0
0
6.
50
9.
00
10
.0
0
9.
93
9.
80
10
.8
8
M
ea
n
di
sc
ou
nt
ra
te
(%
)
8.
96
9.
55
11
.2
6
7.
98
9.
56
9.
68
9.
18
9.
96
10
.7
9
PW
C
N
on
-B
ig
4
W
ho
le
sa
m
pl
e
Se
ct
or
s
1s
t
tim
e
2n
d
tim
e
3r
d
tim
e
1s
t
tim
e
2n
d
tim
e
3r
d
tim
e
1s
t
tim
e
2n
d
tim
e
3r
d
tim
e
M
ul
tip
le
ex
pl
ic
it
di
sc
ou
nt
ra
te
5
7
8
–
2
2
15
24
31
Si
ng
le
ex
pl
ic
it
di
sc
ou
nt
ra
te
23
34
39
5
18
27
88
14
8
16
2
R
an
ge
of
di
sc
ou
nt
ra
te
s
2
2
6
1
2
5
8
14
20
N
o
di
sc
lo
su
re
14
23
15
2
2
–
26
37
28
Pr
op
or
tio
n
of
fir
m
s
w
he
re
no
di
sc
lo
su
re
(%
)
31
.8
34
.8
22
.1
25
.0
8.
3
0.
0
19
.0
16
.6
11
.6
M
in
im
um
di
sc
ou
nt
ra
te
(%
)
5.
00
4.
50
2.
60
5.
58
5.
50
4.
68
1.
40
3.
80
2.
60
M
ax
im
um
di
sc
ou
nt
ra
te
(%
)
17
.0
0
17
.9
3
20
.0
0
18
.0
0
23
.1
3
20
.0
0
18
.3
0
25
.8
0
25
.9
0
M
ed
ia
n
di
sc
ou
nt
ra
te
(%
)
10
.0
0
10
.0
0
10
.4
4
14
.0
0
11
.1
3
10
.7
8
9.
50
9.
83
10
.0
0
M
ea
n
di
sc
ou
nt
ra
te
(%
)
9.
85
9.
77
10
.9
3
11
.5
8
11
.2
0
11
.4
8
9.
17
9.
84
10
.8
0
Table V.
Analysis of discount
rates used to test
impairment (value in
use and mixed method
used only)
243
Audit quality
differences
D
el
oi
tt
e
E
Y
K
PM
G
Se
ct
or
s
1s
t
tim
e
2n
d
tim
e
3r
d
tim
e
1s
t
tim
e
2n
d
tim
e
3r
d
tim
e
1s
t
tim
e
2n
d
tim
e
3r
d
tim
e
M
ul
tip
le
ex
pl
ic
it
gr
ow
th
ra
te
1
1
5
3
3
4
2
3
2
Si
ng
le
ex
pl
ic
it
gr
ow
th
ra
te
5
10
11
8
10
16
6
8
7
R
an
ge
of
gr
ow
th
ra
te
s
–
1
2
–
1
–
–
1
–
N
o
di
sc
lo
su
re
36
49
42
20
30
33
4
16
17
Pr
op
or
tio
n
of
fir
m
s
w
he
re
no
di
sc
lo
su
re
(%
)
85
.7
80
.3
70
.0
64
.5
68
.2
62
.3
33
.3
57
.1
65
.4
M
in
im
um
gr
ow
th
ra
te
(%
)
0.
00
−
1.
00
0.
00
0.
00
0.
00
0.
00
0.
00
0.
00
0.
50
M
ax
im
um
gr
ow
th
ra
te
(%
)
6.
90
9.
00
26
.7
6
10
.0
0
14
.0
0
12
.0
0
6.
54
6.
54
8.
00
M
ed
ia
n
gr
ow
th
ra
te
(%
)
0.
00
1.
50
2.
75
0.
00
1.
25
3.
90
4.
65
3.
03
5.
00
M
ea
n
gr
ow
th
ra
te
(%
)
1.
88
2.
54
3.
40
1.
85
3.
11
3.
29
3.
52
3.
32
4.
94
PW
C
N
on
-B
ig
4
W
ho
le
sa
m
pl
e
Se
ct
or
s
1s
t
tim
e
2n
d
tim
e
3r
d
tim
e
1s
t
tim
e
2n
d
tim
e
3r
d
tim
e
1s
t
tim
e
2n
d
tim
e
3r
d
tim
e
M
ul
tip
le
ex
pl
ic
it
gr
ow
th
ra
te
3
6
3
–
–
1
9
13
15
Si
ng
le
ex
pl
ic
it
gr
ow
th
ra
te
8
9
14
–
5
8
27
42
56
R
an
ge
of
gr
ow
th
ra
te
s
1
4
5
–
1
1
1
8
8
N
o
di
sc
lo
su
re
32
47
46
8
18
24
10
0
16
0
16
2
Pr
op
or
tio
n
of
fir
m
s
w
he
re
no
di
sc
lo
su
re
(%
)
72
.7
71
.2
67
.6
10
0.
0
75
.0
70
.6
73
.0
71
.7
67
.2
M
in
im
um
gr
ow
th
ra
te
(%
)
0.
00
0.
00
0.
00
n/
d
2.
00
0.
00
0.
00
−
1.
00
0.
00
M
ax
im
um
gr
ow
th
ra
te
(%
)
13
.0
0
20
.0
0
15
.6
0
n/
d
7.
00
21
.0
0
13
.0
0
20
.0
0
26
.7
6
M
ed
ia
n
gr
ow
th
ra
te
(%
)
3.
70
2.
00
3.
40
n/
d
4.
00
3.
00
3.
00
2.
88
3.
40
M
ea
n
gr
ow
th
ra
te
(%
)
4.
61
3.
47
3.
99
n/
d
4.
30
6.
13
3.
11
3.
25
3.
99
Table VI.
Analysis of growth
rates used to test
impairment (value in
use and mixed method
used only)
244
JED
21,2
5. Conclusion
This research is conducted for finding evidence which might reveal variations in audit
quality among auditors (Deloitte, EY, KPMG, PWC and other audit firms) in the multi-year
data set. The methodology applied in this study focused on the nature and quality of
disclosures in relation to the goodwill impairment testing process under HKAS 36.
Basing on accumulated evidence obtained from the sample of listed firms in
Hong Kong in three years after HKFRS adoption, including HKAS 36. By testing the basic
disclosure requirements pertaining to goodwill impairment such as method used, CGU
aggregation and specific disclosure requirements in relation to related assumptions such
as variables of discount rates and growth rates in the discounted cash flow model, the
research found that there was systematically non-compliant levels and poor disclosure
quality pertaining to goodwill impairment among clients of auditors in the multi-year data
set after HKFRS adoption.
Taking an overview of the whole sample, variations of non-compliant rates with
disclosure requirements pertaining to goodwill impairment was small and in the
slightly decreasing tendency in the time series. Taking specific audit firm clients in each
year sample, the highest rates of non-compliance with disclosure requirements pertaining
to goodwill impairment stick to clients of other audit firms in comparison with clients of
Big 4 auditors. Out of Big 4 auditors, clients of Deloitte were judged, on the whole, to be
the best practice disclosure bearing on goodwill impairment testing process. There
have been alternative positions of higher levels of non-compliance among clients of
EY, KPMG and PWC.
Apparently, the extent of compliant rates with HKFRS, including HKAS 36, is likely to be
positively related to the probability of detecting and reporting material misstatements in the
accounting system of a company. Variations in disclosure of goodwill impairment of audit
firm clients are likely to be the result of audit quality variations in the multi-year data set.
Based on the falling tendency of non-compliance levels with disclosure quality bearing on
goodwill impairment, audit quality in the following years is judged to be higher than that in
the previous years. Evidence obtained in this research may contribute to the literature by
supporting the proposition that quality of Big 4 auditors is seen to be higher than that of
non-Big 4 audit firms and audit quality among Big 4 auditors is subject to variation.
References
Balvers, R.J., Macdonald, B. and Miller, R.E. (1988), “Underpricing of new issues and the choice of
auditor as a signal of investment banker reputation”, The Accounting Review, Vol. 63 No. 4,
pp. 605-622.
Becker, C.L., Defond, M.L., Jiambalvo, J. and Subramanyam, K.R. (1998), “The effect of audit quality on
earnings management”, Contemporary Accounting Research, Vol. 15 No. 1, pp. 1-24.
Caneghem, T.V. (2004), “The impact of audit quality on earnings rounding-up behaviour: some U.K.
evidence”, European Accounting Review, Vol. 13 No. 4, pp. 771-786.
Carlin, T.M., Finch, N. and Laili, N.H. (2009), “Investigating audit quality among Big 4 malaysian
firms”, Asian Review of Accounting, Vol. 17 No. 2, pp. 96-114.
Copley, P.A., Doucet, M.S. and Gaver, K.M. (1994), “A simultaneous equations analysis of quality
control review outcomes and engagement fees for audit of recipients of federal financial
assistance”, The Accounting Review, Vol. 69 No. 1, pp. 244-256.
Dang, L. (2004), “Assessing actual audit quality”, PhD thesis, Drexel University, PA.
Deangelo, L.E. (1981), “Audit size and audit quality”, Journal of Accounting and Economics, Vol. 3 No. 3,
pp. 183-199.
Defond, M.L. and Jiambalvo, J. (1991), “Incidence and circumstances of accounting errors”, The
Accounting Review, Vol. 66 No. 3, pp. 643-655.
245
Audit quality
differences
Eisenberg, T. and Macey, J.R. (2003), “Was Arthur Andersen different? An empirical examination of
major accounting firms’ audits of large clients”, Journal of Empirical Legal Studies, Vol. 1,
pp. 263-300.
Firth, M. and Smith, A. (1992), “Selection of auditor firms by companies in the new issue market”,
Applied Economics, Vol. 24 No. 2, pp. 247-255.
Fuerman, R.D. (2004), “Audit quality examined one large CPA firm at a time: mid-1990s empirical
evidence of a precursor of Arthur Andersen’s collapse”, Corporate Ownership and Control, Vol. 2
No. 1, pp. 137-148.
Hoogendoorn, M. (2006), “International accounting regulation and IFRS implementation in Europe and
beyond – experiences with first-time adoption in Europe”, Accounting in Europe, Vol. 3 No. 1,
pp. 23-26.
Kit, F.Y. (2005), Evidence of Audit Quality Differences among Big Five Auditors: An Empirical Study,
City University of Hong Kong, Kowloon Tong.
Krishnan, J. and Schauer, P.C. (2000), “The differentiation of quality among auditors: evidence from the
not-for-profit sector”, Auditing: A Journal of Practice and Theory, Vol. 19 No. 2, pp. 9-25.
Moize, P. (1997), “Auditor reputation: the international empirical evidence”, International Journal of
Auditing, Vol. 1 No. 1, pp. 61-74.
Palmrose, Z.-V. (1988), “An analysis of auditor litigation and audit service quality”, The Accounting
Review, Vol. 63 No. 1, pp. 55-73.
Simunic, D.A. (2003), Audit Quality and Audit Firm Size: Revisited, The University of Bristish Columbia,
Vancouver.
Corresponding author
Manh Dung Tran can be contacted at: manhdung@ktpt.edu.vn
For instructions on how to order reprints of this article, please visit our website:
www.emeraldgrouppublishing.com/licensing/reprints.htm
Or contact us for further details: permissions@emeraldinsight.com
246
JED
21,2
File đính kèm:
 a_longitudinal_study_of_audit_quality_differences_among_inde.pdf

