The effects R&D expenditures on the market value in the telecommunication industry-evidence from North America
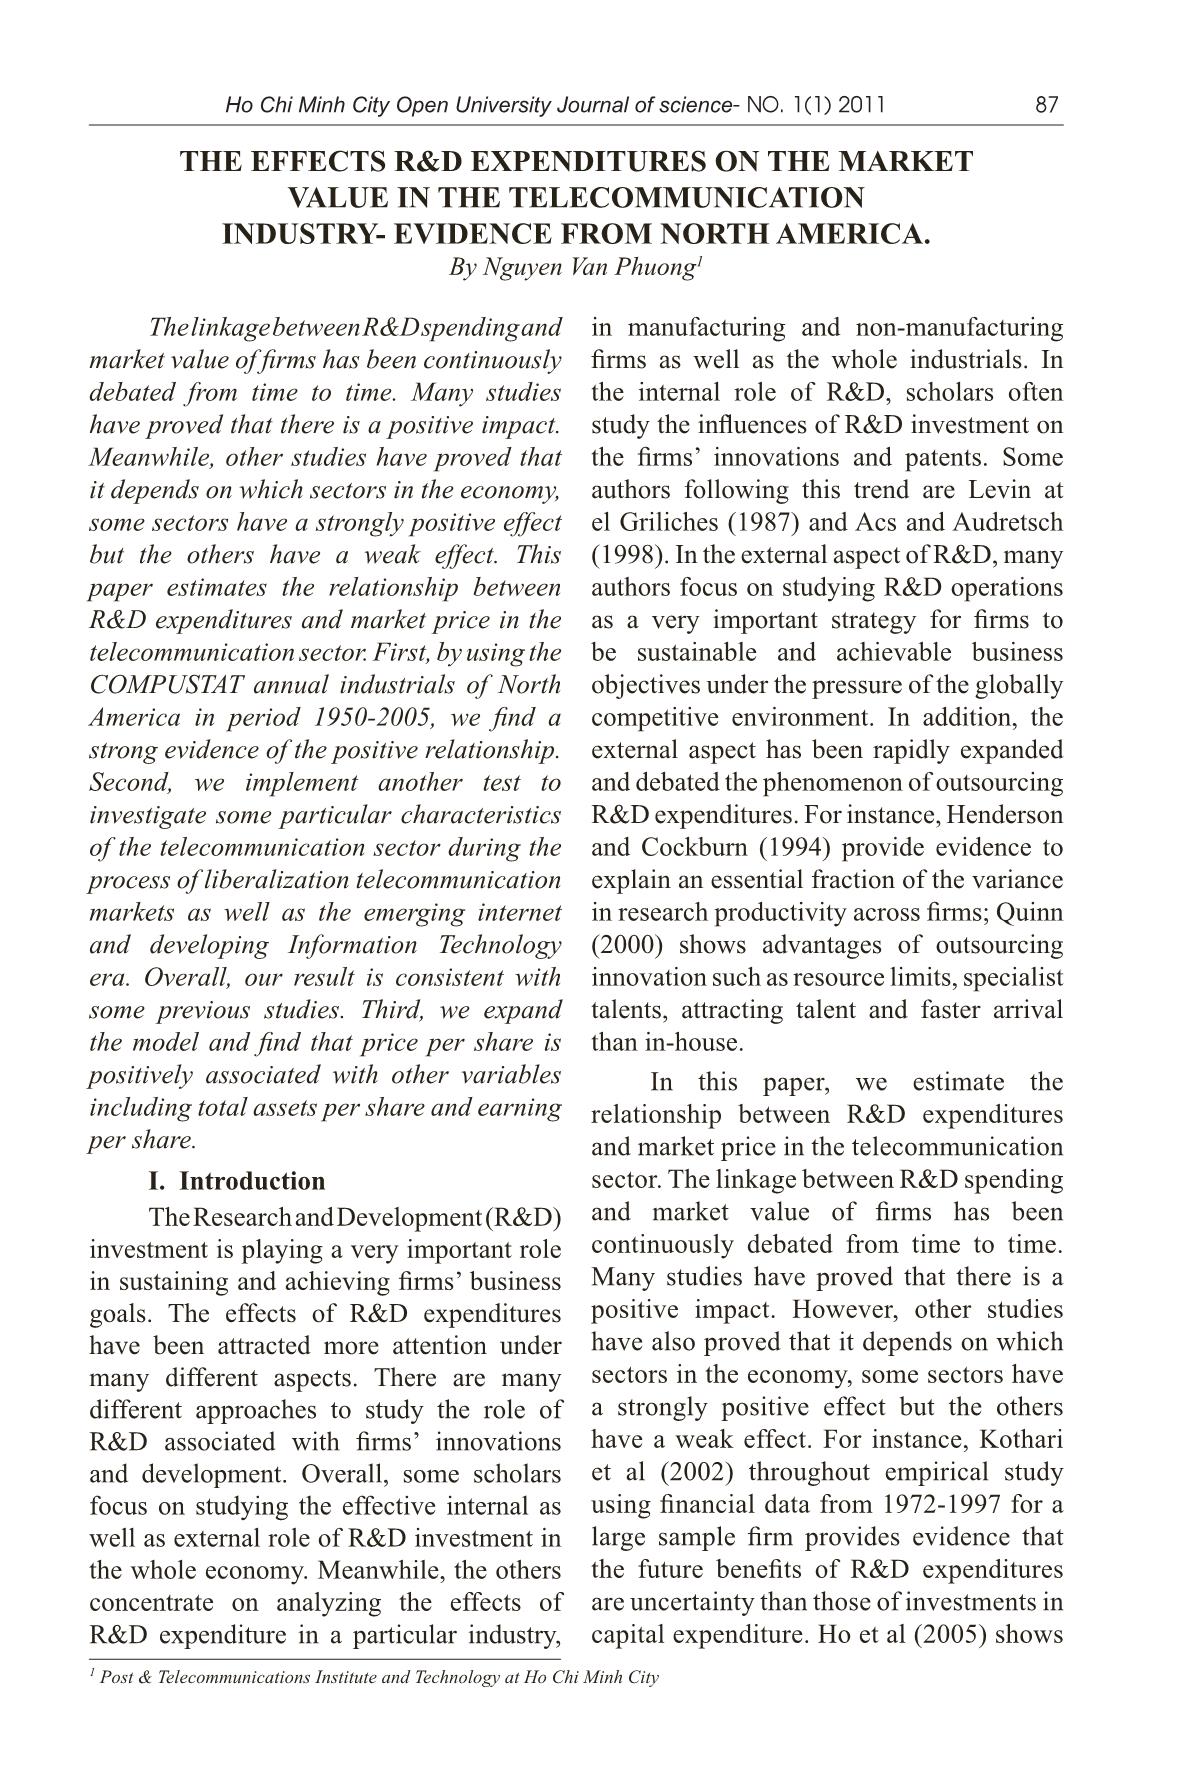
The linkage between R&D spending and
market value of firms has been continuously
debated from time to time. Many studies
have proved that there is a positive impact.
Meanwhile, other studies have proved that
it depends on which sectors in the economy,
some sectors have a strongly positive effect
but the others have a weak effect. This
paper estimates the relationship between
R&D expenditures and market price in the
telecommunication sector. First, by using the
COMPUSTAT annual industrials of North
America in period 1950-2005, we find a
strong evidence of the positive relationship.
Second, we implement another test to
investigate some particular characteristics
of the telecommunication sector during the
process of liberalization telecommunication
markets as well as the emerging internet
and developing Information Technology
era. Overall, our result is consistent with
some previous studies. Third, we expand
the model and find that price per share is
positively associated with other variables
including total assets per share and earning
per share
Trang 1
Trang 2
Trang 3
Trang 4
Trang 5
Trang 6
Trang 7
Tóm tắt nội dung tài liệu: The effects R&D expenditures on the market value in the telecommunication industry-evidence from North America
y relative to return volatility, after manufacturing firms. By empirical study of
controlling for firm size, age and industry a 40 year period 1962-2001, Ho et al (2005)
effects. By using a sample of around 1200 show that intensive investment in R&D
companies’ expenditures on R&D, Lev and contributes positively to the one-year stock
Sougiannis (1999) provide some evidences market performances of manufacturing
(1) low market-to-book companies have a firms but not for non-manufacturing firms.
large R&D capital and vice versa; (2) the In recent research, Sakakibara et al
ratio of R&D capital to market value is (2006) have found that R&D expenditures
closely relative to the book-to-market ratio; contribute to operating income for five years
(3) the return premium is essentially higher on average for firms listed in Tokyo stock
for risky R&D (basic research) than for exchange. Moreover, they also find R&D
lower risk R&D (development). capital information is reflected in stock
 Throughout the empirical study, prices throughout analyzing relationship
Sougiannis et al (2001) show that the market between R&D capital and subsequent stock
is apparently too pessimistic about beaten- return of manufacturing enterprises.
down R&D intensive technology stocks’ III. Empirical Studies
prospects. Firms with high R&D to equity
 Overall, the effects of R&D
market value earn large excess returns.
 expenditures have been carefully studied
Furthermore, Amir et al (2005) also consider by many scholars in theoretical aspects
the effective R&D expenditures on the future as well as empirical studies. However,
earnings. They build a model to estimate most previous studies focus on the whole
the association between R&D investment economy or some particular sectors such as
and capital expenditures (CAPEX) and the pharmaceutical industry, non-manufacturing
variance of future earnings per share and and manufacturing firms. In recent time,
operating income. They provide evidence many authors have concentrated on exploring
that R&D investment lead to higher volatility the hot muddles of outsourcing R&D. Here,
of future earnings than capital expenditures we focus on analyzing the linkage between
only in R&D-intensive industries, where R&D expenditures and market value of
industry R&D intensity is measured as the firms in the telecommunication industry.
R&D-to-CAPEX ratio. Besides, they also A brief background of
show that the stronger association of R&D telecommunication industry
with uncertainty in future earnings is a Telecommunications is playing a very
recent phenomenon. important not only in its own right, but
90 Ho Chi Minh City Open University Journal of science- No. 1(1) 2011
also in building a significantly backbone respective R&D expenditures per share
infrastructure to support other industries (R&Dps).
to develop. As a result, many governments
 (PPS)it = bit + ait (R&Dps)it. (1)
usually consider investing and protecting Our hypothesis is that firms with
their own telecommunication industry as a higher R&D should have higher PPS,
monopolistic sector. However, the effect of ps
 so we expect the slope coefficient (ait) to
Telecommunication Act 1996 in USA has led be positive.
to increasing competition and declining in
regulations, thereby encouraging innovations We are using the database constructed
 from consecutive COMPUSAT in the
and increasing in R&D investment,
 period 1971-2005 for S&P industrial
enhancing many services with lower prices.
 annual. After performing the filtering
As a result of the Act is not only significant
 process, we are only able to identify
for American customers, but also leads to
 287 telecommunication firms with 2261
other countries to pursue such as France,
 observations from the R&D Master file
Germany, Japan and UK and so on. The most
 used to run the regression model.
important result is that the liberalization of
telecommunication markets has moved to First, we pool all usable observations
the world stage under auspices the World of the database to estimate regression
Trade Organization (WTO) (Jerram at el, Equation (1). Results of a regression
 of PPS against R&D for S&P annual
1997-1998, chapter 4: Liberalisation: Case ps
studies in telecommunication). telecommunication firms in period 1971-
 2005 are presented as follows:
 Because of a particular
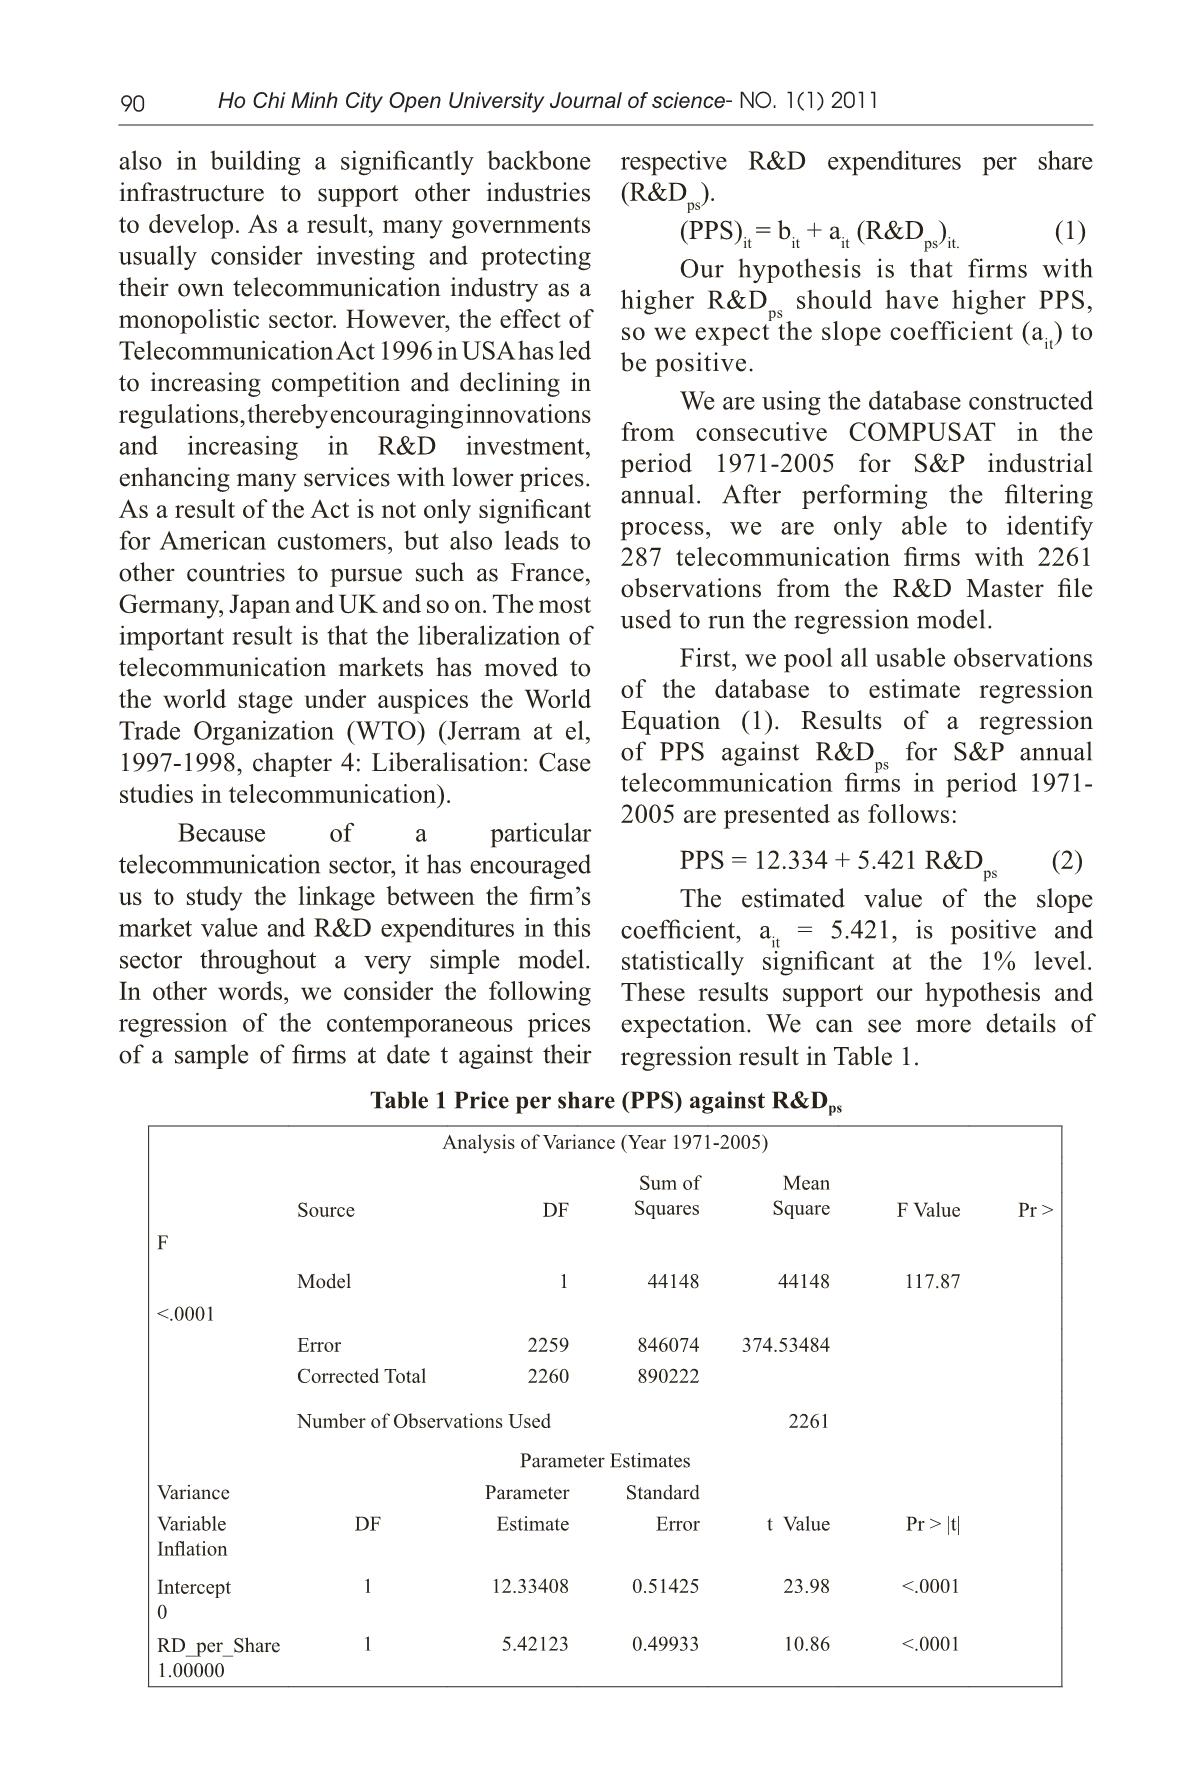
telecommunication sector, it has encouraged PPS = 12.334 + 5.421 R&Dps (2)
us to study the linkage between the firm’s The estimated value of the slope
market value and R&D expenditures in this coefficient, ait = 5.421, is positive and
sector throughout a very simple model. statistically significant at the 1% level.
In other words, we consider the following These results support our hypothesis and
regression of the contemporaneous prices expectation. We can see more details of
of a sample of firms at date t against their regression result in Table 1.
 Table 1 Price per share (PPS) against R&Dps
 Analysis of Variance (Year 1971-2005)
 Sum of Mean
 Source DF Squares Square F Value Pr >
 F
 Model 1 44148 44148 117.87
 <.0001
 Error 2259 846074 374.53484
 Corrected Total 2260 890222
 Number of Observations Used 2261
 Parameter Estimates
 Variance Parameter Standard
 Variable DF Estimate Error t Value Pr > |t|
 Inflation
 Intercept 1 12.33408 0.51425 23.98 <.0001
 0
 RD_per_Share 1 5.42123 0.49933 10.86 <.0001
 1.00000
 Ho Chi Minh City Open University Journal of science- No. 1(1) 2011 91
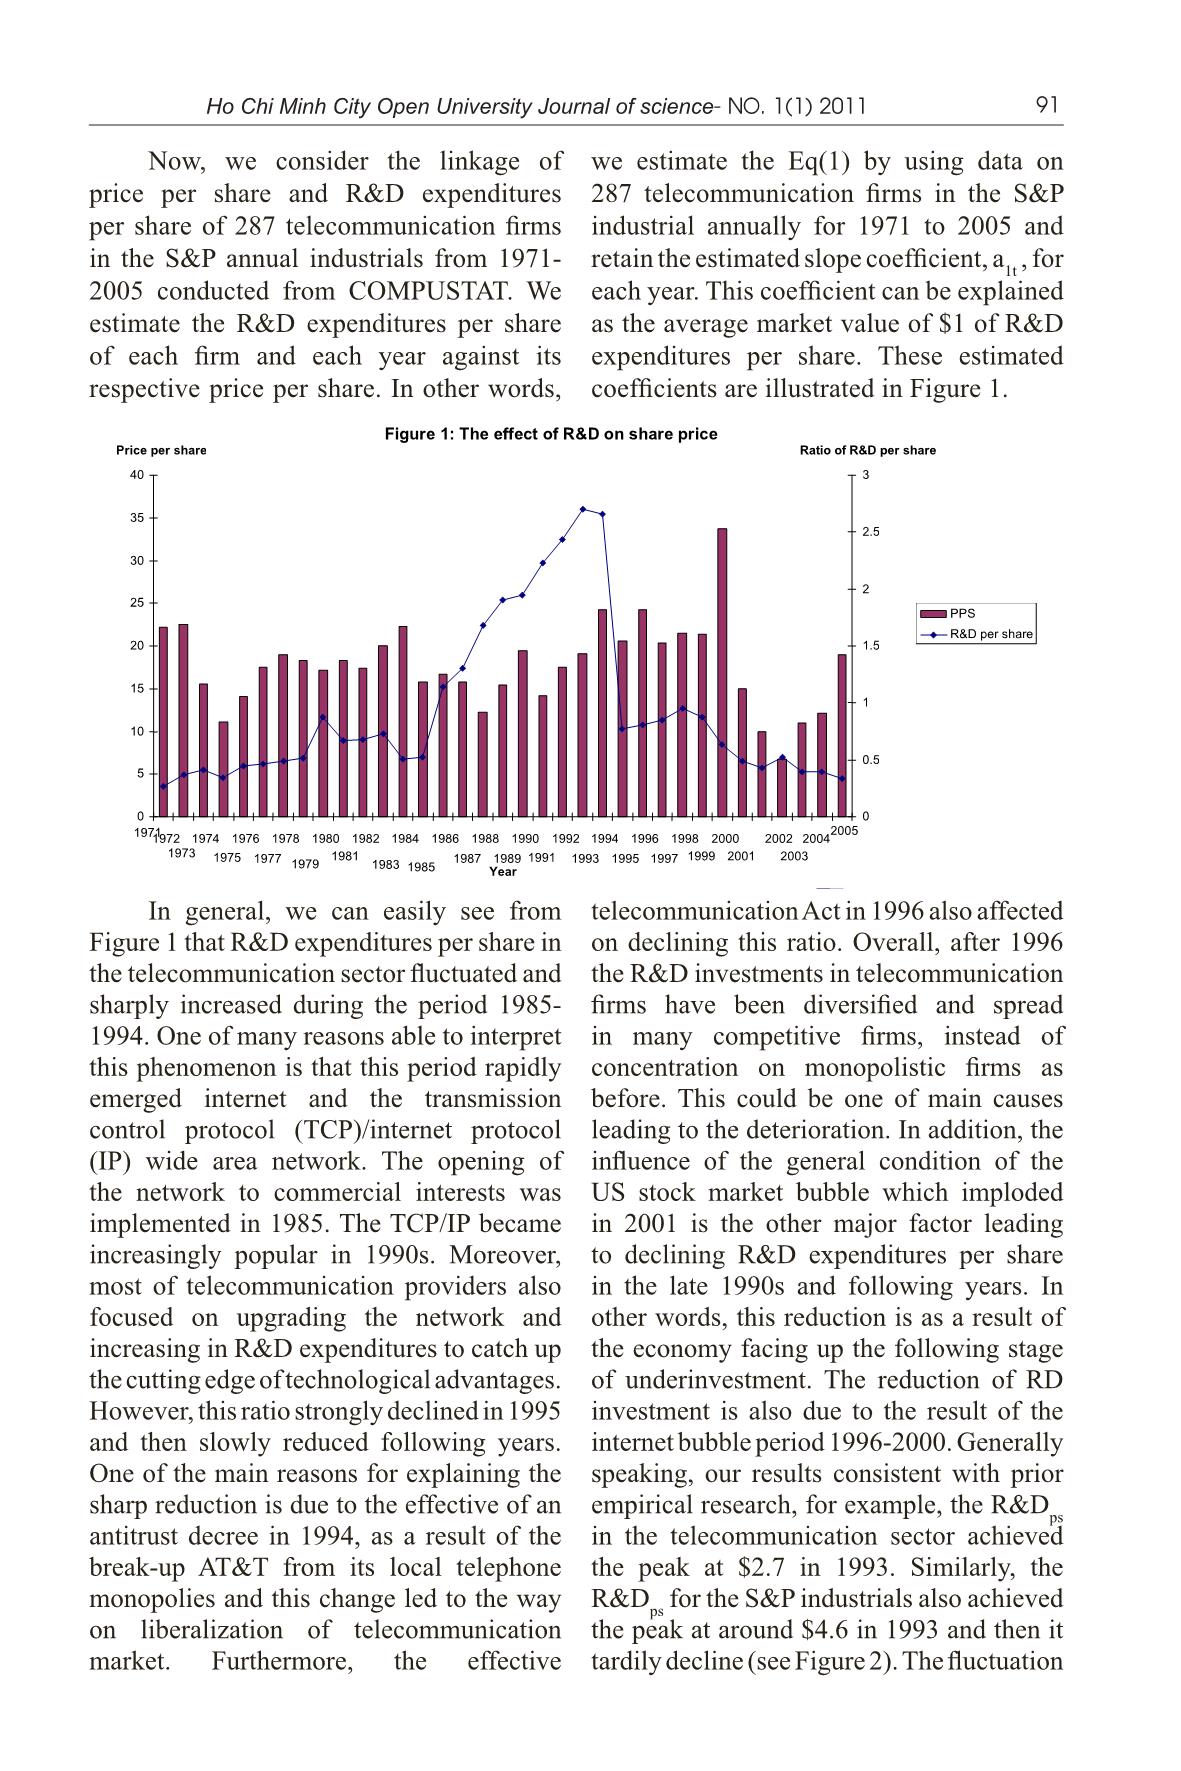
 Now, we consider the linkage of we estimate the Eq(1) by using data on
price per share and R&D expenditures 287 telecommunication firms in the S&P
per share of 287 telecommunication firms industrial annually for 1971 to 2005 and
in the S&P annual industrials from 1971- retain the estimated slope coefficient, 1ta , for
2005 conducted from COMPUSTAT. We each year. This coefficient can be explained
estimate the R&D expenditures per share as the average market value of $1 of R&D
of each firm and each year against its expenditures per share. These estimated
respective price per share. In other words, coefficients are illustrated in Figure 1.
 Figure 1: The effect of R&D on share price
 Price per share Ratio of R&D per share
 40 3
 35
 2.5
 30
 2
 25
 PPS
 R&D per share
 20 1.5
 15
 1
 10
 0.5
 5
 0 0
 1971 2005
 1972 1974 1976 1978 1980 1982 1984 1986 1988 1990 1992 1994 1996 1998 2000 2002 2004
 1973 1975 1977 1981 1987 1989 1991 1993 1995 1997 1999 2001 2003
 1979 1983 1985
 Year
 In general, we can easily see from telecommunication Act in 1996 also affected
Figure 1 that R&D expenditures per share in on declining this ratio. Overall, after 1996
the telecommunication sector fluctuated and the R&D investments in telecommunication
sharply increased during the period 1985- firms have been diversified and spread
1994. One of many reasons able to interpret in many competitive firms, instead of
this phenomenon is that this period rapidly concentration on monopolistic firms as
emerged internet and the transmission before. This could be one of main causes
control protocol (TCP)/internet protocol leading to the deterioration. In addition, the
(IP) wide area network. The opening of influence of the general condition of the
the network to commercial interests was US stock market bubble which imploded
implemented in 1985. The TCP/IP became in 2001 is the other major factor leading
increasingly popular in 1990s. Moreover, to declining R&D expenditures per share
most of telecommunication providers also in the late 1990s and following years. In
focused on upgrading the network and other words, this reduction is as a result of
increasing in R&D expenditures to catch up the economy facing up the following stage
the cutting edge of technological advantages. of underinvestment. The reduction of RD
However, this ratio strongly declined in 1995 investment is also due to the result of the
and then slowly reduced following years. internet bubble period 1996-2000. Generally
One of the main reasons for explaining the speaking, our results consistent with prior
sharp reduction is due to the effective of an empirical research, for example, the R&Dps
antitrust decree in 1994, as a result of the in the telecommunication sector achieved
break-up AT&T from its local telephone the peak at $2.7 in 1993. Similarly, the
monopolies and this change led to the way R&Dps for the S&P industrials also achieved
on liberalization of telecommunication the peak at around $4.6 in 1993 and then it
market. Furthermore, the effective tardily decline (see Figure 2). The fluctuation
92 Ho Chi Minh City Open University Journal of science- No. 1(1) 2011
of R&D expenditures of telecommunication 2005. The number of telecommunication
firms has closely associated with the R&D firms in our sample is the same as before
expenditures of the whole economy. This (287 firms) but the number of observations
once more provides a strong evidence to is increased from 2261 to 2312. The data
prove that the telecommunication sector process is the same as the above description
has been playing a very important role in of the first model. After pooling all of
supporting other industrials to develop and observations, we run the regression model
contributing a significant proportion in the and get the following result:
whole economy.
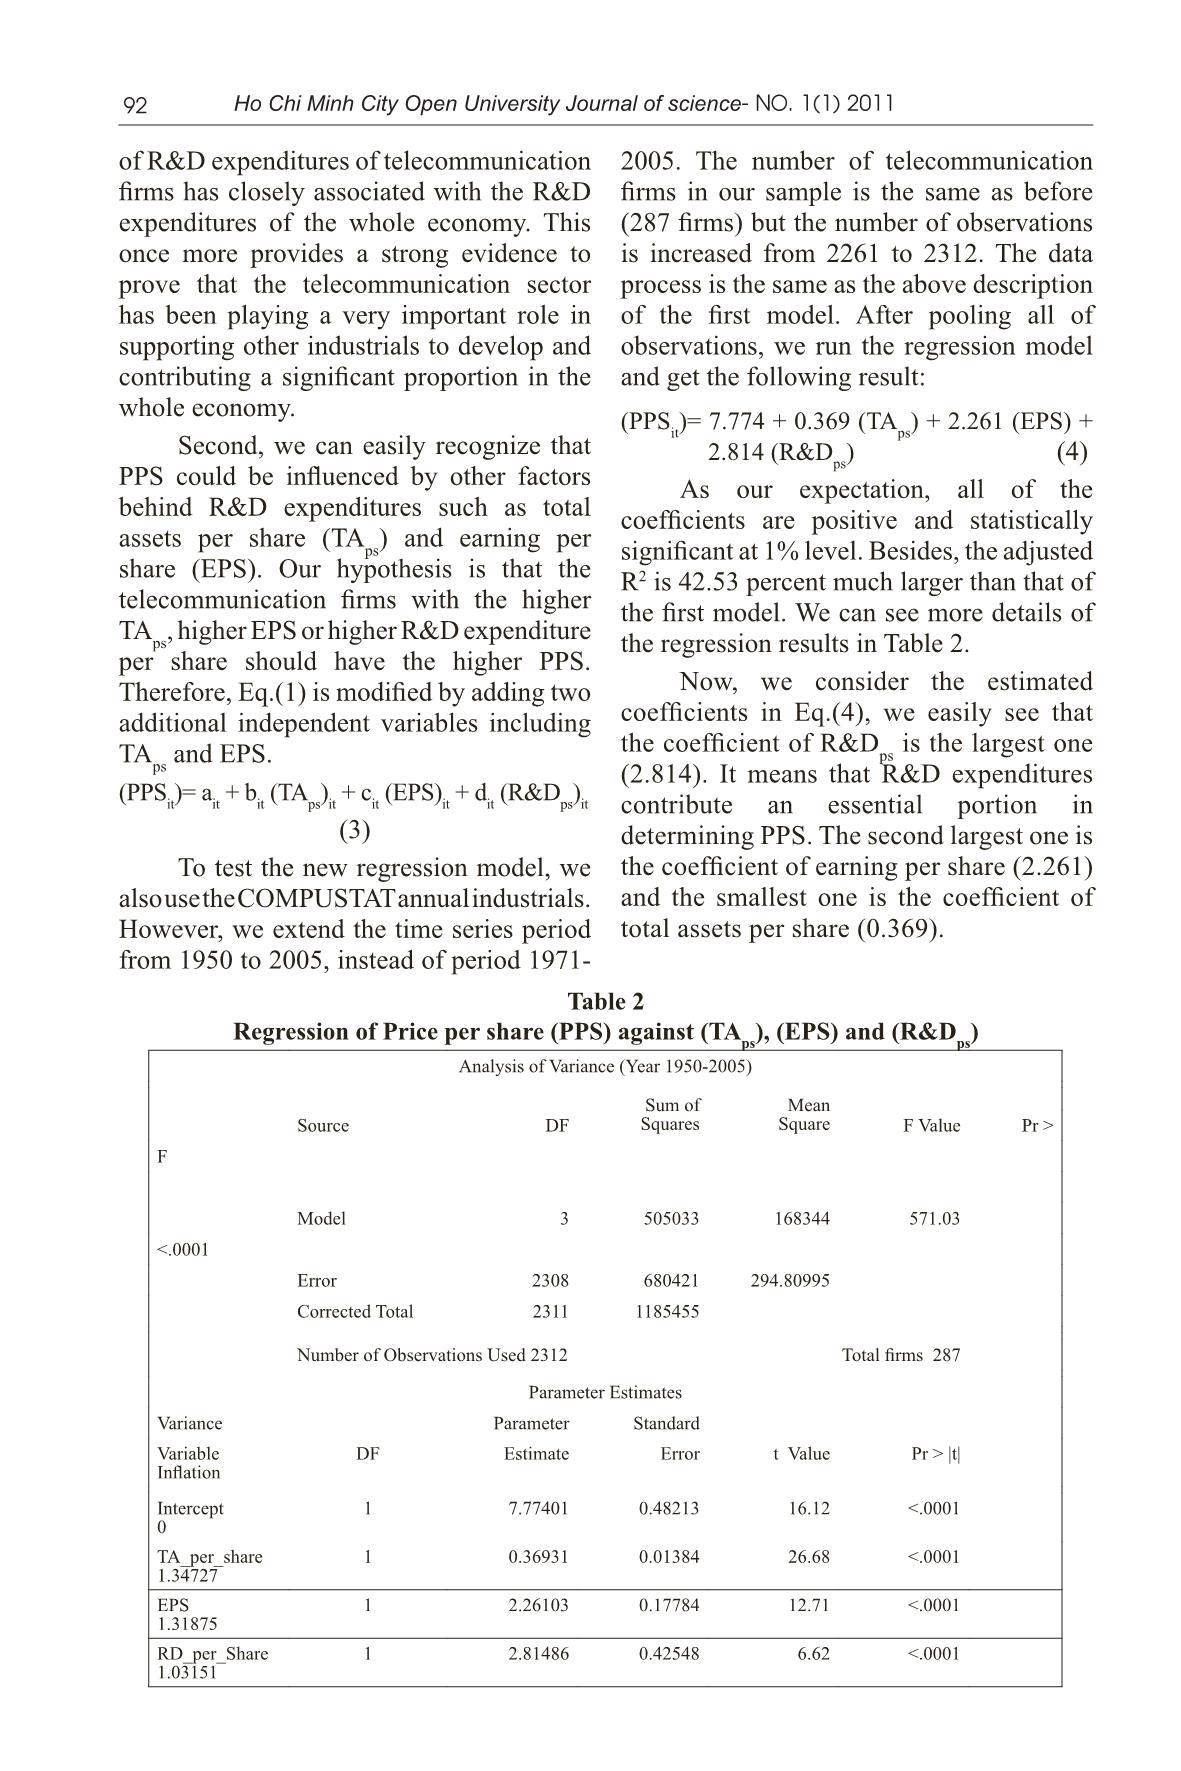
 (PPSit)= 7.774 + 0.369 (TAps) + 2.261 (EPS) +
 Second, we can easily recognize that
 2.814 (R&Dps) (4)
PPS could be influenced by other factors As our expectation, all of the
behind R&D expenditures such as total coefficients are positive and statistically
assets per share (TA ) and earning per
 ps significant at 1% level. Besides, the adjusted
share (EPS). Our hypothesis is that the R2 is 42.53 percent much larger than that of
telecommunication firms with the higher the first model. We can see more details of
TA , higher EPS or higher R&D expenditure
 ps the regression results in Table 2.
per share should have the higher PPS.
Therefore, Eq.(1) is modified by adding two Now, we consider the estimated
additional independent variables including coefficients in Eq.(4), we easily see that
 the coefficient of R&D is the largest one
TA and EPS. ps
 ps (2.814). It means that R&D expenditures
(PPS )= a + b (TA ) + c (EPS) + d (R&D )
 it it it ps it it it it ps it contribute an essential portion in
 (3) determining PPS. The second largest one is
 To test the new regression model, we the coefficient of earning per share (2.261)
also use the COMPUSTAT annual industrials. and the smallest one is the coefficient of
However, we extend the time series period total assets per share (0.369).
from 1950 to 2005, instead of period 1971-
 Table 2
 Regression of Price per share (PPS) against (TAps), (EPS) and (R&Dps)
 Analysis of Variance (Year 1950-2005)
 Sum of Mean
 Source DF Squares Square F Value Pr >
 F
 Model 3 505033 168344 571.03
 <.0001
 Error 2308 680421 294.80995
 Corrected Total 2311 1185455
 Number of Observations Used 2312 Total firms 287
 Parameter Estimates
 Variance Parameter Standard
 Variable DF Estimate Error t Value Pr > |t|
 Inflation
 Intercept 1 7.77401 0.48213 16.12 <.0001
 0
 TA_per_share 1 0.36931 0.01384 26.68 <.0001
 1.34727
 EPS 1 2.26103 0.17784 12.71 <.0001
 1.31875
 RD_per_Share 1 2.81486 0.42548 6.62 <.0001
 1.03151
 Ho Chi Minh City Open University Journal of science- No. 1(1) 2011 93
 IV. Conclusion Research.” Strategic Management
 The role of R&D expenditures Journal 15: 63-84.
contributing to sustain and develop firms’ Joseph P. Ogden, Frank C. Jen and Philip
business objectives has been explored in F. O’Connor (2002), “Advanced
many various aspects. Our major findings Corporate Finance”, Prentice Hall,
include: first, R&D expenditures per share 2002.
are closely positive related to price per Louis K. C. Chan, Josef Lakonishok, and
share in the telecommunication firms. Theodore Sougiannis (2001), “The
This is also consistent with some previous Stock Market Valuation of Research
studies such as Ogden at el (2002). Second, and Development Expenditures”, the
the estimated average of R&D expenditures Journal of finance, Dec/2001.
per share for each year reflects some major
characteristics of the telecommunication Louis K.C. Chan, Josef Lakonishok,
sector during the process of liberalization Theodore Sougiannis (1999), “The
of telecommunication market as well as Stock Market Valuation of Research
the period of emerging IT and developing and Development Expenditures”,
internet era and internet bubble period. Working Paper 7223, NBER, July
Finally, we expand our basic model to 1999.
test two additional independent variables Re-Jin Guo, Baruch Lev and Charles Shi
including total assets per share and earning (2006), “Explaining the Short- and
per share effect on price per share. As a Long-Term IPO Anomalies in the US
result, we find that all of coefficients are by R&D”, Journal of Business Finance
positive associated with price per share as & Accounting, 33(3) & (4), 550–579,
our expectation. In addition, the result once April/May 2006.
more affirms the significant role of R&D S. P. Kothari , Ted E. Laguerre, Andrew J.
expenditures in the firms’ market value, Leone and William E. Simon (2002),
especially in the telecommunication sector. “Capitalization versus Expensing:
 V. References Evidence on the Uncertainty of Future
Baruch Lev and Theodore Sougiannis Earnings from Capital Expenditures
 (1999), “Penetrating the Book-to- versus R&D Outlays”, Review of
 Market Black Box: the R&D Effect”, Accounting Studies, 7, 355–382,
 Journal of Business Finance and 2002.
 Accounting, April/May 1999. Shigeki Sakakibara, Tadanori Yosano,
Wesley M. Cohen, Daniel A. Levinthal, Euichul Jung and Hideo Kozumi
 1990, Absorptive Capacity: A (2006), “Value Relevance of R&D
 New Perspective on Learning and Capital Information: Evidence from
 Innovation, Vol. 35, No. 1, 128-152. Tokyo Stock Exchange”, Discussion
Eli Amir, Yanling Guan and Gilad Livne Paper Series, 2006.
 (2005), “The Association between Quinn, B.J. 2000. Outsourcing Innovation:
 the Uncertainty of Future Economic The New Engine of Growth. Sloan
 Benefits and Current R&D and Management Review 41(14):13-23.
 Capital Expenditures: Industry and Yew Kee Ho, Hean Tat Keh, and Jin Mei
 Intertemporal Analyses”, the seminar Ong (2005), “The Effects of R&D
 at Cardiff University. and Advertising on Firm Value: An
Henderson, R., and I. M. Cockburn. 1994. Examination of Manufacturing and
 “Measuring Competence? Exploring Nonmanufacturing Firms”, IEEE, Vol.
 Firm Effects in Pharmaceutical 52, No.1, Feb/2005.
File đính kèm:
 the_effects_rd_expenditures_on_the_market_value_in_the_telec.pdf

