The effect of non-Performing loans on profitability of commercial banks: Case of Vietnam
Profit always be the top priority of banking operation over the years. Commercial banks maximize the net interest margin by charging more interests to the borrowers and offering lower interests to the depositors. Their aggressive lending strategies can sometimes result in credit risk, moral hazard and non-Performing loans. Some studies found that non-performing loans have negative impact on the bank’s profitability; some argued otherwise. This paper aims at investigating the impact of non-performing loans on the ability to make profit of Vietnamese commercial banks in the period of 2008 to 2017 and draws a conclusion as well as recommendations to mitigate the risk
Trang 1
Trang 2
Trang 3
Trang 4
Trang 5
Trang 6
Trang 7
Trang 8
Trang 9
Trang 10
Tải về để xem bản đầy đủ
Tóm tắt nội dung tài liệu: The effect of non-Performing loans on profitability of commercial banks: Case of Vietnam
al Joint Stock Bank during the period of 2008 to 2013. Some banks only keep the LDR below 100% and
increase it slowly to gain more profit and to avoid a shock in the liquidity pool. For instance, Ho Chi Minh Development
Commercial Joint Stock Bank increased its LDR slowly from 63,99% in 2014 to 86,69% in 2016. Kien Long Joint Stock
Commercial Bank during 2011 to 2017 dropped its LDR from 103.26% to 80.76% in 2015. As the result, its ROA decreased
from 2.21% to 0.65%. After this, the bank pushed back its LDR rate and the ROA slowly recovered.
 382
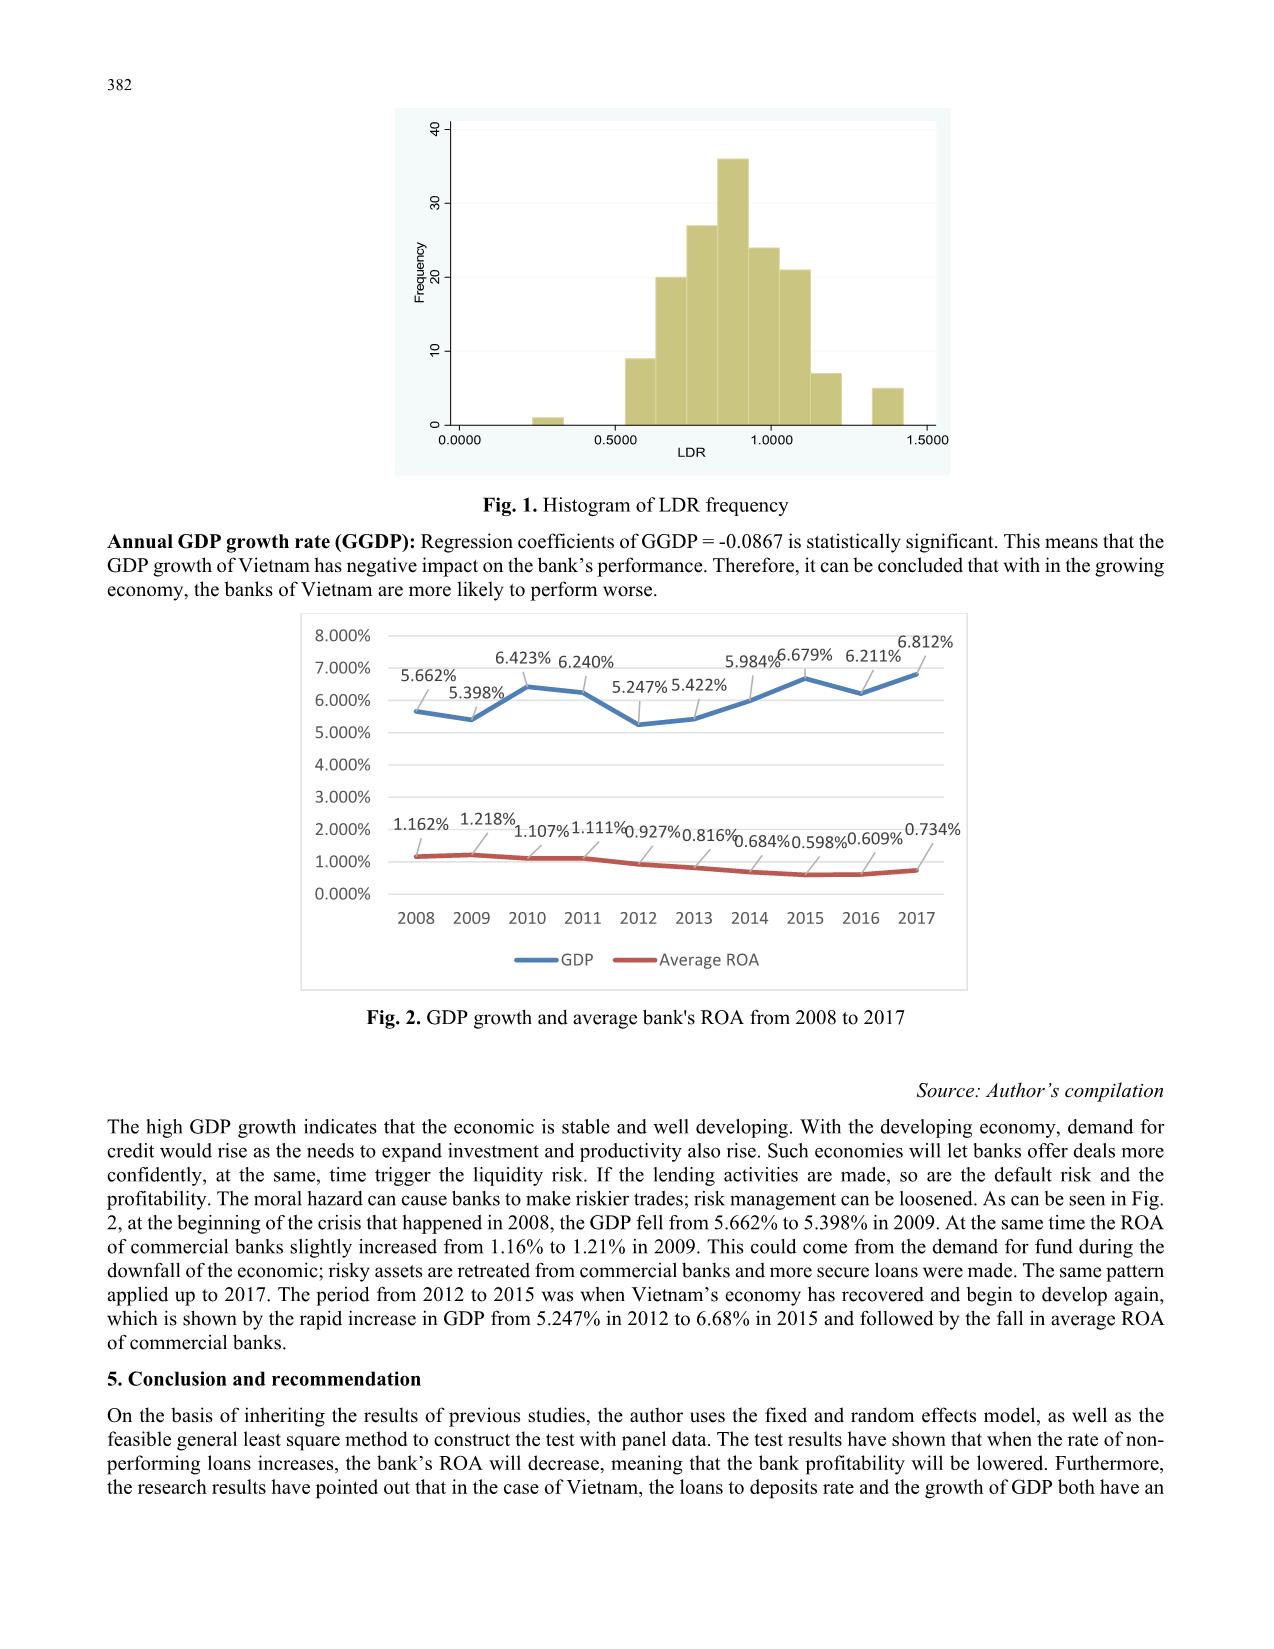
Fig. 1. Histogram of LDR frequency
Annual GDP growth rate (GGDP): Regression coefficients of GGDP = -0.0867 is statistically significant. This means that the
GDP growth of Vietnam has negative impact on the bank’s performance. Therefore, it can be concluded that with in the growing
economy, the banks of Vietnam are more likely to perform worse.
Fig. 2. GDP growth and average bank's ROA from 2008 to 2017
Source: Author’s compilation
The high GDP growth indicates that the economic is stable and well developing. With the developing economy, demand for
credit would rise as the needs to expand investment and productivity also rise. Such economies will let banks offer deals more
confidently, at the same, time trigger the liquidity risk. If the lending activities are made, so are the default risk and the
profitability. The moral hazard can cause banks to make riskier trades; risk management can be loosened. As can be seen in Fig.
2, at the beginning of the crisis that happened in 2008, the GDP fell from 5.662% to 5.398% in 2009. At the same time the ROA
of commercial banks slightly increased from 1.16% to 1.21% in 2009. This could come from the demand for fund during the
downfall of the economic; risky assets are retreated from commercial banks and more secure loans were made. The same pattern
applied up to 2017. The period from 2012 to 2015 was when Vietnam’s economy has recovered and begin to develop again,
which is shown by the rapid increase in GDP from 5.247% in 2012 to 6.68% in 2015 and followed by the fall in average ROA
of commercial banks.
5. Conclusion and recommendation
On the basis of inheriting the results of previous studies, the author uses the fixed and random effects model, as well as the
feasible general least square method to construct the test with panel data. The test results have shown that when the rate of non-
performing loans increases, the bank’s ROA will decrease, meaning that the bank profitability will be lowered. Furthermore,
the research results have pointed out that in the case of Vietnam, the loans to deposits rate and the growth of GDP both have an
0
10
20
30
40
Fr
eq
ue
nc
y
0.0000 0.5000 1.0000 1.5000
LDR
5.662%
5.398%
6.423% 6.240%
5.247% 5.422%
5.984%6.679% 6.211%
6.812%
1.162% 1.218%1.107%1.111%0.927%0.816%0.684%0.598%0.609%
0.734%
0.000%
1.000%
2.000%
3.000%
4.000%
5.000%
6.000%
7.000%
8.000%
2008 2009 2010 2011 2012 2013 2014 2015 2016 2017
GDP Average ROA
H. L. Do et al. /Accounting 6 (2020) 383
impact on the bank’s performance; while the bank size does not matter. Therefore, the authors suggest the following actions in
order to prevent the impact of NPLs on bank’s profitability:
Raising equity: Raising equity contributes to the ability of a bank responding to liquidity crisis and to cover for the bad debt,
which is what the Modern Portfolio Theory recommended. Improving financial capacity such as capital and asset quality will
provide the bank with back up for the unrecovered loans. However, this action needs to be proceeded with caution to avoid
further volatility. In order to increase equity, banks need to develop a balanced policy in the distribution of profit for dividend
payments and retain earnings. Banks need to retain some profits in addition to shareholders’ equity to increase the scale of
capital for future investment. Increasing equity often leads to dilution of the shareholdings. Therefore, bank owners need to
accept this situation in order to expand pool of shareholders, thereby increasing equity to reduce the risk and increase stability.
In addition, diluting the shareholding rate and limiting the concentration of large capital ownership in a small group of
shareholders also promote the development of corporate governance, avoiding bank manipulation and acquisition by dominating
group of shareholders. This unfortunate circumstance can cause great losses to other shareholders and distort the financial
situation of banks.
Appropriate risk managing system: Commercial banks need to complete the Basel II credit risk management framework. A
good credit risk management system must be placed in an appropriate risk environment. The risk management strategy should
clearly identify the level of general risk and the level of credit risk tolerance to be the guideline for the risk management
operation. The bank's credit risk strategy must be developed based on comprehensive assessments, thoroughly understanding of
the bank's business situation and macroeconomic situation. The Board of Directors should be responsible for the final approval
of the credit risk strategy. Credit risk management procedures must also be appropriate. In order to obtain a reasonable credit
risk management process, the bank needs to establish reasonable credit risk criteria, appropriate authority hierarchy, and risk
appetite of the bank. In addition, credit risk management policies coupled with credit growth, high-risk lending such as securities
investments, and real estates need to be regularly reviewed to ensure the compliance with risk management strategies during
each period. Furthermore, the system has to be carefully monitored and frequently evaluated to ensure the effectiveness and to
avoid asymmetric information. This work is required to be carried out regularly by risk management departments and other
independent monitoring departments.
Acknowledgement
This paper has been supported by National Economics University.
References
Abreu, M., & Mendes, V. (2002). Commercial Bank Interest Margins and Profitability.
Andries, A. M. (2011). The determinants of bank efficiency and productivity growth in the Central and Eastern European
banking systems. Eastern European Economics, 49(6), 38-59.
Athanasoglou, P. P., Brissimis, S. N., & Delis, M. D. (2008). Bank-specific, industry-specific and macroeconomic determinants
of bank profitability. Journal of international financial Markets, Institutions and Money, 18(2), 121-136.
Atemkeng, T., & Nzongang, J. (2006). Market structure and profitability performance in the banking industry of CFA countries:
The case of commercial banks in Cameroon. Journal of Sustainable Development in Africa, 8(2), 1-14.
Auronen, L. (2003, May). Asymmetric information: theory and applications. In Seminar of Strategy and International Business
as Helsinki University of Technology.
Banker, R. D., Chang, H., & Lee, S. Y. (2010). Differential impact of Korean banking system reforms on bank
productivity. Journal of Banking & Finance, 34(7), 1450-1460.
Berger, A. N., & DeYoung, R. (1997). Problem loans and cost efficiency in commercial banks. Journal of Banking &
Finance, 21(6), 849-870.
Berger, A. N., & Humphrey, D. B. (1992). Measurement and efficiency issues in commercial banking. In Output measurement
in the service sectors (pp. 245-300). University of Chicago Press.
Bofondi, M., & Gobbi, G. (2004). Bad loans and entry into local credit markets (Vol. 509). Banca d'Italia.
Demirgüç-Kunt, A., & Huizinga, H. (1999). Determinants of commercial bank interest margins and profitability: some
international evidence. The World Bank Economic Review, 13(2), 379-408.
Goudreau, R. E., & Whitehead, D. D. (1989). FYI Commercial Bank Profitability: Improved In 1988. Economic Review-Federal
Reserve Bank of Atlanta, 74(4), 34.
Gwahula, R., & Mnyavanu, W. (2018). Determinants of dividend payout of Commercial Banks Listed at Dar Es Salaam Stock
Exchange (DSE). Account and Financial Management Journal, 3(06), 1571-1580.
Hancock, D. (1989). Bank profitability, deregulation, and the production of financial services (No. 89-16).
Hefferman, S., & Fu, M. (2008). The Determinants of Bank- Performance in China. Ema Working Paper Series No. 032008.
 384
Karim, M. Z. A., Chan, S. G., & Hassan, S. (2010). Bank efficiency and non-performing loans: Evidence from Malaysia and
Singapore. Prague Economic Papers, 2(1), 118-132.
Krakah, A. K., & Ameyaw, A. (2010). Determinants of Bank’s Profitability in Ghana. The Case of Merchant Bank Ghana
Limited (MBG) and Ghana Commercial Bank (GCB), A master‟ s thesis in business administration.
Kwan, S. H., & Eisenbeis, R. A. (1995). An analysis of inefficiencies in banking. Journal of Banking & Finance, 19(3-4), 733-
734.
Markowitz, H. (1952). Portfolio selection. The Journal of Finance, 7(1), 77-91.
Martinho, R., Oliveria, J., & Oliveria, V. (2017). Bank profitability and Macroeconomic factors. Financial stability papers,
Banco de Portugal, Lisbon, August, ISSN, 2183-4059.
Norris, H. (1945). Profit: Accounting theory and economics. Economica, 12(47), 125-133.
Obeid, R., & Adeinat, M. (2017). Determinants of net interest margin: An analytical study on the commercial banks operating
in Jordan (2005-2015). International Journal of Economics and Financial Issues, 7(4), 515-525.
Odufulu, O. (1994). Monetary Policy and Banks’ Profitability in Nigeria. First Bank of Nigeria Plc Bi-Annual Review.
Pagano, M., & Jappelli, T. (1993). Information sharing in credit markets. The journal of finance, 48(5), 1693-1718.
Quang, L. (2015). Determinants of banking crisis: The case of Vietnam. Journal of Science, 4, 64.
Redmond, W. J., & Bohnsack, C. L. (2007). Bank size and profitability: One nation, one bank?. International Journal of
Business Research, 7(1), 162-169.
Symss, J., Saradhi, V. R., & Nehra, P. (2018). Determinants of Non-Performing Assets in Indian Banking Sector. The
Management Accountant Journal, 53(7), 91-98.
Towpek, H., & Borhan, J. T. (2006). Untung dalam sistem perbankan Islam. Islamic Banking and Finance Institute Malaysia
(IBFIM).
Trujillo-Ponce, A. (2013). What determines the profitability of banks? Evidence from Spain. Accounting & Finance, 53(2),
561–586.
Tulsian, M. (2014). Profitability analysis: A comparative study of SAIL & TATA Steel. Journal of Economics and Finance
(IOSR-JEF), 3(2), 19-22.
Uchendu, O.A. (1995). Monetary policy and the performance of commercial banking in Nigeria. Monograph, Research
Department, CBN.
Vinh, N. T. H. (2017). The impact of non-performing loans on bank profitability and lending behavior: Evidence from
Vietnam. Journal of Economic Development, (JED, Vol. 24 (3)), 27-44.
Wheelock, D., & Wilson, P. (1995). Explaining bank failures: Deposit insurance, regulation, and efficiency. Review of
Economics and Statistics, 77, 689–700.
Appendix
List of banks for research data
 Name Code
1 Asia Commercial Joint Stock Bank ACB
2 Joint Stock Commercial Bank for Investment and Development of Vietnam BID
3 Vietnam Export Import Commercial Joint Stock Bank EIB
4 Vietnam Joint Stock Commercial Bank for Industry and Trade CTG
5 Ho Chi Minh Development Commercial Joint Stock Bank HDB
6 Kien Long Commercial Joint Stock Bank KLB
7 National Joint Stock Commercial Bank NVB
8 Joint Stock Commercial Bank of Saigon - Hanoi SHB
9 Saigon Thuong Tin Commercial Joint Stock Bank STB
10 Joint Stock Commercial Bank for Foreign Trade of Vietnam VCB
11 Military Joint Stock Commercial Bank MBB
12 Vietnam International Joint Stock Commercial Bank VIB
13 Vietnam Prosperity Commercial Joint Stock Bank VPB
14 Petrolimex Commercial Joint Stock Bank PGB
15 Tien Phong Commercial Joint Stock Bank TPB
H. L. Do et al. /Accounting 6 (2020) 385
Results from fixed effects model
Results from random effects model
Hausman test
F test that all u_i=0: F(14, 131) = 3.77 Prob > F = 0.0000
 rho .36486287 (fraction of variance due to u_i)
 sigma_e .0047632
 sigma_u .00361019
 _cons .0307258 .0072862 4.22 0.000 .016312 .0451396
 BANKSIZE -.0018635 .0007079 -2.63 0.009 -.0032639 -.0004631
 GGDP -.1059966 .0899528 -1.18 0.241 -.2839448 .0719515
 LDR .0079103 .0027028 2.93 0.004 .0025635 .013257
 NPL -.0458482 .0318621 -1.44 0.153 -.1088791 .0171826
 ROA Coef. Std. Err. t P>|t| [95% Conf. Interval]
corr(u_i, Xb) = -0.4668 Prob > F = 0.0001
 F(4,131) = 6.76
 overall = 0.0540 max = 10
 between = 0.0030 avg = 10.0
 within = 0.1712 min = 10
R-sq: Obs per group:
Group variable: Banks Number of groups = 15
Fixed-effects (within) regression Number of obs = 150
 rho .21627246 (fraction of variance due to u_i)
 sigma_e .0047632
 sigma_u .00250217
 _cons .0248835 .006322 3.94 0.000 .0124927 .0372744
 BANKSIZE -.0008526 .0004943 -1.72 0.085 -.0018214 .0001162
 GGDP -.1781982 .0833829 -2.14 0.033 -.3416257 -.0147707
 LDR .0067517 .0025401 2.66 0.008 .0017732 .0117301
 NPL -.06552 .0307857 -2.13 0.033 -.1258589 -.005181
 ROA Coef. Std. Err. z P>|z| [95% Conf. Interval]
corr(u_i, X) = 0 (assumed) Prob > chi2 = 0.0002
 Wald chi2(4) = 22.25
 overall = 0.0883 max = 10
 between = 0.0000 avg = 10.0
 within = 0.1580 min = 10
R-sq: Obs per group:
Group variable: Banks Number of groups = 15
Random-effects GLS regression Number of obs = 150
 Prob>chi2 = 0.1765
 = 6.32
 chi2(4) = (b-B)'[(V_b-V_B)^(-1)](b-B)
 Test: Ho: difference in coefficients not systematic
 B = inconsistent under Ha, efficient under Ho; obtained from xtreg
 b = consistent under Ho and Ha; obtained from xtreg
 BANKSIZE -.0018635 -.0008526 -.0010109 .0005068
 GGDP -.1059966 -.1781982 .0722016 .0337461
 LDR .0079103 .0067517 .0011586 .0009236
 NPL -.0458482 -.06552 .0196717 .0082117
 fe re Difference S.E.
 (b) (B) (b-B) sqrt(diag(V_b-V_B))
 Coefficients
 386
Feasible General Least Square
© 2020 by the authors; licensee Growing Science, Canada. This is an open access article distributed
under the terms and conditions of the Creative Commons Attribution (CC-BY) license
(
 _cons .0233874 .0060569 3.86 0.000 .0115162 .0352587
 BANKSIZE -.0003036 .0003475 -0.87 0.382 -.0009848 .0003776
 GGDP -.2206235 .086561 -2.55 0.011 -.3902799 -.0509671
 LDR .0046976 .0023861 1.97 0.049 .0000209 .0093744
 NPL -.0867038 .0313899 -2.76 0.006 -.1482269 -.0251808
 ROA Coef. Std. Err. z P>|z| [95% Conf. Interval]
Log likelihood = 573.9505 Prob > chi2 = 0.0017
 Wald chi2(4) = 17.30
Estimated coefficients = 5 Time periods = 10
Estimated autocorrelations = 0 Number of groups = 15
Estimated covariances = 1 Number of obs = 150
Correlation: no autocorrelation
Panels: homoskedastic
Coefficients: generalized least squares
Cross-sectional time-series FGLS regression
File đính kèm:
 the_effect_of_non_performing_loans_on_profitability_of_comme.pdf

