The effect of factors on degree of disclosing accounting information: Evidence from food industry
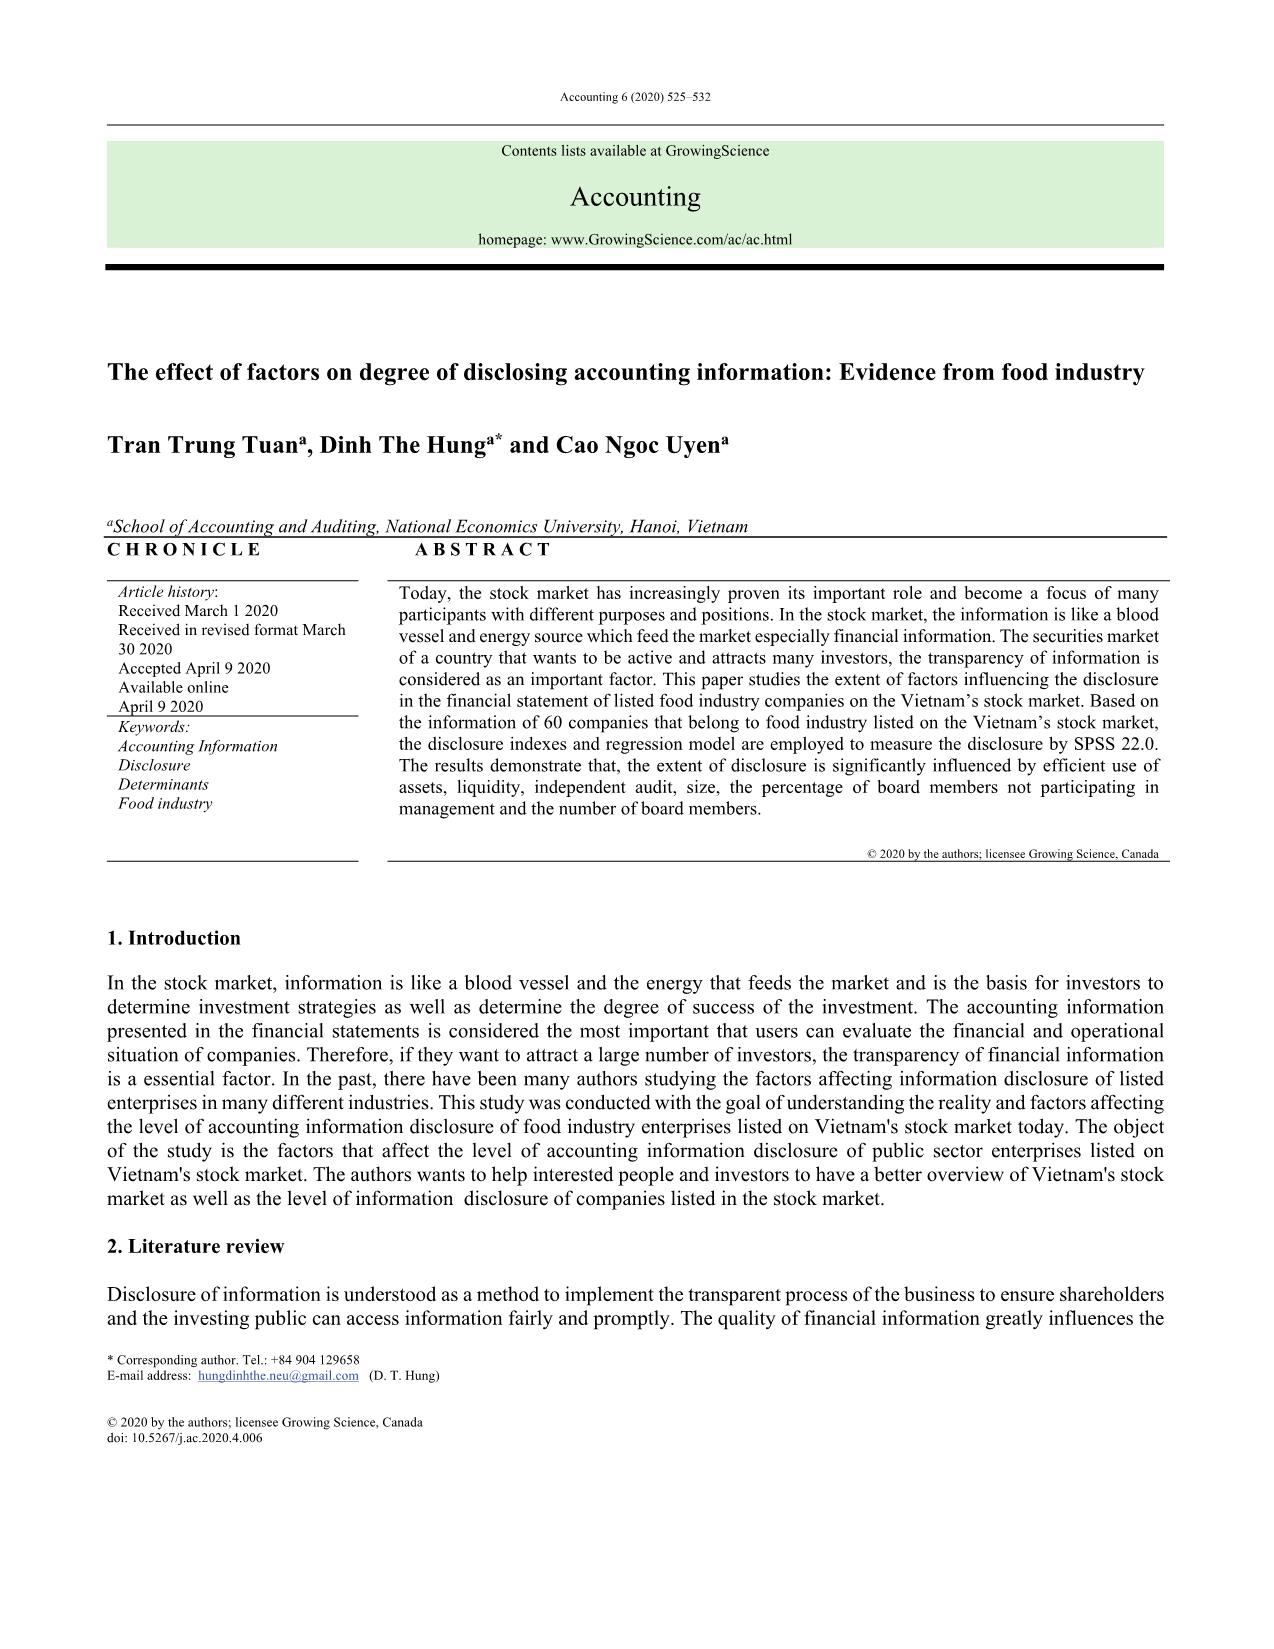
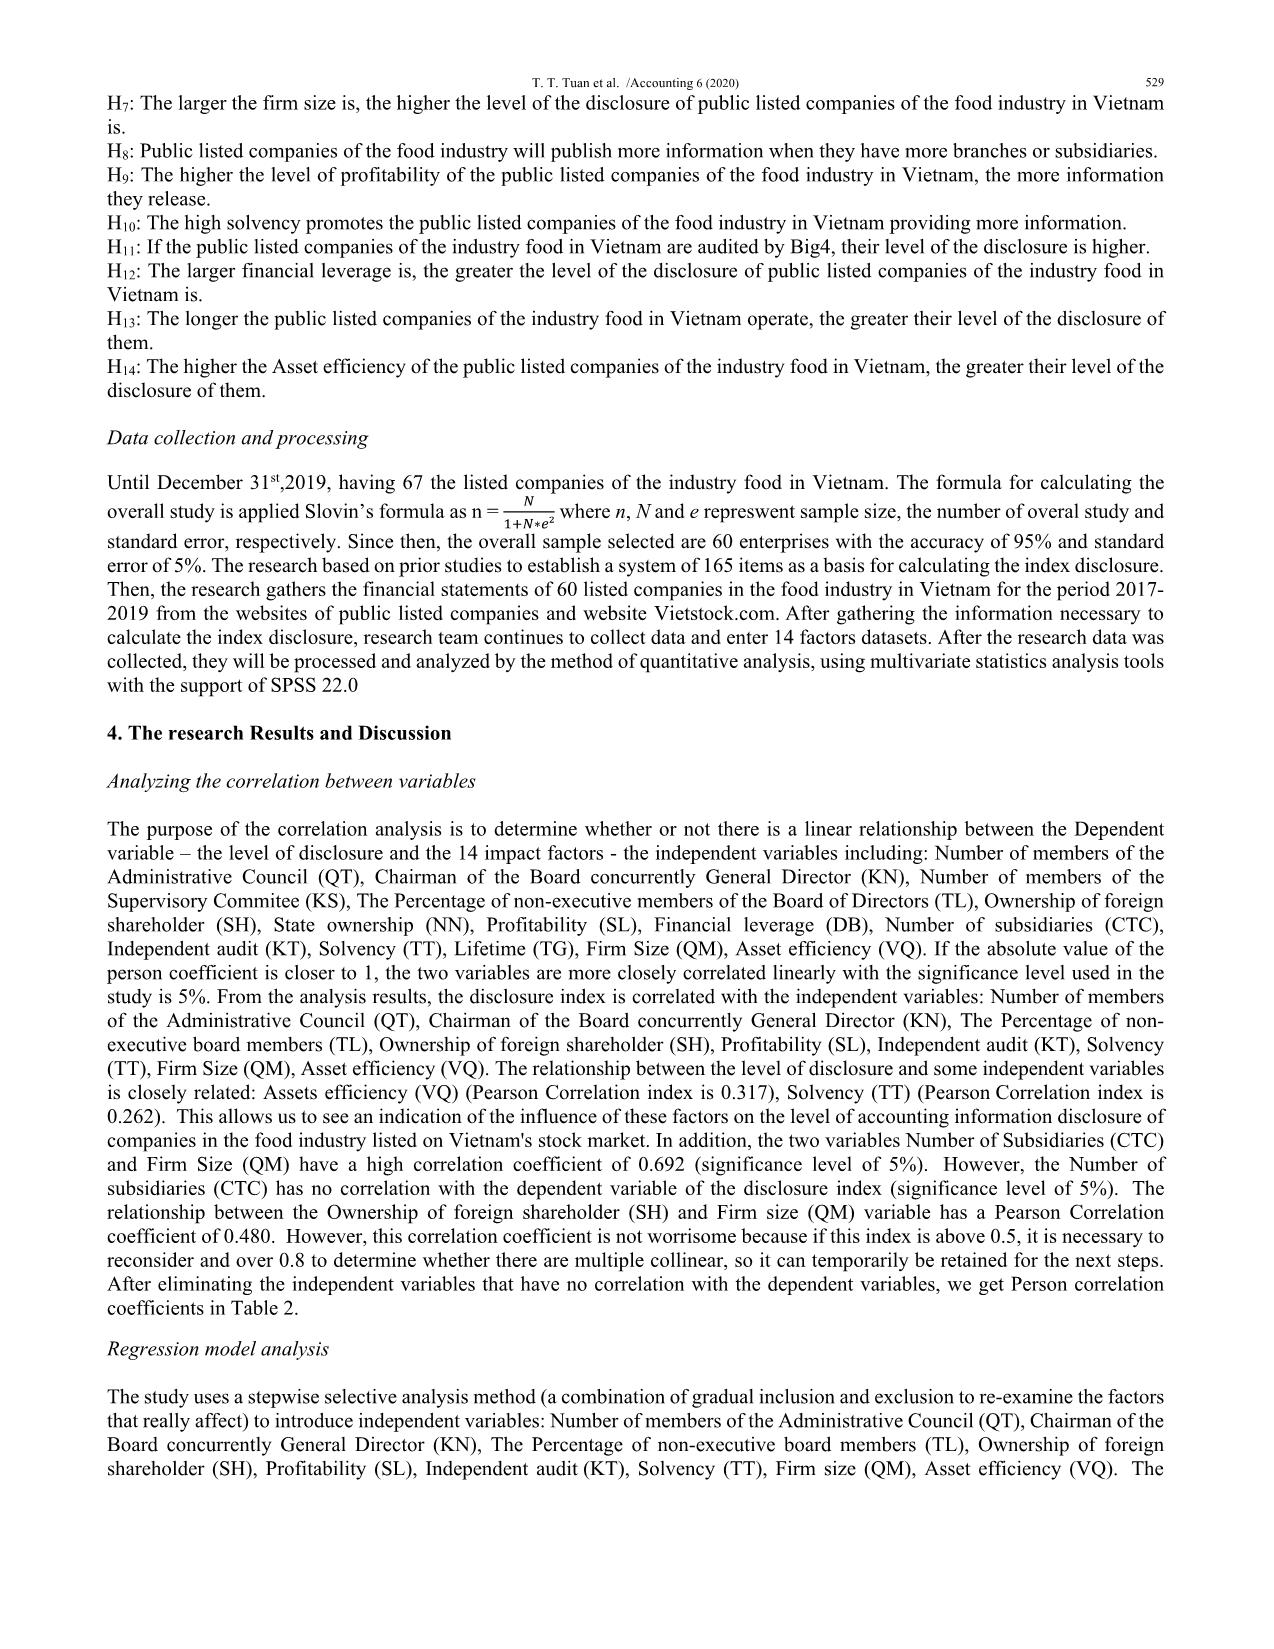
Today, the stock market has increasingly proven its important role and become a focus of many
participants with different purposes and positions. In the stock market, the information is like a blood
vessel and energy source which feed the market especially financial information. The securities market
of a country that wants to be active and attracts many investors, the transparency of information is
considered as an important factor. This paper studies the extent of factors influencing the disclosure
in the financial statement of listed food industry companies on the Vietnam’s stock market. Based on
the information of 60 companies that belong to food industry listed on the Vietnam’s stock market,
the disclosure indexes and regression model are employed to measure the disclosure by SPSS 22.0.
The results demonstrate that, the extent of disclosure is significantly influenced by efficient use of
assets, liquidity, independent audit, size, the percentage of board members not participating in
management and the number of board members
Trang 1
Trang 2
Trang 3
Trang 4
Trang 5
Trang 6
Trang 7
Trang 8
Tóm tắt nội dung tài liệu: The effect of factors on degree of disclosing accounting information: Evidence from food industry
dependent audit (KT), Solvency
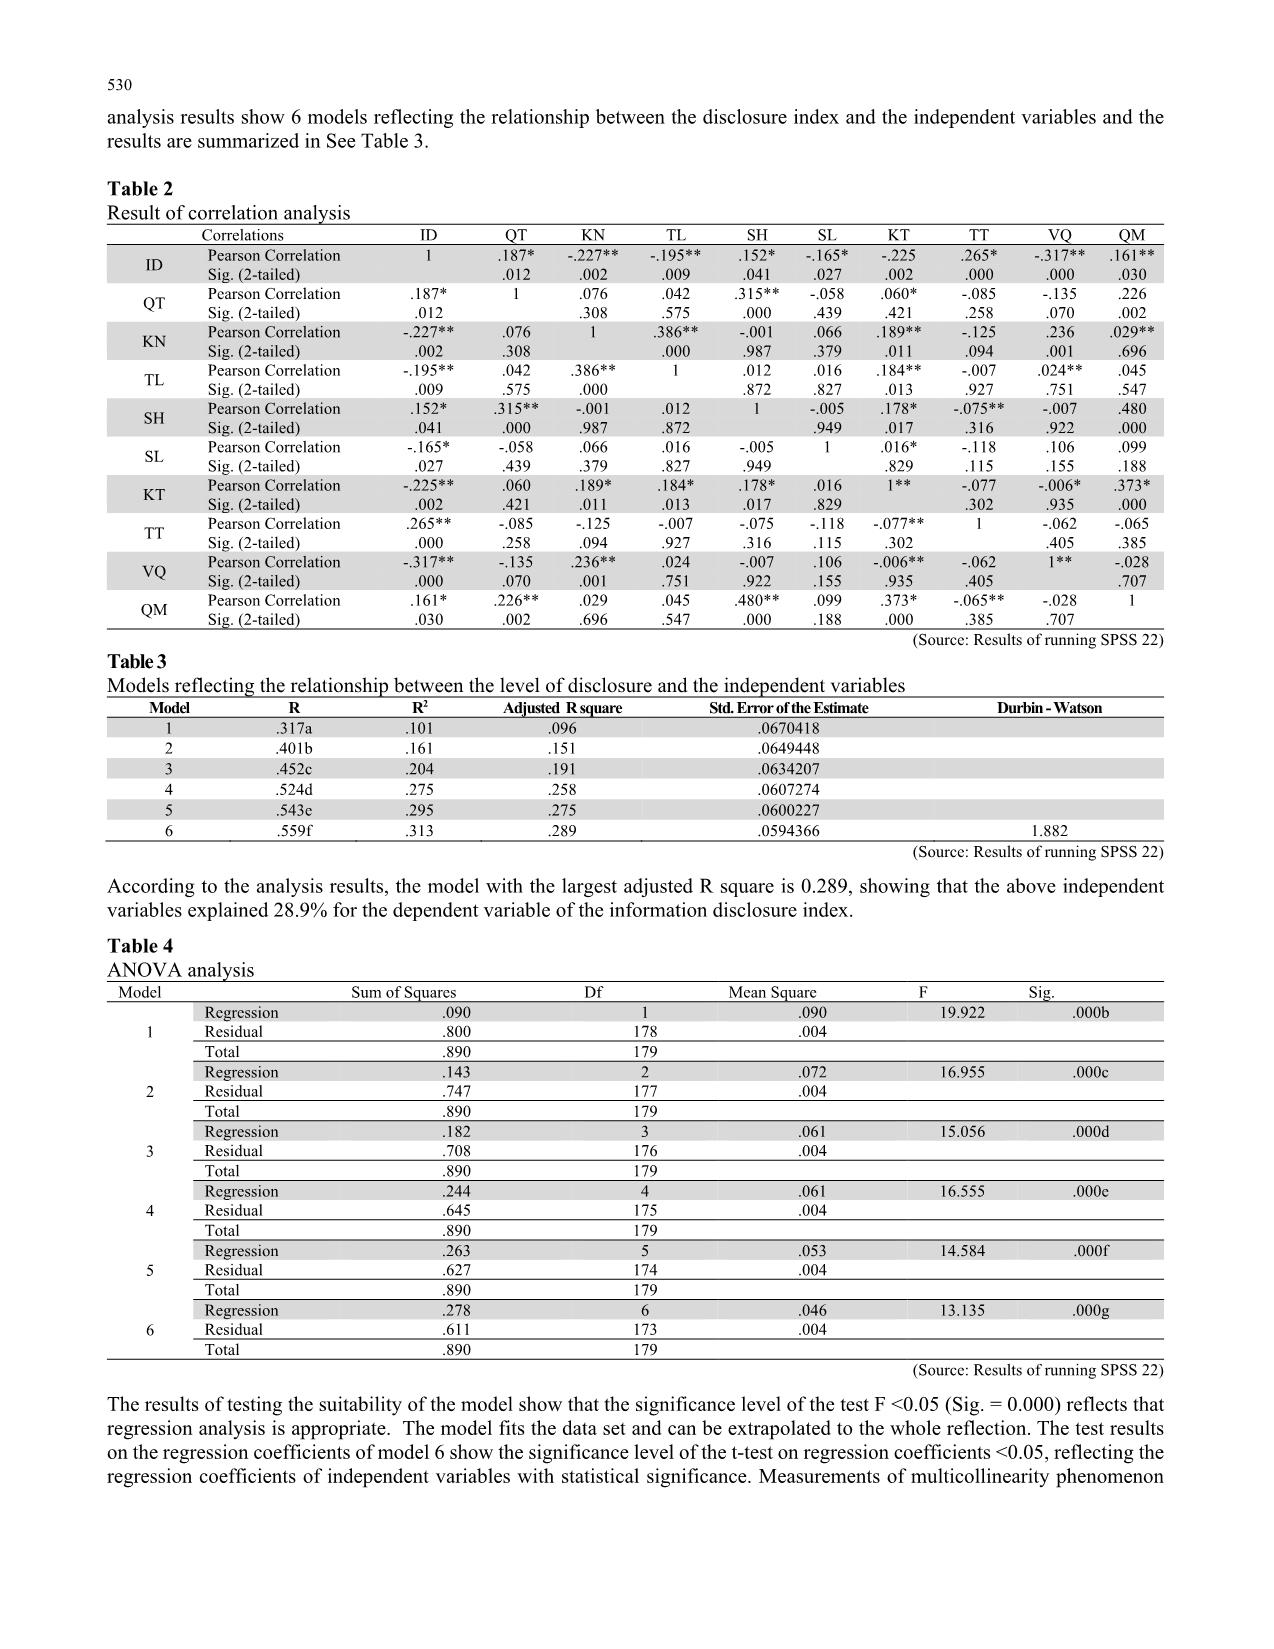
(TT), Firm Size (QM), Asset efficiency (VQ). The relationship between the level of disclosure and some independent variables
is closely related: Assets efficiency (VQ) (Pearson Correlation index is 0.317), Solvency (TT) (Pearson Correlation index is
0.262). This allows us to see an indication of the influence of these factors on the level of accounting information disclosure of
companies in the food industry listed on Vietnam's stock market. In addition, the two variables Number of Subsidiaries (CTC)
and Firm Size (QM) have a high correlation coefficient of 0.692 (significance level of 5%). However, the Number of
subsidiaries (CTC) has no correlation with the dependent variable of the disclosure index (significance level of 5%). The
relationship between the Ownership of foreign shareholder (SH) and Firm size (QM) variable has a Pearson Correlation
coefficient of 0.480. However, this correlation coefficient is not worrisome because if this index is above 0.5, it is necessary to
reconsider and over 0.8 to determine whether there are multiple collinear, so it can temporarily be retained for the next steps.
After eliminating the independent variables that have no correlation with the dependent variables, we get Person correlation
coefficients in Table 2.
Regression model analysis
The study uses a stepwise selective analysis method (a combination of gradual inclusion and exclusion to re-examine the factors
that really affect) to introduce independent variables: Number of members of the Administrative Council (QT), Chairman of the
Board concurrently General Director (KN), The Percentage of non-executive board members (TL), Ownership of foreign
shareholder (SH), Profitability (SL), Independent audit (KT), Solvency (TT), Firm size (QM), Asset efficiency (VQ). The
 530
analysis results show 6 models reflecting the relationship between the disclosure index and the independent variables and the
results are summarized in See Table 3.
Table 2
Result of correlation analysis
Correlations ID QT KN TL SH SL KT TT VQ QM
ID Pearson Correlation 1 .187* -.227** -.195** .152* -.165* -.225 .265* -.317** .161** Sig. (2-tailed) .012 .002 .009 .041 .027 .002 .000 .000 .030
QT Pearson Correlation .187* 1 .076 .042 .315** -.058 .060* -.085 -.135 .226 Sig. (2-tailed) .012 .308 .575 .000 .439 .421 .258 .070 .002
KN Pearson Correlation -.227** .076 1 .386** -.001 .066 .189** -.125 .236 .029** Sig. (2-tailed) .002 .308 .000 .987 .379 .011 .094 .001 .696
TL Pearson Correlation -.195** .042 .386** 1 .012 .016 .184** -.007 .024** .045 Sig. (2-tailed) .009 .575 .000 .872 .827 .013 .927 .751 .547
SH Pearson Correlation .152* .315** -.001 .012 1 -.005 .178* -.075** -.007 .480 Sig. (2-tailed) .041 .000 .987 .872 .949 .017 .316 .922 .000
SL Pearson Correlation -.165* -.058 .066 .016 -.005 1 .016* -.118 .106 .099 Sig. (2-tailed) .027 .439 .379 .827 .949 .829 .115 .155 .188
KT Pearson Correlation -.225** .060 .189* .184* .178* .016 1** -.077 -.006* .373* Sig. (2-tailed) .002 .421 .011 .013 .017 .829 .302 .935 .000
TT Pearson Correlation .265** -.085 -.125 -.007 -.075 -.118 -.077** 1 -.062 -.065 Sig. (2-tailed) .000 .258 .094 .927 .316 .115 .302 .405 .385
VQ Pearson Correlation -.317** -.135 .236** .024 -.007 .106 -.006** -.062 1** -.028 Sig. (2-tailed) .000 .070 .001 .751 .922 .155 .935 .405 .707
QM Pearson Correlation .161* .226** .029 .045 .480** .099 .373* -.065** -.028 1 Sig. (2-tailed) .030 .002 .696 .547 .000 .188 .000 .385 .707
(Source: Results of running SPSS 22)
Table 3
Models reflecting the relationship between the level of disclosure and the independent variables
Model R R2 Adjusted R square Std. Error of the Estimate Durbin - Watson
1 .317a .101 .096 .0670418
2 .401b .161 .151 .0649448
3 .452c .204 .191 .0634207
4 .524d .275 .258 .0607274
5 .543e .295 .275 .0600227
6 .559f .313 .289 .0594366 1.882
(Source: Results of running SPSS 22)
According to the analysis results, the model with the largest adjusted R square is 0.289, showing that the above independent
variables explained 28.9% for the dependent variable of the information disclosure index.
Table 4
ANOVA analysis
Model Sum of Squares Df Mean Square F Sig.
1
Regression .090 1 .090 19.922 .000b
Residual .800 178 .004
Total .890 179
2
Regression .143 2 .072 16.955 .000c
Residual .747 177 .004
Total .890 179
3
Regression .182 3 .061 15.056 .000d
Residual .708 176 .004
Total .890 179
4
Regression .244 4 .061 16.555 .000e
Residual .645 175 .004
Total .890 179
5
Regression .263 5 .053 14.584 .000f
Residual .627 174 .004
Total .890 179
6
Regression .278 6 .046 13.135 .000g
Residual .611 173 .004
Total .890 179
(Source: Results of running SPSS 22)
The results of testing the suitability of the model show that the significance level of the test F <0.05 (Sig. = 0.000) reflects that
regression analysis is appropriate. The model fits the data set and can be extrapolated to the whole reflection. The test results
on the regression coefficients of model 6 show the significance level of the t-test on regression coefficients <0.05, reflecting the
regression coefficients of independent variables with statistical significance. Measurements of multicollinearity phenomenon
T. T. Tuan et al. /Accounting 6 (2020) 531
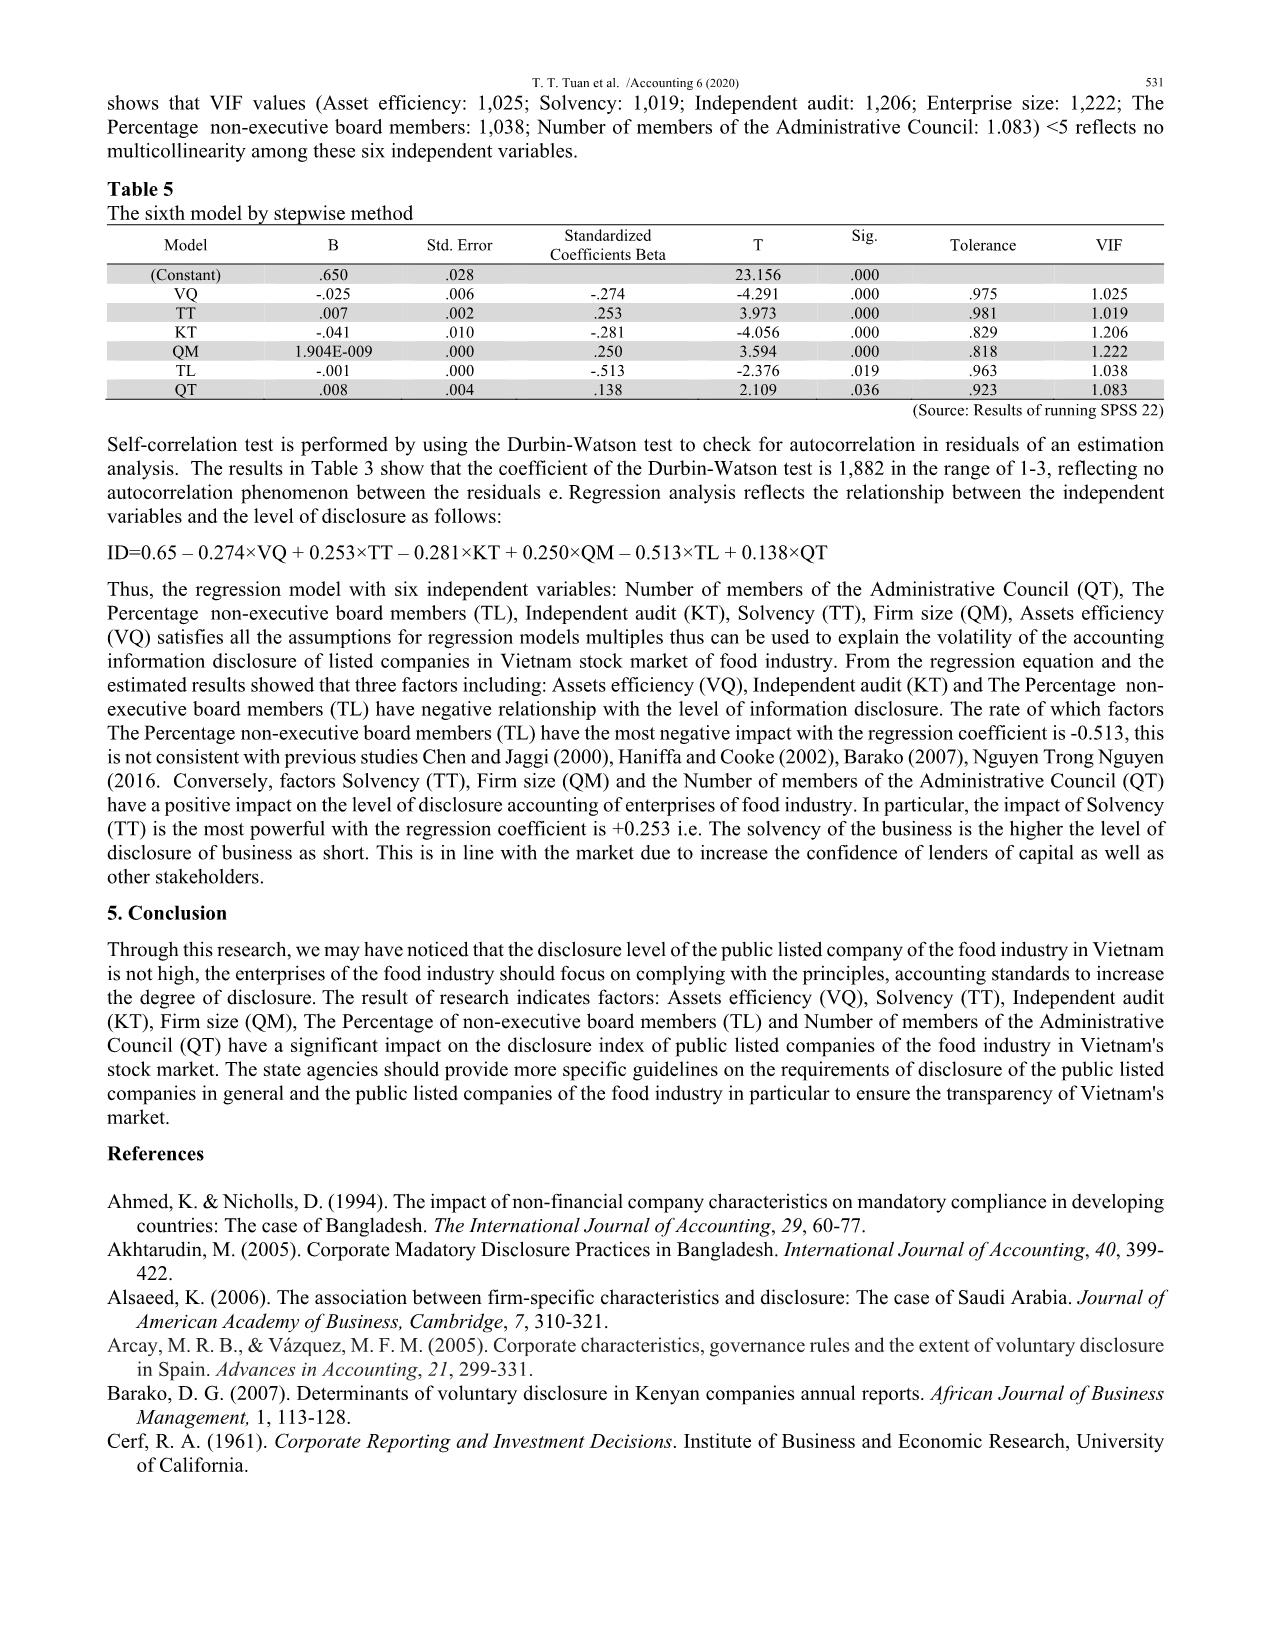
shows that VIF values (Asset efficiency: 1,025; Solvency: 1,019; Independent audit: 1,206; Enterprise size: 1,222; The
Percentage non-executive board members: 1,038; Number of members of the Administrative Council: 1.083) <5 reflects no
multicollinearity among these six independent variables.
Table 5
The sixth model by stepwise method
Model B Std. Error Standardized Coefficients Beta T
Sig.
 Tolerance VIF
(Constant) .650 .028 23.156 .000
VQ -.025 .006 -.274 -4.291 .000 .975 1.025
TT .007 .002 .253 3.973 .000 .981 1.019
KT -.041 .010 -.281 -4.056 .000 .829 1.206
QM 1.904E-009 .000 .250 3.594 .000 .818 1.222
TL -.001 .000 -.513 -2.376 .019 .963 1.038
QT .008 .004 .138 2.109 .036 .923 1.083
(Source: Results of running SPSS 22)
Self-correlation test is performed by using the Durbin-Watson test to check for autocorrelation in residuals of an estimation
analysis. The results in Table 3 show that the coefficient of the Durbin-Watson test is 1,882 in the range of 1-3, reflecting no
autocorrelation phenomenon between the residuals e. Regression analysis reflects the relationship between the independent
variables and the level of disclosure as follows:
ID=0.65 – 0.274×VQ + 0.253×TT – 0.281×KT + 0.250×QM – 0.513×TL + 0.138×QT
Thus, the regression model with six independent variables: Number of members of the Administrative Council (QT), The
Percentage non-executive board members (TL), Independent audit (KT), Solvency (TT), Firm size (QM), Assets efficiency
(VQ) satisfies all the assumptions for regression models multiples thus can be used to explain the volatility of the accounting
information disclosure of listed companies in Vietnam stock market of food industry. From the regression equation and the
estimated results showed that three factors including: Assets efficiency (VQ), Independent audit (KT) and The Percentage non-
executive board members (TL) have negative relationship with the level of information disclosure. The rate of which factors
The Percentage non-executive board members (TL) have the most negative impact with the regression coefficient is -0.513, this
is not consistent with previous studies Chen and Jaggi (2000), Haniffa and Cooke (2002), Barako (2007), Nguyen Trong Nguyen
(2016. Conversely, factors Solvency (TT), Firm size (QM) and the Number of members of the Administrative Council (QT)
have a positive impact on the level of disclosure accounting of enterprises of food industry. In particular, the impact of Solvency
(TT) is the most powerful with the regression coefficient is +0.253 i.e. The solvency of the business is the higher the level of
disclosure of business as short. This is in line with the market due to increase the confidence of lenders of capital as well as
other stakeholders.
5. Conclusion
Through this research, we may have noticed that the disclosure level of the public listed company of the food industry in Vietnam
is not high, the enterprises of the food industry should focus on complying with the principles, accounting standards to increase
the degree of disclosure. The result of research indicates factors: Assets efficiency (VQ), Solvency (TT), Independent audit
(KT), Firm size (QM), The Percentage of non-executive board members (TL) and Number of members of the Administrative
Council (QT) have a significant impact on the disclosure index of public listed companies of the food industry in Vietnam's
stock market. The state agencies should provide more specific guidelines on the requirements of disclosure of the public listed
companies in general and the public listed companies of the food industry in particular to ensure the transparency of Vietnam's
market.
References
Ahmed, K. & Nicholls, D. (1994). The impact of non-financial company characteristics on mandatory compliance in developing
countries: The case of Bangladesh. The International Journal of Accounting, 29, 60-77.
Akhtarudin, M. (2005). Corporate Madatory Disclosure Practices in Bangladesh. International Journal of Accounting, 40, 399-
422.
Alsaeed, K. (2006). The association between firm-specific characteristics and disclosure: The case of Saudi Arabia. Journal of
American Academy of Business, Cambridge, 7, 310-321.
Arcay, M. R. B., & Vázquez, M. F. M. (2005). Corporate characteristics, governance rules and the extent of voluntary disclosure
in Spain. Advances in Accounting, 21, 299-331.
Barako, D. G. (2007). Determinants of voluntary disclosure in Kenyan companies annual reports. African Journal of Business
Management, 1, 113-128.
Cerf, R. A. (1961). Corporate Reporting and Investment Decisions. Institute of Business and Economic Research, University
of California.
 532
Chen, C., & Courtenay, M. (2006). Board composition, regulatory regime and voluntary disclosure. The International Journal
of Accounting, 41, 262-289.
Cheung, S. Y. L., Connelly, J. T., & Limpaphayom, P. (2007). Determinants of corporate disclosure and transparency: Evidence
from Hong Kong and Thailand. International Corporate Responsibility Series, 3, 313-342.
Cooke, T. E. (1989). Disclosure in the corporate annual report of Swedish companies, Accounting and Business Research, 19,
113.
Cooke, T. E. (1992). The impact of size, Stock Market Listing and Industry Type on Disclosure in the Annual Reports of
Japanese Listed Corporations. Accounting and Business Research, 22, 229.
Courtis, J. K. (1978). Annual report disclosure in New Zealand: Analysis of selected corporate attribute.
Deangelo, L. E. (1981). Auditor Independence “Low Balling” an Disclosure Regulation. Journal of Accounting and Economics,
3, 111-179.
Dang Thi Bich Ngoc. (2018). Research published accounting information of companies listed on Vietnam's stock market.
Doctoral thesis. Financial institutions.
Doan nguyen trang phuong (2010). Factors affecting the level of information disclosure of companies listed on Vietnam's stock
market. 35 years of development and integration of the University of Economics, University of Danang. Da Nang University
of Economics.
Fama, E. F. & Jensen, M. C. (1983). Agency Problems and Residual Claims. Journal of Law and Economics, 26, 327-349.
Firth, M. (1979). Impact of size, stock market listing and auditors on voluntary disclosure in corporate annual reports.
Accounting and Business Research, 9, 273-280.
Sui, F. W. (2001). Accounting System and Information Disclosure. KPMG, Shanghai.
Franks, J., Mayer, C., & Renneboog, L. (2001). Who disciplines management in poorly performing companies?. Journal of
Financial Intermediation, 10(3-4), 209-248.
Haniffa, R. M., & Cooke, T. E. (2002). Culture, corporate governance and disclosure in Malaysian corporations. Abacus, 38(3),
317-349.
Lakhal, F. (2005). Voluntary earnings disclosures and corporate governance: Evidence from France. Review of Accounting and
Finance, 4, 64-85.
Le Thi My Hanh (2015). Transparent financial information of the Company listed on the stock market of Vietnam. Doctoral
thesis. University of Economics Ho Chi Minh City.
Le Thi Truc Loan (2012). The study of the level of risk disclosure in the annual report of the petroleum enterprises listed on the
Hochiminh City Stock Exchange. Da Nang University of Economics.
Malone, D., Fries, C. & Jones, T. (1993). An empirical investigation of the extent of corporate financial disclosure in the oil and
gas industry. Journal of Accounting, Auditing & Finance, 8, 249.
Marston, C. & Polei, A. (2004). Corporate Reporting on The Internet by German Companies. International Journal of
Accounting Information Systems, 5, 285-311.
Mcmulen, D. A. (1996). Audit committee performance: an investigation of the consequences associated with audit committee.
Auditing: A Journal of Practice & Theory, 15, 87-96,98,100-103.
Nguyen Cong Phuong, Vo Hong Tam, Huynh Ngoc Quang & Vo Thi Thuy Trang. (2012). Research Disclosure of information
in financial statements of companies listed on the Ho Chi Minh City Stock Exchange, Economics University Danang.
Nguyen Huu Cuong & Le Thi Ngoc Bao. (2018). The study of factors affecting the level of disclosure of the consumer sector
enterprises listed on Vietnam's stock market. Economic Research. Vietnam Institute of Economics 4/2018, No. 4 (479), 33-
41.
Nguyen Thi Thanh Phuong (2012). Analysis of the factors affecting the level of disclosure of information in the financial
statements of enterprises listed in the Ho Chi Minh Stock Exchange. Master thesis. The University of Danang.
Nguyen Trong Nguyen (2015). The impact of corporate governance on the quality of information in the financial statements of
listed companies in Vietnam. Doctoral thesis. University of Economics, Ho Chi Minh City.
Singhvi, S. S., & Desai, H. B. (1971). An empirical analysis of the quality of corporate financial disclosure. The Accounting
Review, 46(1), 129-138.
Urquiza, F. B., Navarro, M. C. A., & Trombetta, M. (2009). Disclosure indices design: does it make a difference?. Revista de
Contabilidad-Spanish Accounting Review, 12(2), 253-278.
Wallace, R. S. & Naser, K. 1995. Firm specific determinants of comprehensive of mandatory disclosure in the corporate annual
reports of firms listed on the stock exchange of Hong Kong. Journal of Accounting and Public Policy, 14, 311-368.
© 2020 by the authors; licensee Growing Science, Canada. This is an open access article distributed
under the terms and conditions of the Creative Commons Attribution (CC-BY) license
(
File đính kèm:
 the_effect_of_factors_on_degree_of_disclosing_accounting_inf.pdf

