Simulation of atmospheric radiocesium (¹³⁷Cs) from Fukushima nuclear accident using FLEXPART-WRF driven by ERA5 reanalysis data
This study investigates short-range atmospheric transport of radiocesium (137Cs) after
Fukushima nuclear accident using the Weather Research and Forecasting (WRF) model and the
Lagrangian particle dispersion FLEXPART-WRF model. The most up-to-date ERA5 reanalysis
dataset is used as initial and boundary condition for the WRF model for every hour. Four experiments
were carried out to examine the sensitivity of simulation results to micro-physics parameterizations in
the WRF model with two configured domains of 5 km and 1 km horizontal resolution. Compared with
observation at Futaba and Naraha station, all experiments reproduce reasonably the variation of 137Cs
concentration from 11/03 to 26/03/2011. Statistical verification as shown in Taylor diagrams
highlights noticeable sensitivity of simulation results to different micro-physics choices. Three
configurations of the WRF model are also recommended for further study based on their better
performance among all.
Trang 1
Trang 2
Trang 3
Trang 4
Trang 5
Trang 6
Trang 7
Trang 8
Trang 9
Trang 10
Tải về để xem bản đầy đủ
Tóm tắt nội dung tài liệu: Simulation of atmospheric radiocesium (¹³⁷Cs) from Fukushima nuclear accident using FLEXPART-WRF driven by ERA5 reanalysis data
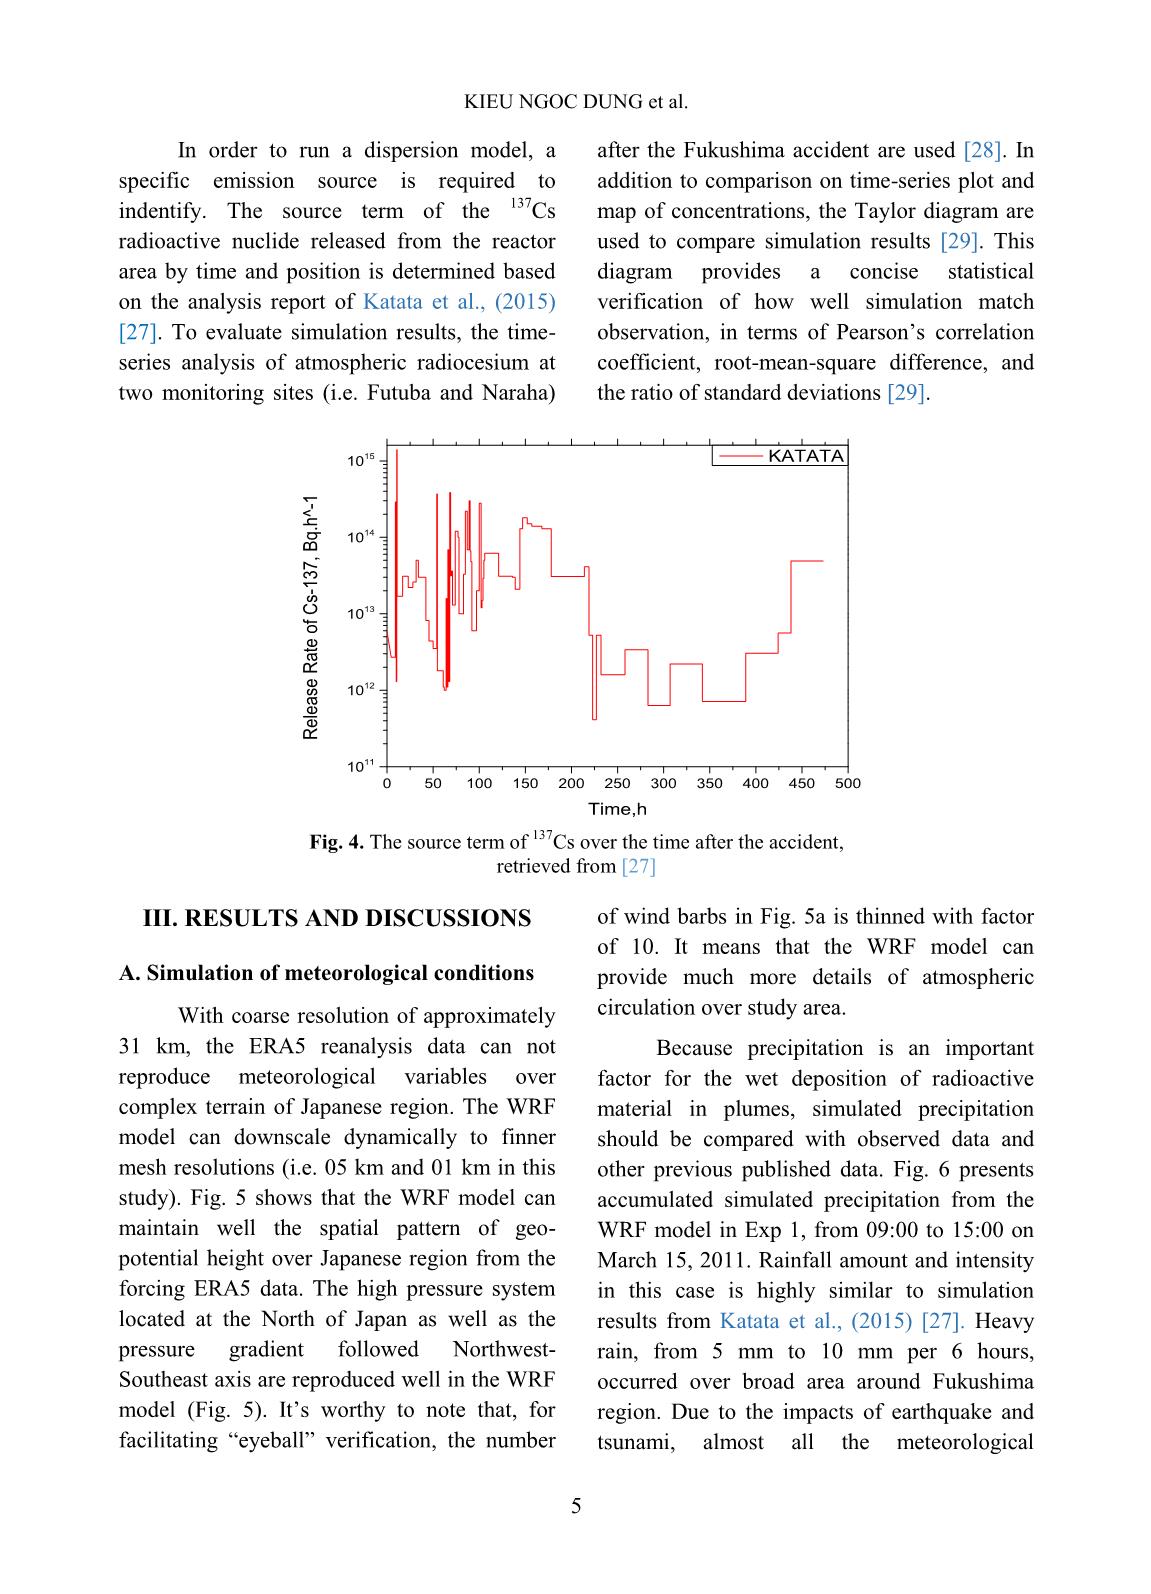
 results from Katata et al., (2015) [27]. Heavy
pressure gradient followed Northwest- rain, from 5 mm to 10 mm per 6 hours,
Southeast axis are reproduced well in the WRF occurred over broad area around Fukushima
model (Fig. 5). It’s worthy to note that, for region. Due to the impacts of earthquake and
facilitating “eyeball” verification, the number tsunami, almost all the meteorological
 5
SIMULATION OF ATMOSPHERIC RADIOCESIUM (137Cs) FROM FUKUSHIMA NUCLEAR ACCIDENT
observation equipments were inoperable after research groups such as Kinoshita et al., (2011)
the nuclear accident. Therefore, it’s difficult to [30], Stohl et al., (2012) [10] and Sugiyama et
obtain good quality meteorological observation al., (2012) [31]. In fact, rain occured over the
in this case. Large-scale meteorological north area of Fukushima prefecture from 17:00
information during the occurrence of JST March 15 to 04:00 JST on the March 16
radioactive material emissions into the air was [30]. On the 20 to 22 March, sustainable low
presented in the 2013 World Meteorological pressure caused moderate rainfall in the
Organization (WMO) report by previous vicinity of Tokyo.
 (a) (b)
Fig. 5. Simulation of geo-potential height (shaded color) and wind field (barbs) on level of 850 mb, at 12h00
 UTC 15/03/2011 from the WRF model in Exp 1 (a), in comparison with the ERA5 reanalysis data (b).
 Notice: Factor of 10 is applied to thin the number of wind barbs in (a)
Fig. 6. Accumulated simulated precipitation from the WRF model in experiment Exp 1, from 09:00 to 15:00
 on March 15, 2011
 6
 KIEU NGOC DUNG et al.
B. Evaluation of atmospheric radiocesium resolution. In this paper, high resolution of
 The Futaba station, an observatory 01 km is very suitable for considering the
station in the town of Futaba, is very close to geographical location of Futaba station, as
the Fukushima NPP. The distance between well as other neighboring stations (e.g.
Futaba town and the plant is only about 3.2 Naraha station). Calculation results of the
km, where was severely affected by both concentration of atmospheric radiocesium
 137
earthquakes, tsunamis and the effects of Cs for every hour at Futaba and Naraha
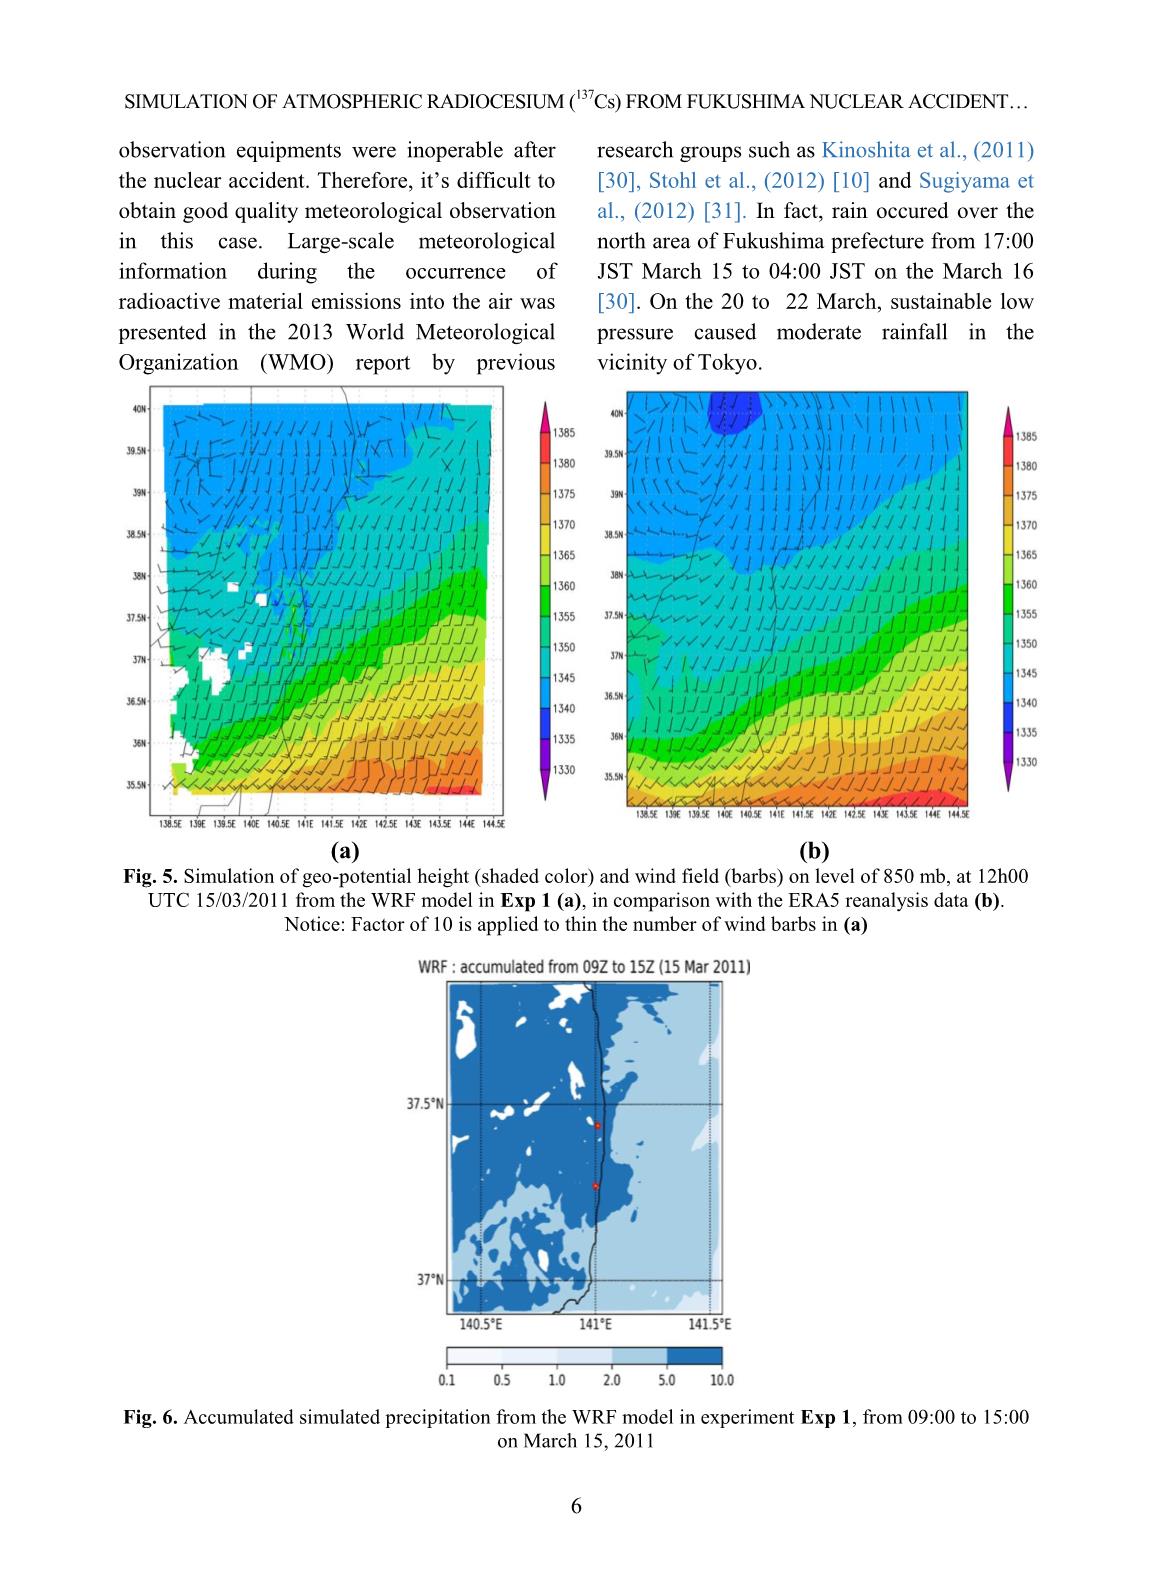
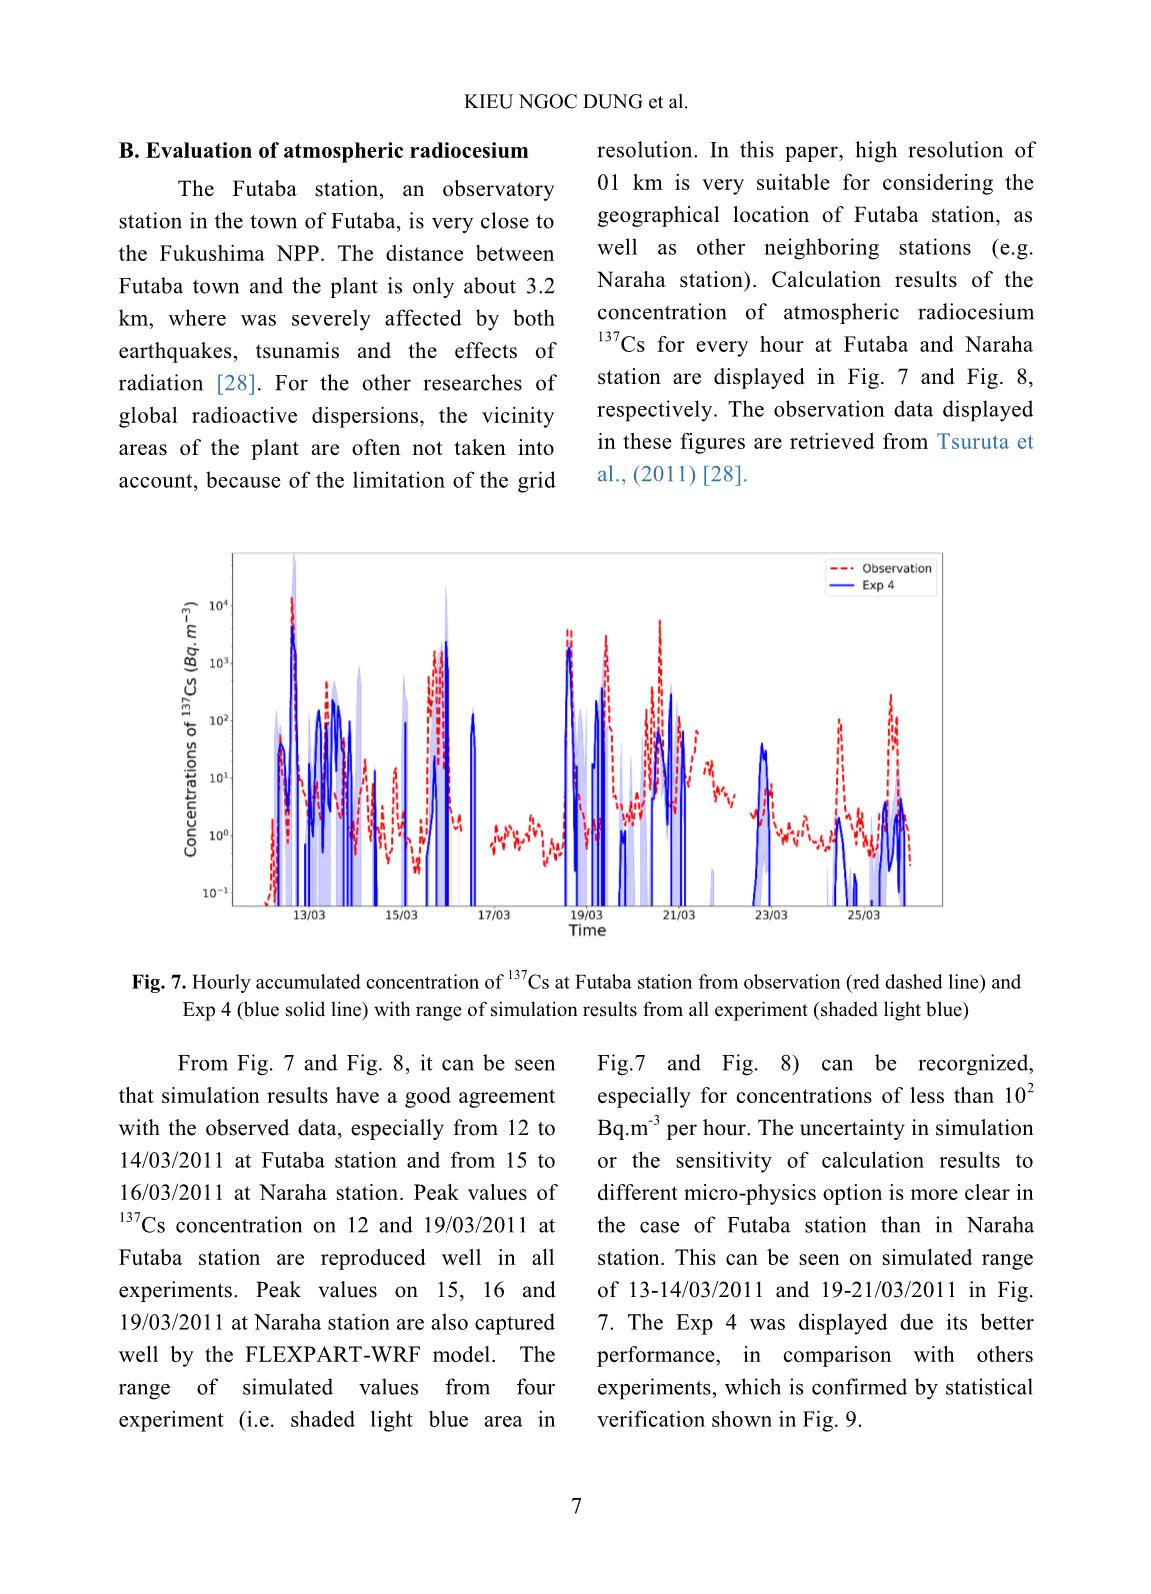
radiation [28]. For the other researches of station are displayed in Fig. 7 and Fig. 8,
global radioactive dispersions, the vicinity respectively. The observation data displayed
areas of the plant are often not taken into in these figures are retrieved from Tsuruta et
account, because of the limitation of the grid al., (2011) [28].
 Fig. 7. Hourly accumulated concentration of 137Cs at Futaba station from observation (red dashed line) and
 Exp 4 (blue solid line) with range of simulation results from all experiment (shaded light blue)
 From Fig. 7 and Fig. 8, it can be seen Fig.7 and Fig. 8) can be recorgnized,
that simulation results have a good agreement especially for concentrations of less than 102
with the observed data, especially from 12 to Bq.m-3 per hour. The uncertainty in simulation
14/03/2011 at Futaba station and from 15 to or the sensitivity of calculation results to
16/03/2011 at Naraha station. Peak values of different micro-physics option is more clear in
137Cs concentration on 12 and 19/03/2011 at the case of Futaba station than in Naraha
Futaba station are reproduced well in all station. This can be seen on simulated range
experiments. Peak values on 15, 16 and of 13-14/03/2011 and 19-21/03/2011 in Fig.
19/03/2011 at Naraha station are also captured 7. The Exp 4 was displayed due its better
well by the FLEXPART-WRF model. The performance, in comparison with others
range of simulated values from four experiments, which is confirmed by statistical
experiment (i.e. shaded light blue area in verification shown in Fig. 9.
 7
SIMULATION OF ATMOSPHERIC RADIOCESIUM (137Cs) FROM FUKUSHIMA NUCLEAR ACCIDENT
 Fig. 8. Hourly accumulated concentration of 137Cs at Naraha station from observation (red dashed line) and
 Exp 4 (blue solid line) with range of simulation results from all experiment (shaded light blue)
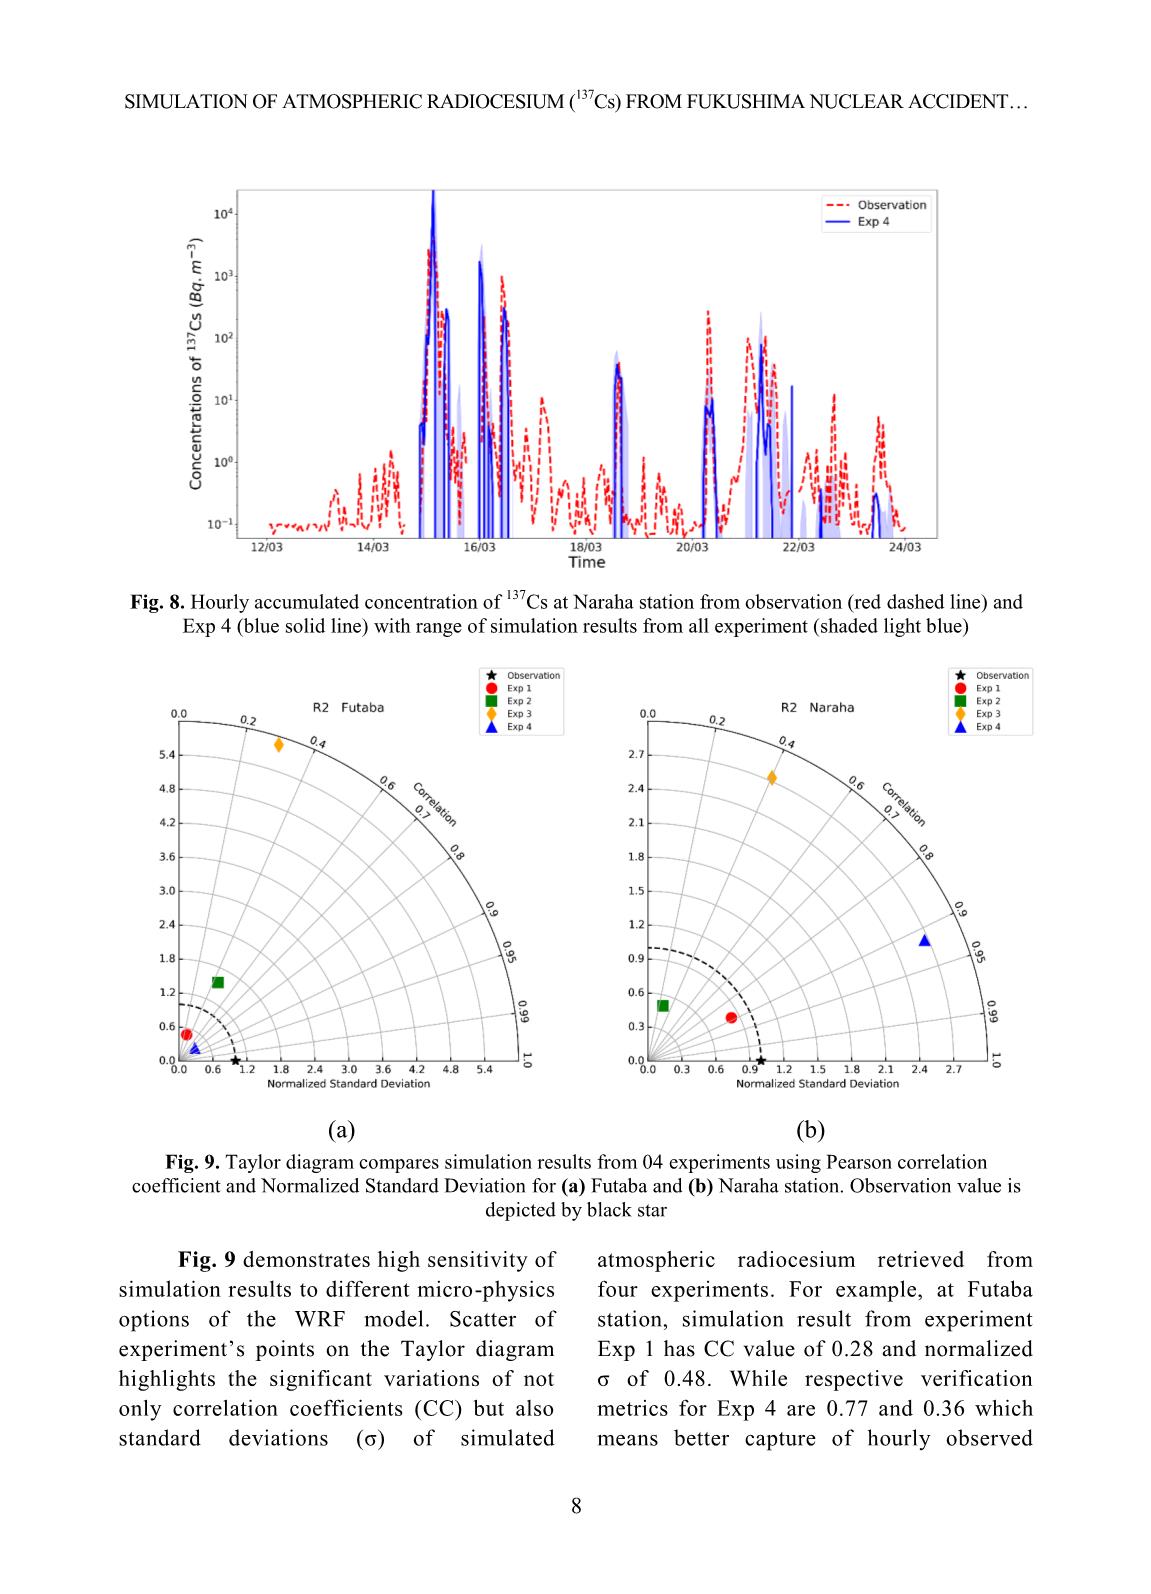
 (a) (b)
 Fig. 9. Taylor diagram compares simulation results from 04 experiments using Pearson correlation
 coefficient and Normalized Standard Deviation for (a) Futaba and (b) Naraha station. Observation value is
 depicted by black star
 Fig. 9 demonstrates high sensitivity of atmospheric radiocesium retrieved from
simulation results to different micro-physics four experiments. For example, at Futaba
options of the WRF model. Scatter of station, simulation result from experiment
experiment’s points on the Taylor diagram Exp 1 has CC value of 0.28 and normalized
highlights the significant variations of not σ of 0.48. While respective verification
only correlation coefficients (CC) but also metrics for Exp 4 are 0.77 and 0.36 which
standard deviations (σ) of simulated means better capture of hourly observed
 8
 KIEU NGOC DUNG et al.
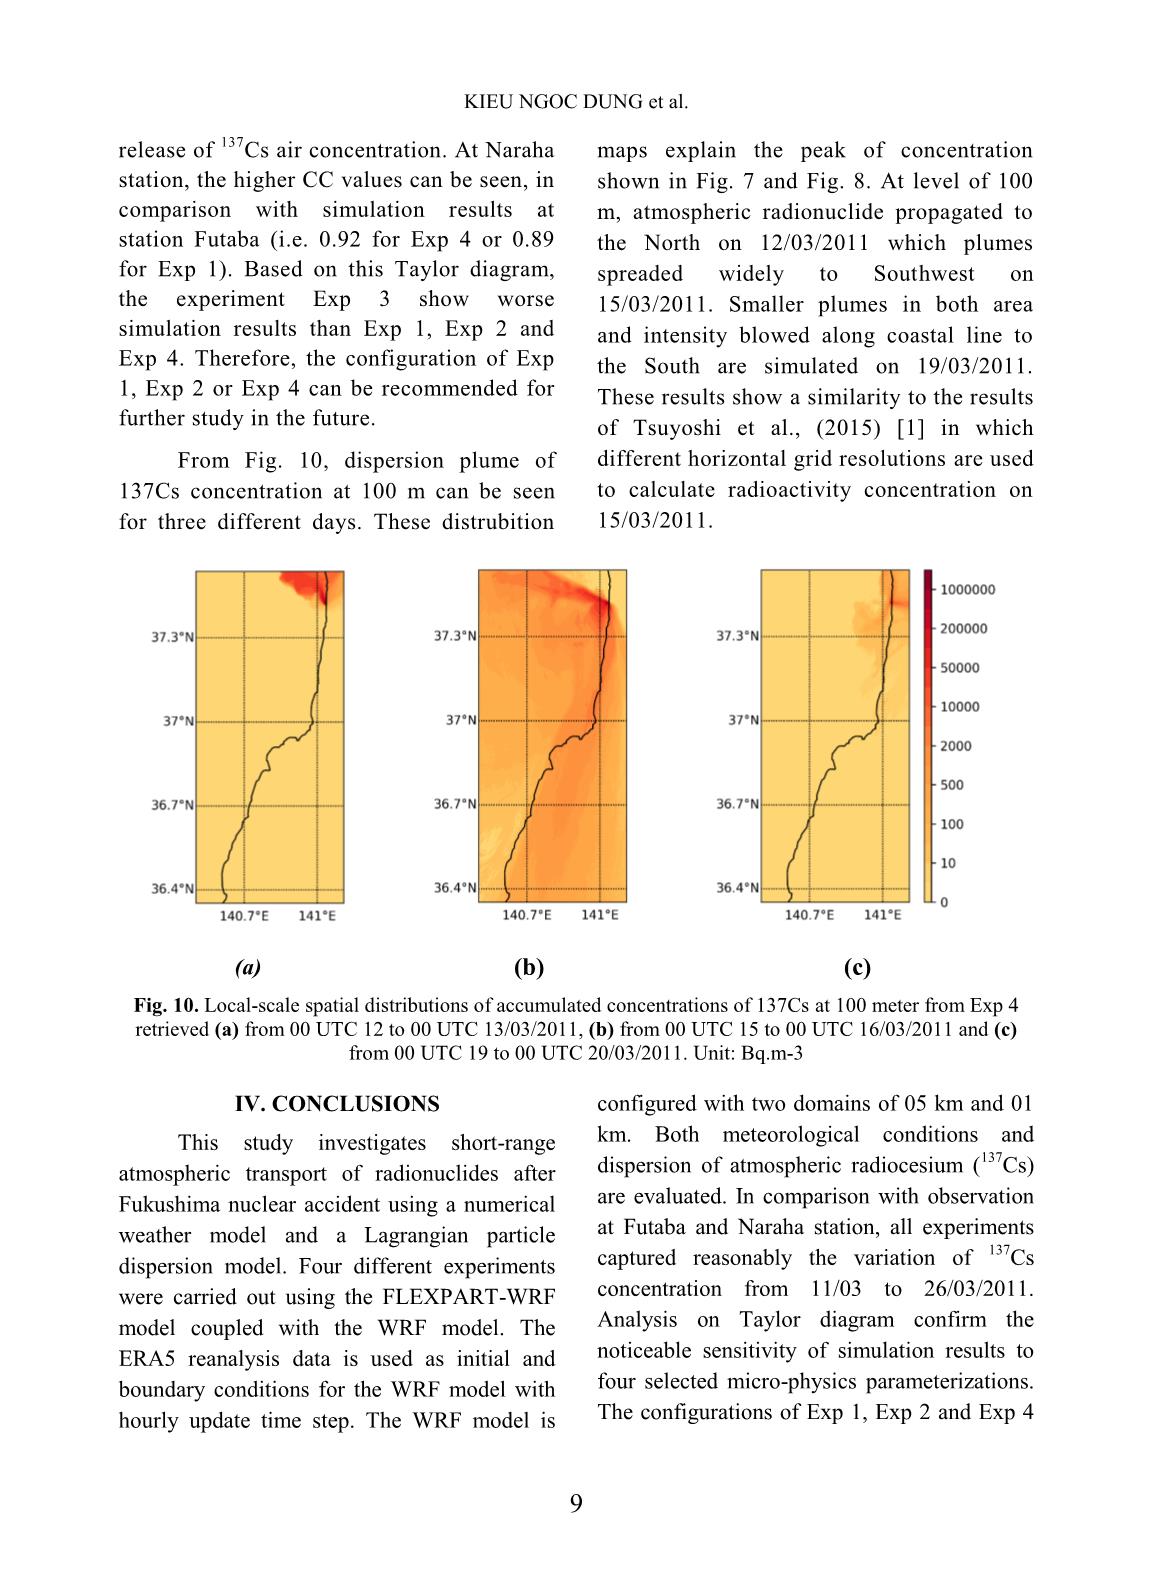
release of 137Cs air concentration. At Naraha maps explain the peak of concentration
station, the higher CC values can be seen, in shown in Fig. 7 and Fig. 8. At level of 100
comparison with simulation results at m, atmospheric radionuclide propagated to
station Futaba (i.e. 0.92 for Exp 4 or 0.89 the North on 12/03/2011 which plumes
for Exp 1). Based on this Taylor diagram, spreaded widely to Southwest on
the experiment Exp 3 show worse 15/03/2011. Smaller plumes in both area
simulation results than Exp 1, Exp 2 and and intensity blowed along coastal line to
Exp 4. Therefore, the configuration of Exp the South are simulated on 19/03/2011.
1, Exp 2 or Exp 4 can be recommended for These results show a similarity to the results
further study in the future. of Tsuyoshi et al., (2015) [1] in which
 From Fig. 10, dispersion plume of different horizontal grid resolutions are used
137Cs concentration at 100 m can be seen to calculate radioactivity concentration on
for three different days. These distrubition 15/03/2011.
 (a) (b) (c)
 Fig. 10. Local-scale spatial distributions of accumulated concentrations of 137Cs at 100 meter from Exp 4
 retrieved (a) from 00 UTC 12 to 00 UTC 13/03/2011, (b) from 00 UTC 15 to 00 UTC 16/03/2011 and (c)
 from 00 UTC 19 to 00 UTC 20/03/2011. Unit: Bq.m-3
 IV. CONCLUSIONS configured with two domains of 05 km and 01
 This study investigates short-range km. Both meteorological conditions and
 137
atmospheric transport of radionuclides after dispersion of atmospheric radiocesium ( Cs)
Fukushima nuclear accident using a numerical are evaluated. In comparison with observation
weather model and a Lagrangian particle at Futaba and Naraha station, all experiments
 137
dispersion model. Four different experiments captured reasonably the variation of Cs
were carried out using the FLEXPART-WRF concentration from 11/03 to 26/03/2011.
model coupled with the WRF model. The Analysis on Taylor diagram confirm the
ERA5 reanalysis data is used as initial and noticeable sensitivity of simulation results to
boundary conditions for the WRF model with four selected micro-physics parameterizations.
hourly update time step. The WRF model is The configurations of Exp 1, Exp 2 and Exp 4
 9
 SIMULATION OF ATMOSPHERIC RADIOCESIUM (137Cs) FROM FUKUSHIMA NUCLEAR ACCIDENT
are recommended for further study due to their [5]. Morino et al., “Atmospheric behavior,
better performance among all. deposition, and budget of radioactive materials
 from the Fukushima Daiichi nuclear power
 ACKNOWLEDGEMENT plant in March 2011”, Geophysical Research
 Letters, VOL. 38, L00G11, 2011.
 This article is supported by the project
titled “Study the effects of the floating nuclear [6]. Yasunari et al., “Cesium-137 deposition and
 contamination of Japanese soils due to the
power plant on the sea and the nuclear power
 Fukushima nuclear accident”, PNAS
plants on Hainan Island on Vietnam’s marine
 December 6, 108 (49) 19530-19534, 2011.
environment by modelling and developing
response plans for a nuclear accident occurred [7]. Katata et al., “Atmospheric discharge and
 dispersion of radionuclides during the Fukushima
over the sea”, project code: KC.AT, in the
 Dai-ichi Nuclear Power Plant accident. Part I:
framework of technical research program, Source term estimation and local-scale
nuclear safety to ensure combat readiness for atmospheric dispersion in early phase of the
the Army in the 2016-2020 period. This article accident”, Journal of Environmental
is also supported by the project titled “Study Radioactivity 109, 103-113, 2012.
and calculating the spread of atmospheric [8]. Le Petit et al., “Analysis of radionuclide
radionuclides and modernization of stations releases from the Fukushima Dai-ichi nuclear
for radioactive analysis” (PACT-1). power plant accident part I”, Pure Appl.
 Geophys. , 2012.
 REFERENCES
 [9]. Takemura et al., “A Numerical Simulation of
[1]. Tsuyoshi T. Sekiyama, Masaru Kunii, Mizuo Global Transport of Atmospheric Particles
 Kajino, and Toshiki Shimbori, “Horizontal Emitted from the Fukushima Daiichi Nuclear
 Resolution Dependence of Atmospheric Power Plant” , SOLA, Vol. 7, 101−104,
 doi:10.2151/sola.2011-026, 2011.
 Simulations of the Fukushima Nuclear Accident
 Using 15-km, 3-km, and 500-m Grid Models”, [10]. Stohl et al., 2012, “Xenon-133 and caesium-
 Journal of the Meteorological Society of Japan, 137 releases into the atmosphere from the
 Vol. 93, No. 1, pp. 49−64, 2015. Fukushima Dai-ichi nuclear power plant:
 determination of the source term, atmospheric
[2]. Japan Meteorological Agency, “Information on
 dispersion, and deposition” , Atmos. Chem.
 the 2011 off the Pacific Coast of Tohoku
 Phys., 12, 2313–2343, 2012.
 Earthquake”, 2015.
 [11]. Christoudias and Lelieveld, “Modelling the
[3]. IAEA Library Cataloguing in Publication global atmospheric transport and deposition of
 Data, “The Fukushima Daiichi accident, radionuclides from the Fukushima Dai-ichi
 Technical Volume 1: Description and Context nuclear accident”, Atmos. Chem. Phys., 13,
 of the accident”, IAEA, 2015. 1425–1438, 2013.
[4]. Chino et al., , “Preliminary Estimation of [12]. Brioude, Jerome, Delia Arnold, Andreas Stohl,
 131 137
 Release Amounts of I and Cs Massimo Cassiani, Don Morton, P. Seibert, W.
 Accidentally Discharged from the Fukushima Angevine et al., “The Lagrangian particle
 Daiichi Nuclear Power Plant into the dispersion model FLEXPART-WRF version
 Atmosphere”, Journal of Nuclear Science and 3.1.”, Geoscientific Model Development, 6.6:
 Technology, 48:7, 1129-1134, 2011. 1889-1904, 2013.
 10
 KIEU NGOC DUNG et al.
[13]. Charron et al., “The stratospheric extension of experiment using a mesoscale two-dimensional
 the Canadian global deterministic medium- model", Journal of the atmospheric sciences
 range weather forecasting system and its 46.20: 3077-3107, 1989.
 impact on tropospheric forecasts” , Mon. Wea.
 [22]. Mlawer, Eli J., et al., "Radiative transfer for
 Rev., 140 (2012), pp. 1924-1944, 2012.
 inhomogeneous atmospheres: RRTM, a
[14]. Kanamitsu et al., “Recent changes validated correlated-k model for the longwave
 implemented into the global forecast system at (Paper 97JD00237)", Journal of Geophysical
 NMC” , Wea. Forecasting, 6 (1991), pp. 425- Researche-All Series-102: 16-663, 1997.
 435, 1991.
 [23]. Kessler, Edwin. “On the distribution and
[15]. Davies et al., “A new dynamical core for the continuity of water substance in atmospheric
 Met Office's global and regional modelling of circulations.” pp. 1-84. American
 the atmosphere” , Q. J. R. Meteorol. Soc., 131 Meteorological Society, Boston, MA, 1969.
 (2005), pp. 1759-1782, 2005.
 [24]. Hong, S.-Y., and J.-O. J. Lim. “The WRF
[16]. Hersbach, Hans, Bill Bell, Paul Berrisford, Single-Moment 6-Class Microphysics Scheme
 Shoji Hirahara, András Horányi, Joaquín (WSM6)”, J. Korean Meteor. Soc., 42, 129–
 Muñoz‐Sabater, Julien Nicolas et al. “The 151, 2006.
 ERA5 global reanalysis.” Quarterly Journal of [25]. Hong, S.-Y., J. Dudhia, and S.-H. Chen. “A
 the Royal Meteorological Society 146, no. 730, Revised Approach to Ice Microphysical
 1999-2049, 2020. Processes for the Bulk Parameterization of
[17]. Skamarock, William C., Joseph B. Klemp, Jimy Clouds and Precipitation”, Mon. Wea. Rev.,
 Dudhia, David O. Gill, Dale M. Barker, Michael 132, 103–120, 2004.
 G. Duda, Xiang-Yu Huang, Wei Wang, and [26]. Thompson, G., R. M. Rasmussen, and K.
 Jordan G. Powers., “A description of the Manning. “Explicit forecasts of winter
 Advanced Research WRF version 3.” In NCAR precipitation using an improved bulk
 Tech. Note NCAR/TN-475+ STR. 2008. microphysics scheme. Part I: Description and
[18]. Stohl, Andreas, C. Forster, A. Frank, P. sensitivity analysis”. Mon. Wea. Rev., 132,
 Seibert, and G. Wotawa. “Technical note: The 519–542, 2004.
 Lagrangian particle dispersion model [27]. Katata, G., et al., “Detailed source term
 FLEXPART version 6.2.”, Atmos. Chem. estimation of the atmospheric release for the
 Phys. Discuss., 62 pages, 2005. Fukushima Daiichi Nuclear Power Station
[19]. Ek, M. B., et al., "Implementation of Noah land accident by coupling simulations of an
 surface model advances in the National Centers atmospheric dispersion model with an
 for Environmental Prediction operational improved deposition scheme and oceanic
 dispersion model”, Atmospheric Chemistry &
 mesoscale Eta model", Journal of Geophysical
 Physics 15.2, 2015.
 Research: Atmospheres 108.D22, 2003.
 [28]. Tsuruta, Haruo, Yasuji Oura, Mitsuru Ebihara,
[20]. Hong, Song-You, Yign Noh, and Jimy Dudhia.
 Yuichi Moriguchi, Toshimasa Ohara, and
 “A new vertical diffusion package with an
 Teruyuki Nakajima. “Time-series analysis of
 explicit treatment of entrainment processes.”
 atmospheric radiocesium at two SPM
 Monthly weather review 134, no. 9, 2318-
 monitoring sites near the Fukushima Daiichi
 2341, 2006.
 Nuclear Power Plant just after the Fukushima
[21]. Dudhia, Jimy, "Numerical study of convection accident on March 11, 2011.” Geochemical
 observed during the winter monsoon Journal 52, no. 2, 103-121, 2018.
 11
 SIMULATION OF ATMOSPHERIC RADIOCESIUM (137Cs) FROM FUKUSHIMA NUCLEAR ACCIDENT
[29]. Taylor, Karl E. "Summarizing multiple aspects nuclear accident covering central-east Japan”,
 of model performance in a single diagram." Proc. Natl. Acad. Sci. U. S. A., 108, pp.
 Journal of Geophysical Research: Atmospheres 19526-19529, 2011.
 106, no. D7, 7183-7192, 2001.
 [31]. Sugiyama et al., “Atmospheric dispersion
[30]. Kinoshita et al., “Assessment of individual modeling: challenges of the Fukushima Daiichi
 radionuclide distributions from the Fukushima response”, Health Phys., 102, pp. 493-508, 2012.
 12
File đính kèm:
 simulation_of_atmospheric_radiocesium_cs_from_fukushima_nucl.pdf

