Performance evaluation of data transport over differentnode density of zigbee sensor network – An opnet simulation study
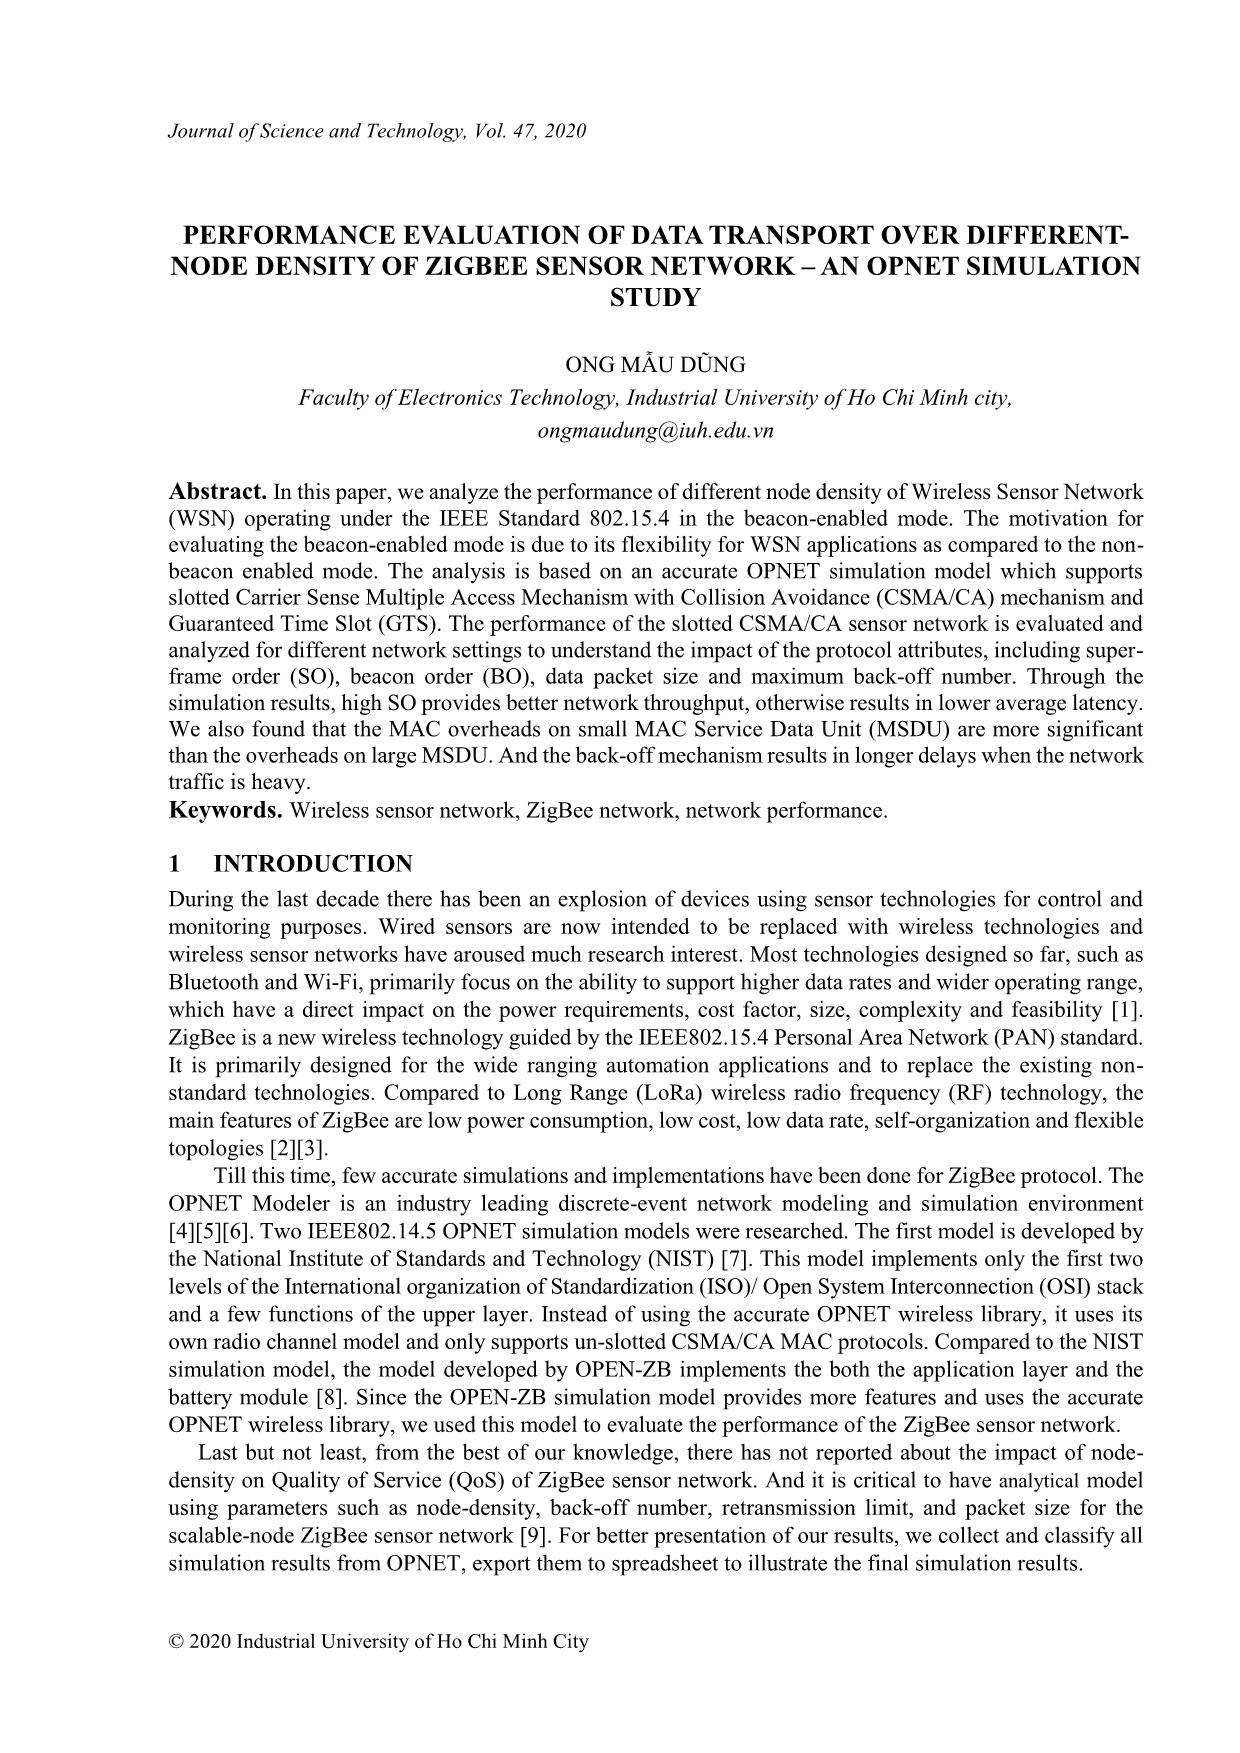
Abstract. In this paper, we analyze the performance of different node density of Wireless Sensor Network
(WSN) operating under the IEEE Standard 802.15.4 in the beacon-enabled mode. The motivation for
evaluating the beacon-enabled mode is due to its flexibility for WSN applications as compared to the nonbeacon enabled mode. The analysis is based on an accurate OPNET simulation model which supports
slotted Carrier Sense Multiple Access Mechanism with Collision Avoidance (CSMA/CA) mechanism and
Guaranteed Time Slot (GTS). The performance of the slotted CSMA/CA sensor network is evaluated and
analyzed for different network settings to understand the impact of the protocol attributes, including superframe order (SO), beacon order (BO), data packet size and maximum back-off number. Through the
simulation results, high SO provides better network throughput, otherwise results in lower average latency.
We also found that the MAC overheads on small MAC Service Data Unit (MSDU) are more significant
than the overheads on large MSDU. And the back-off mechanism results in longer delays when the network
traffic is heavy.
Trang 1
Trang 2
Trang 3
Trang 4
Trang 5
Trang 6
Trang 7
Trang 8
Trang 9
Trang 10
Tóm tắt nội dung tài liệu: Performance evaluation of data transport over differentnode density of zigbee sensor network – An opnet simulation study
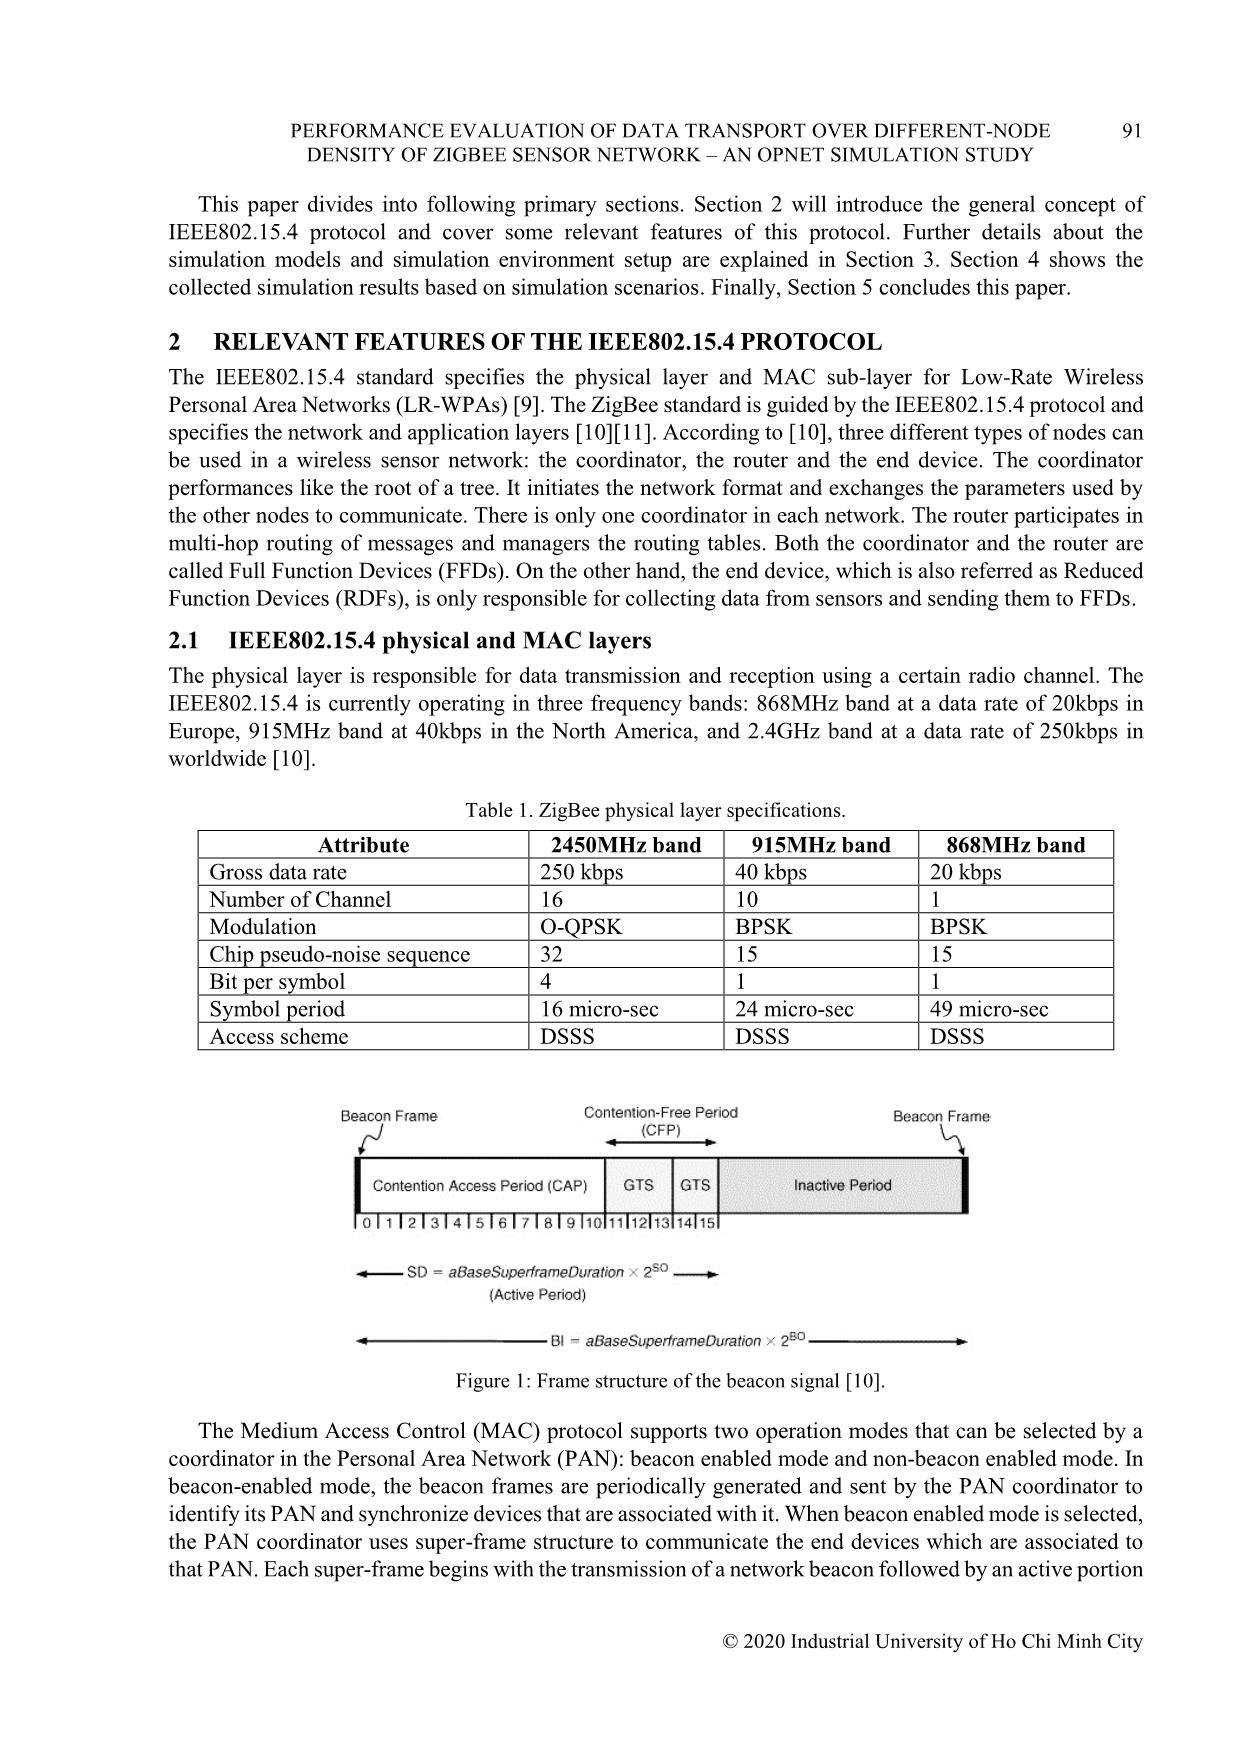
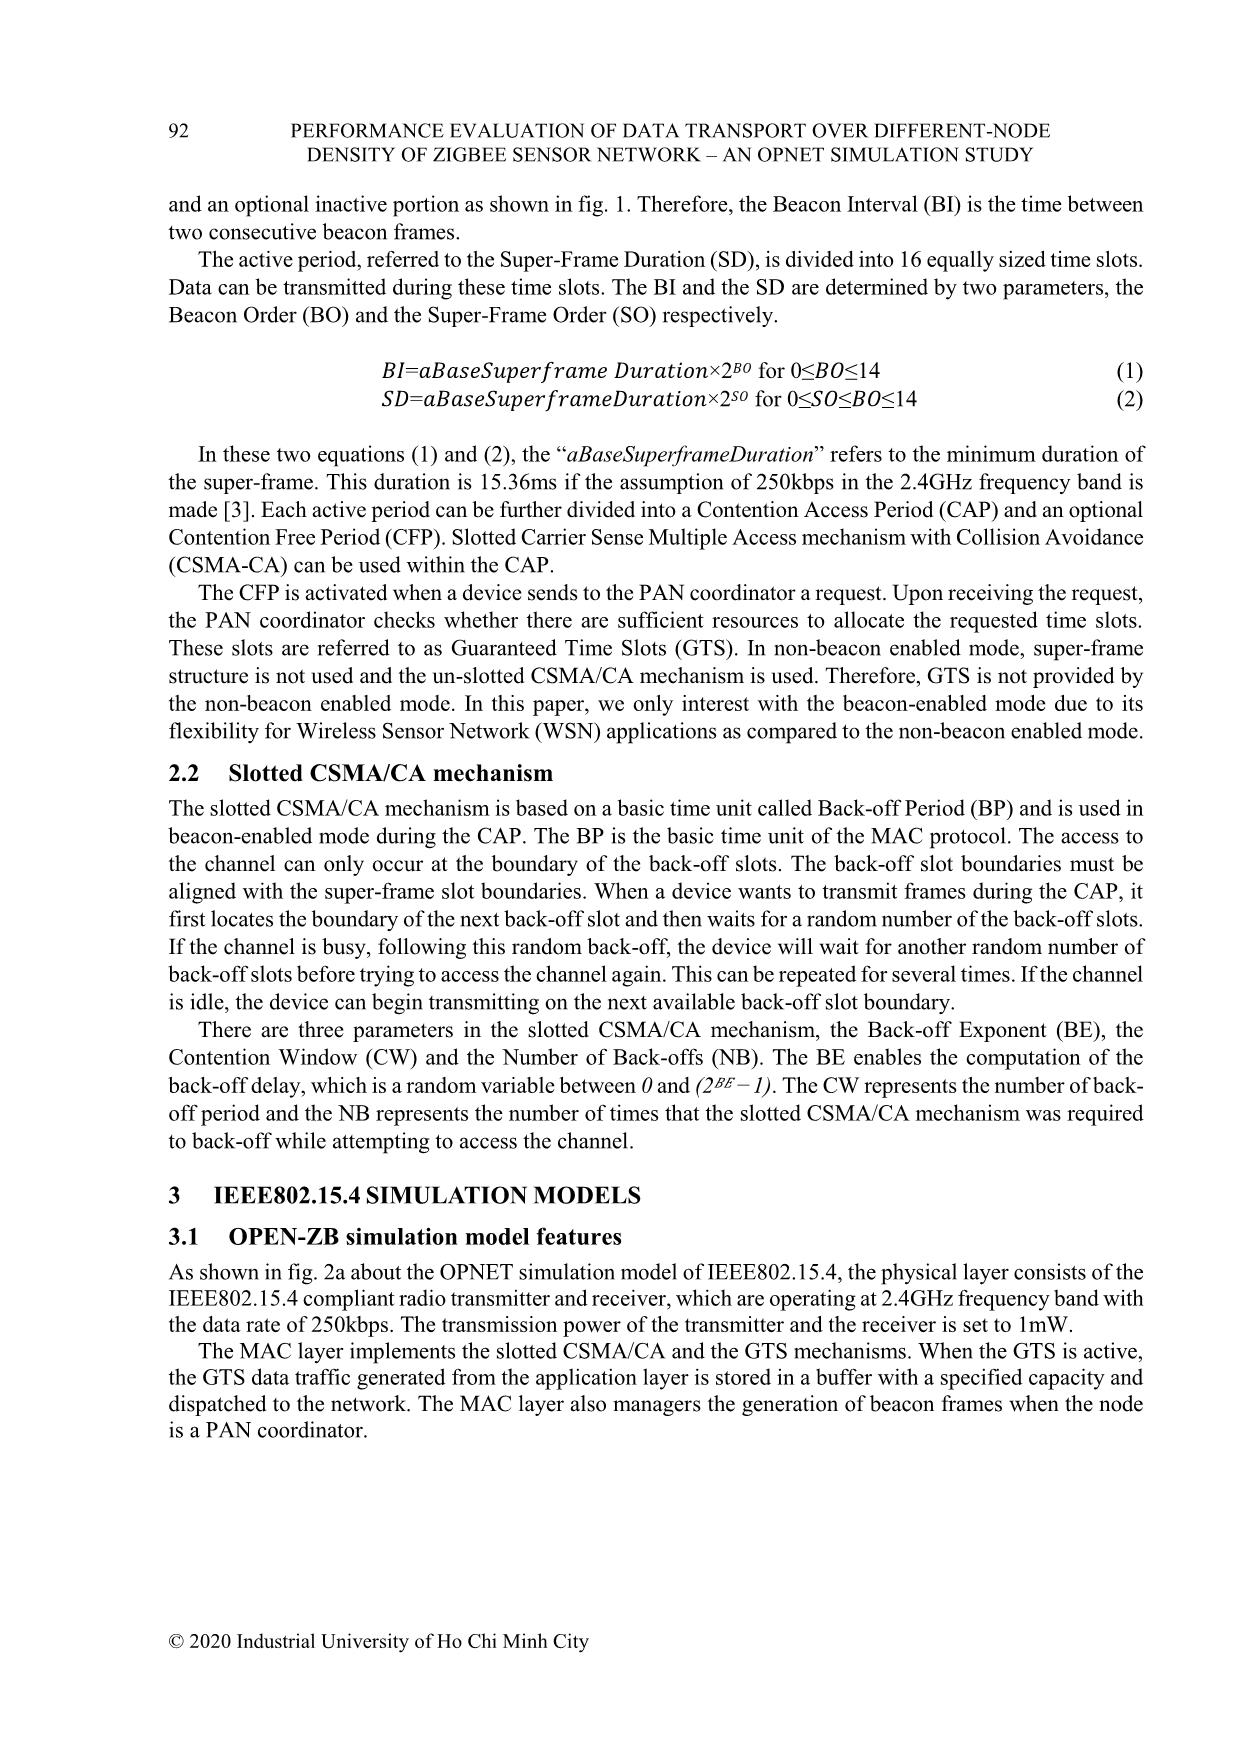
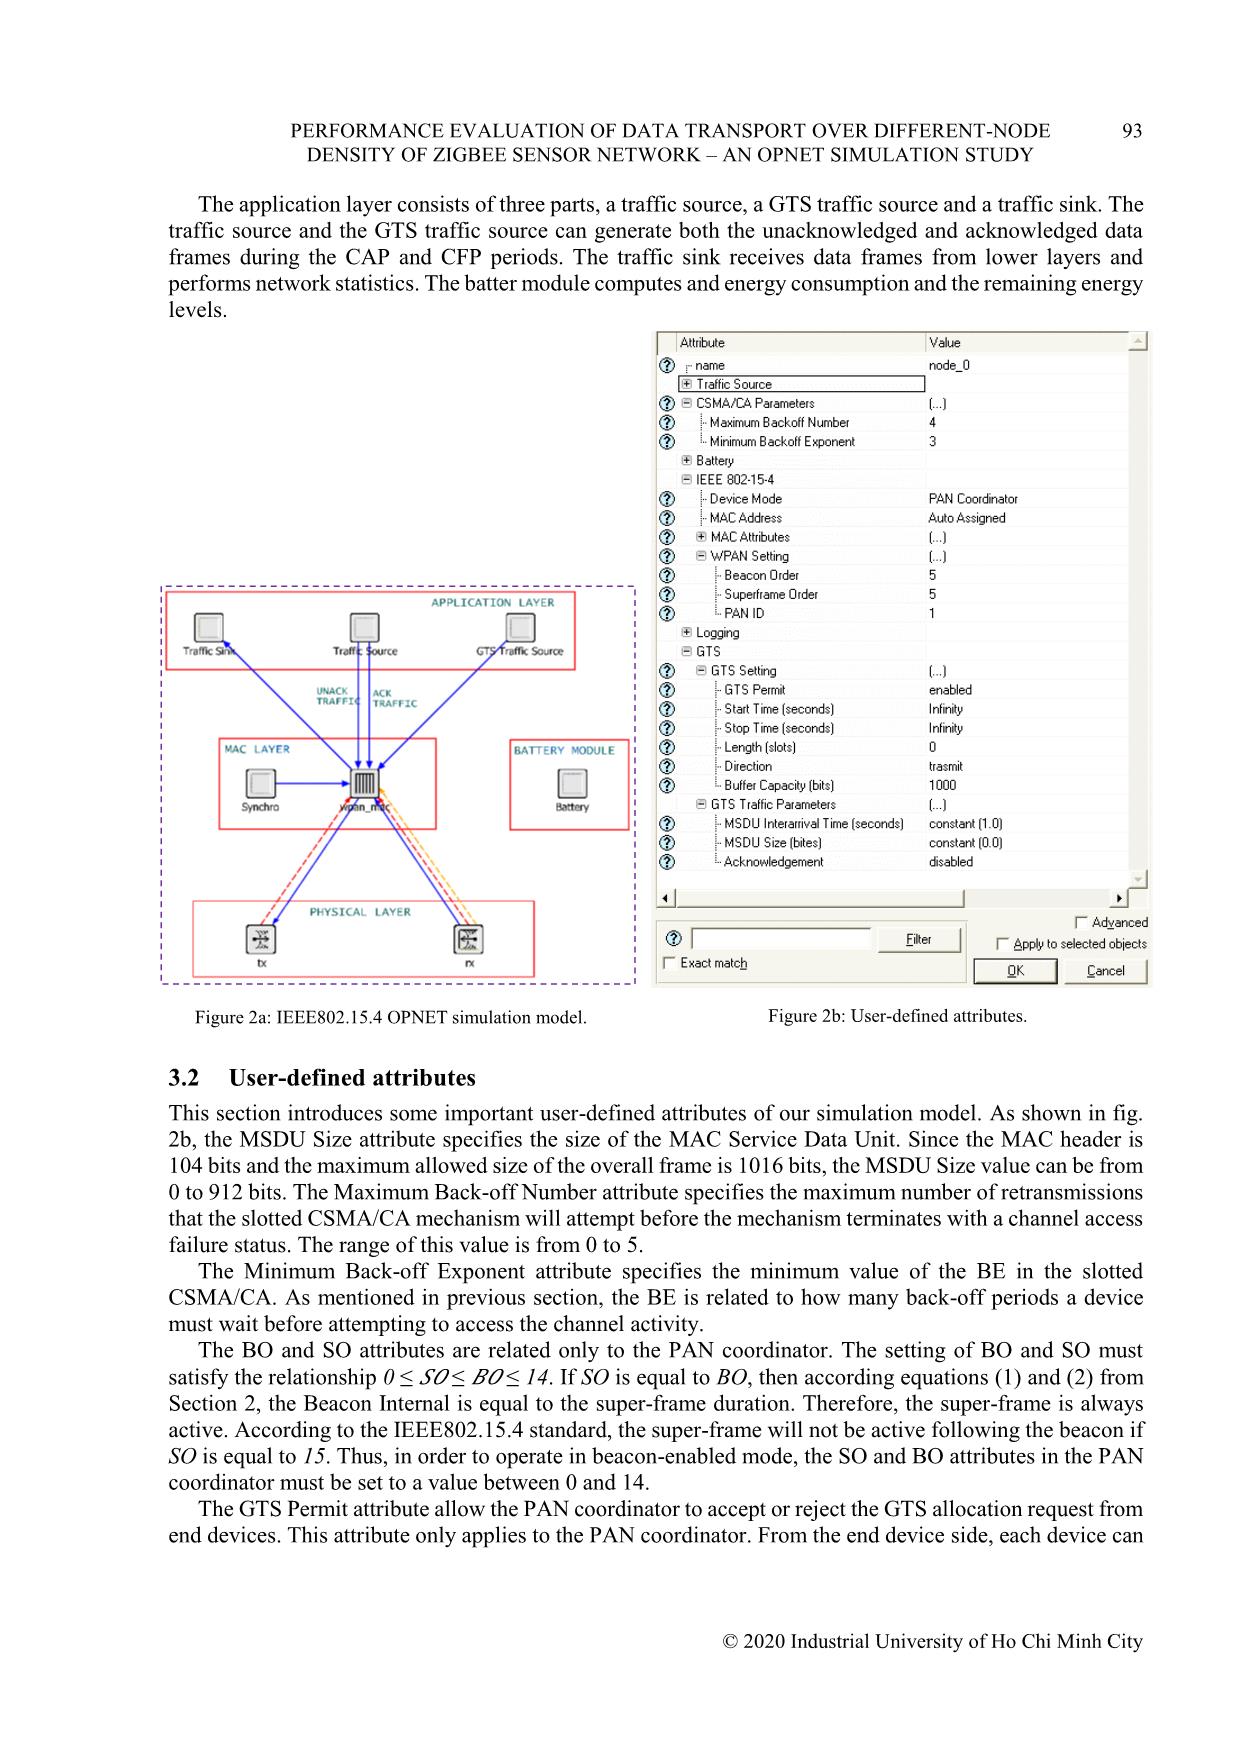
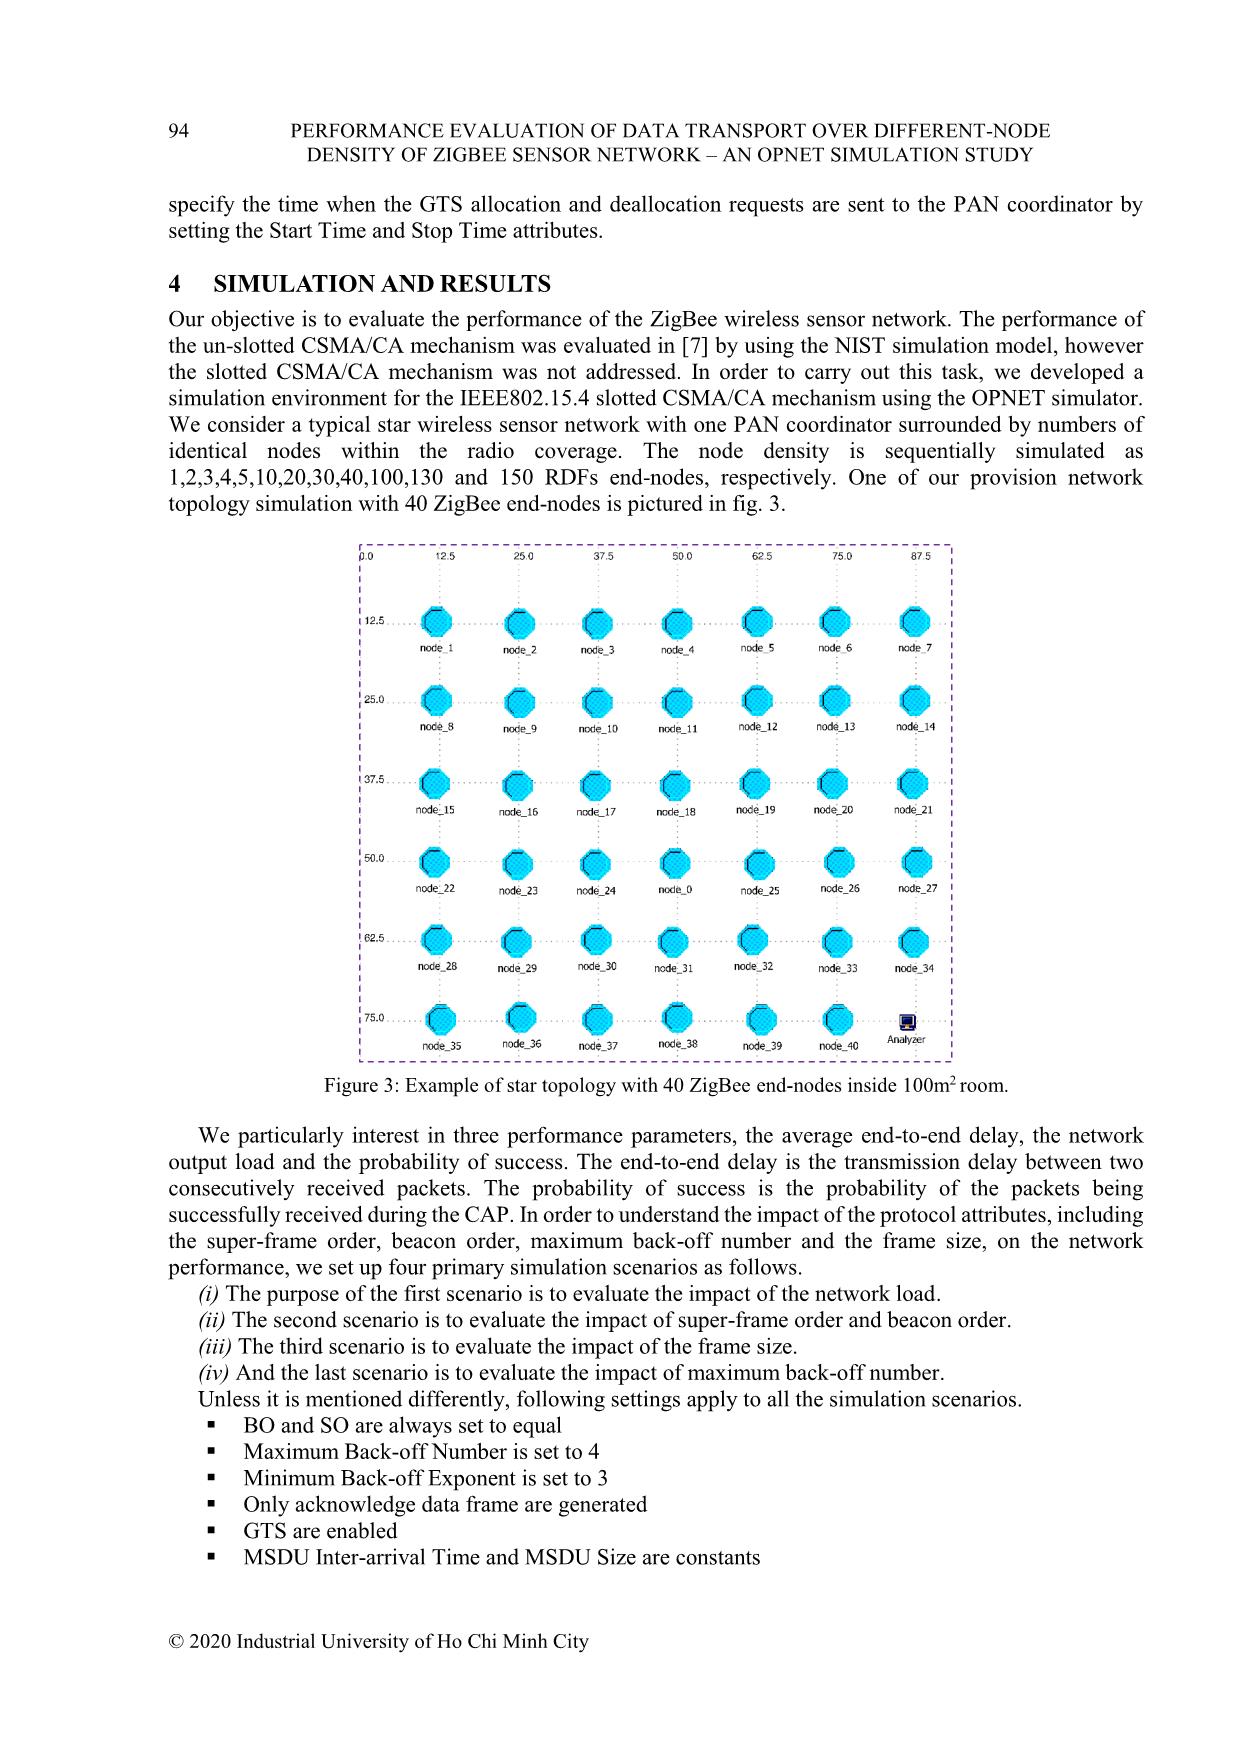
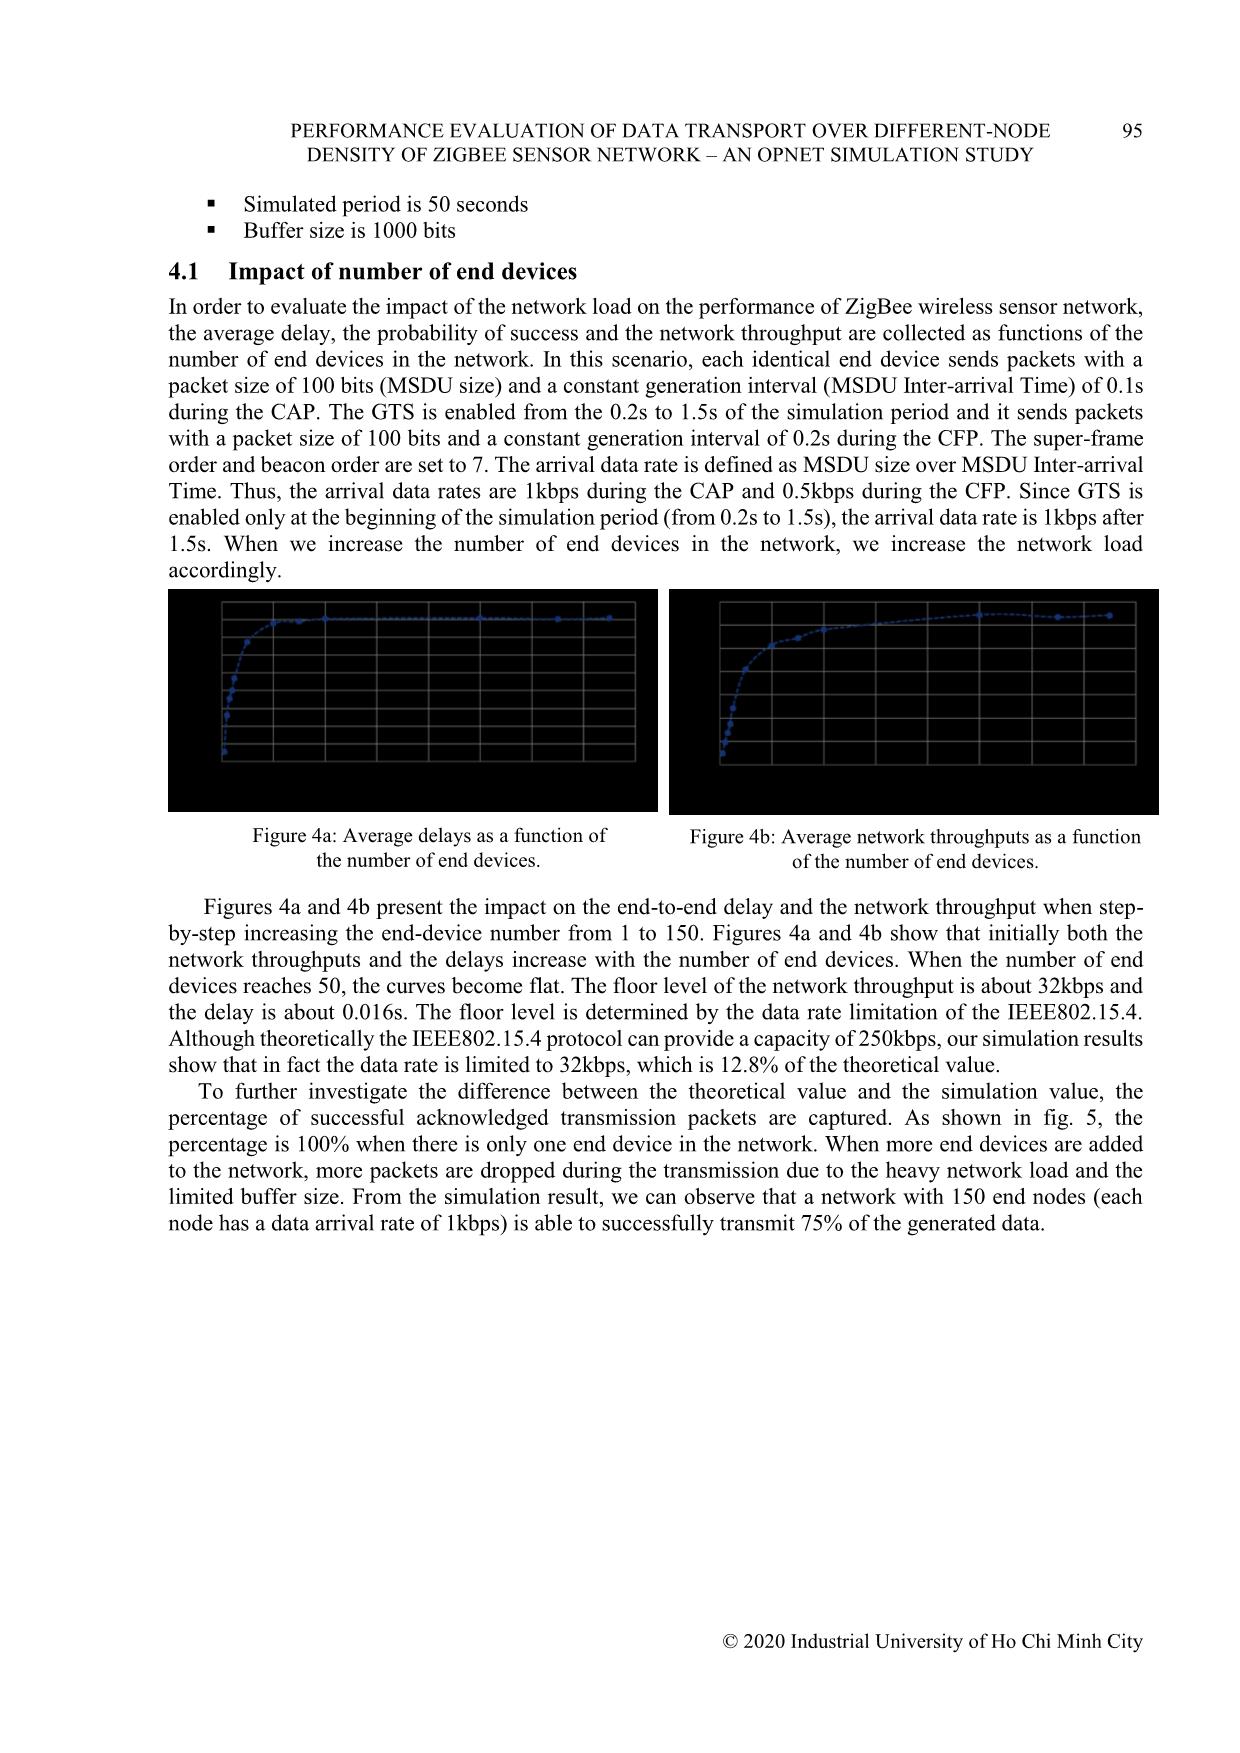
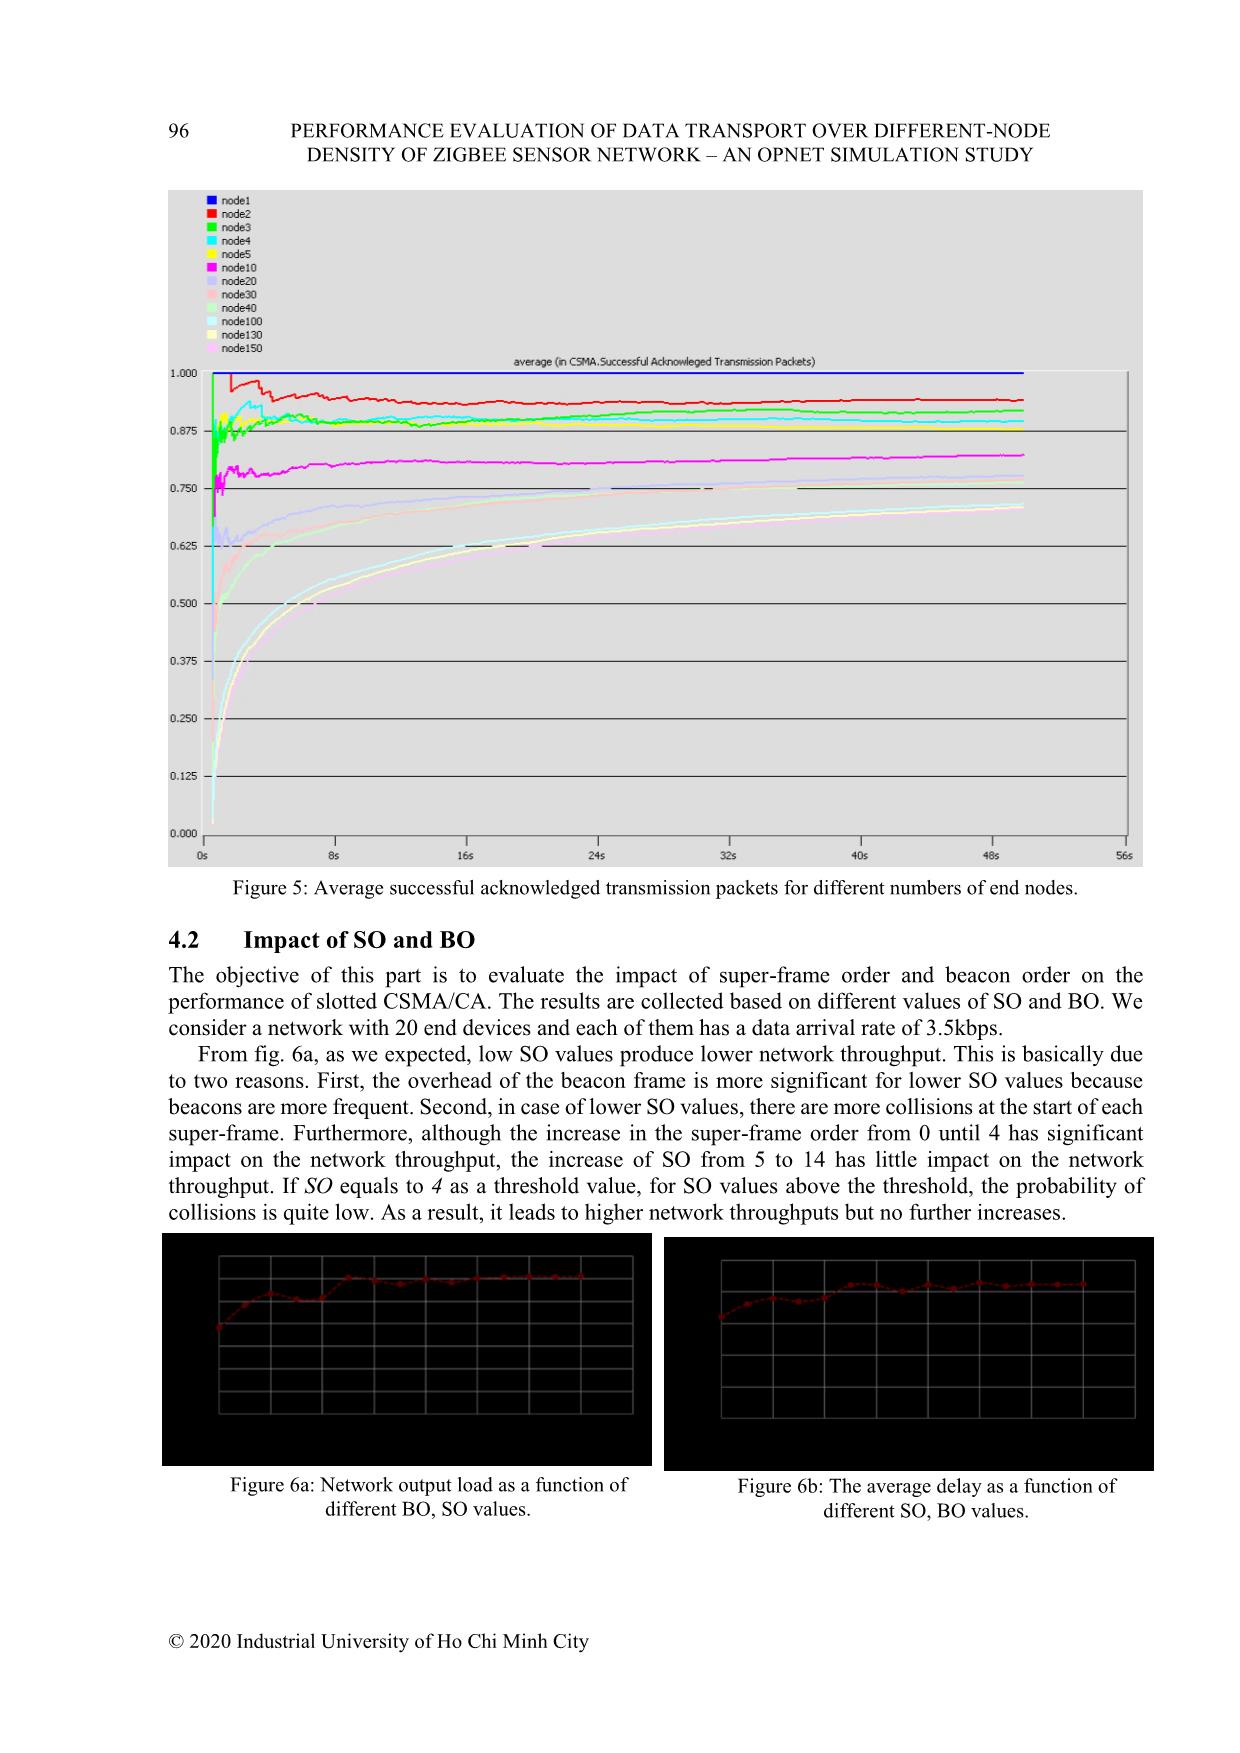
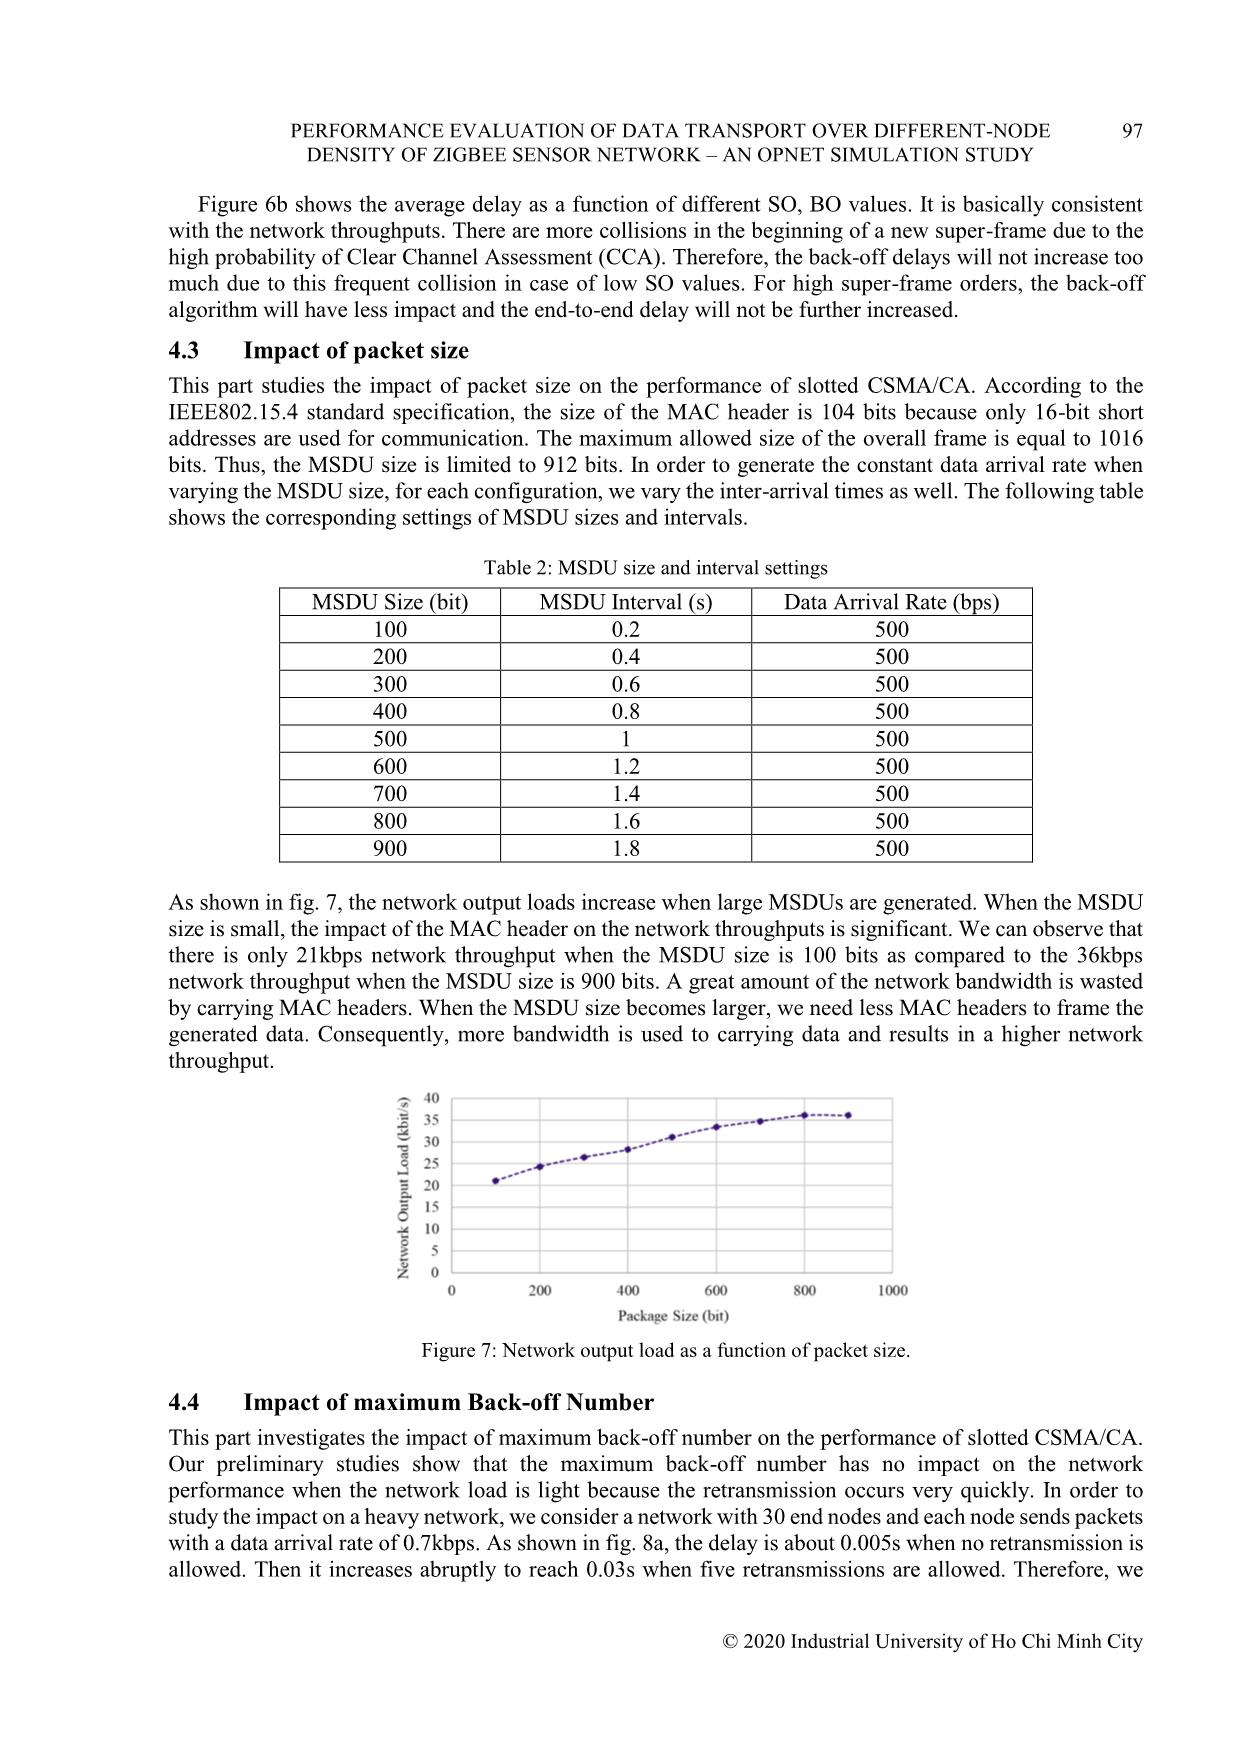
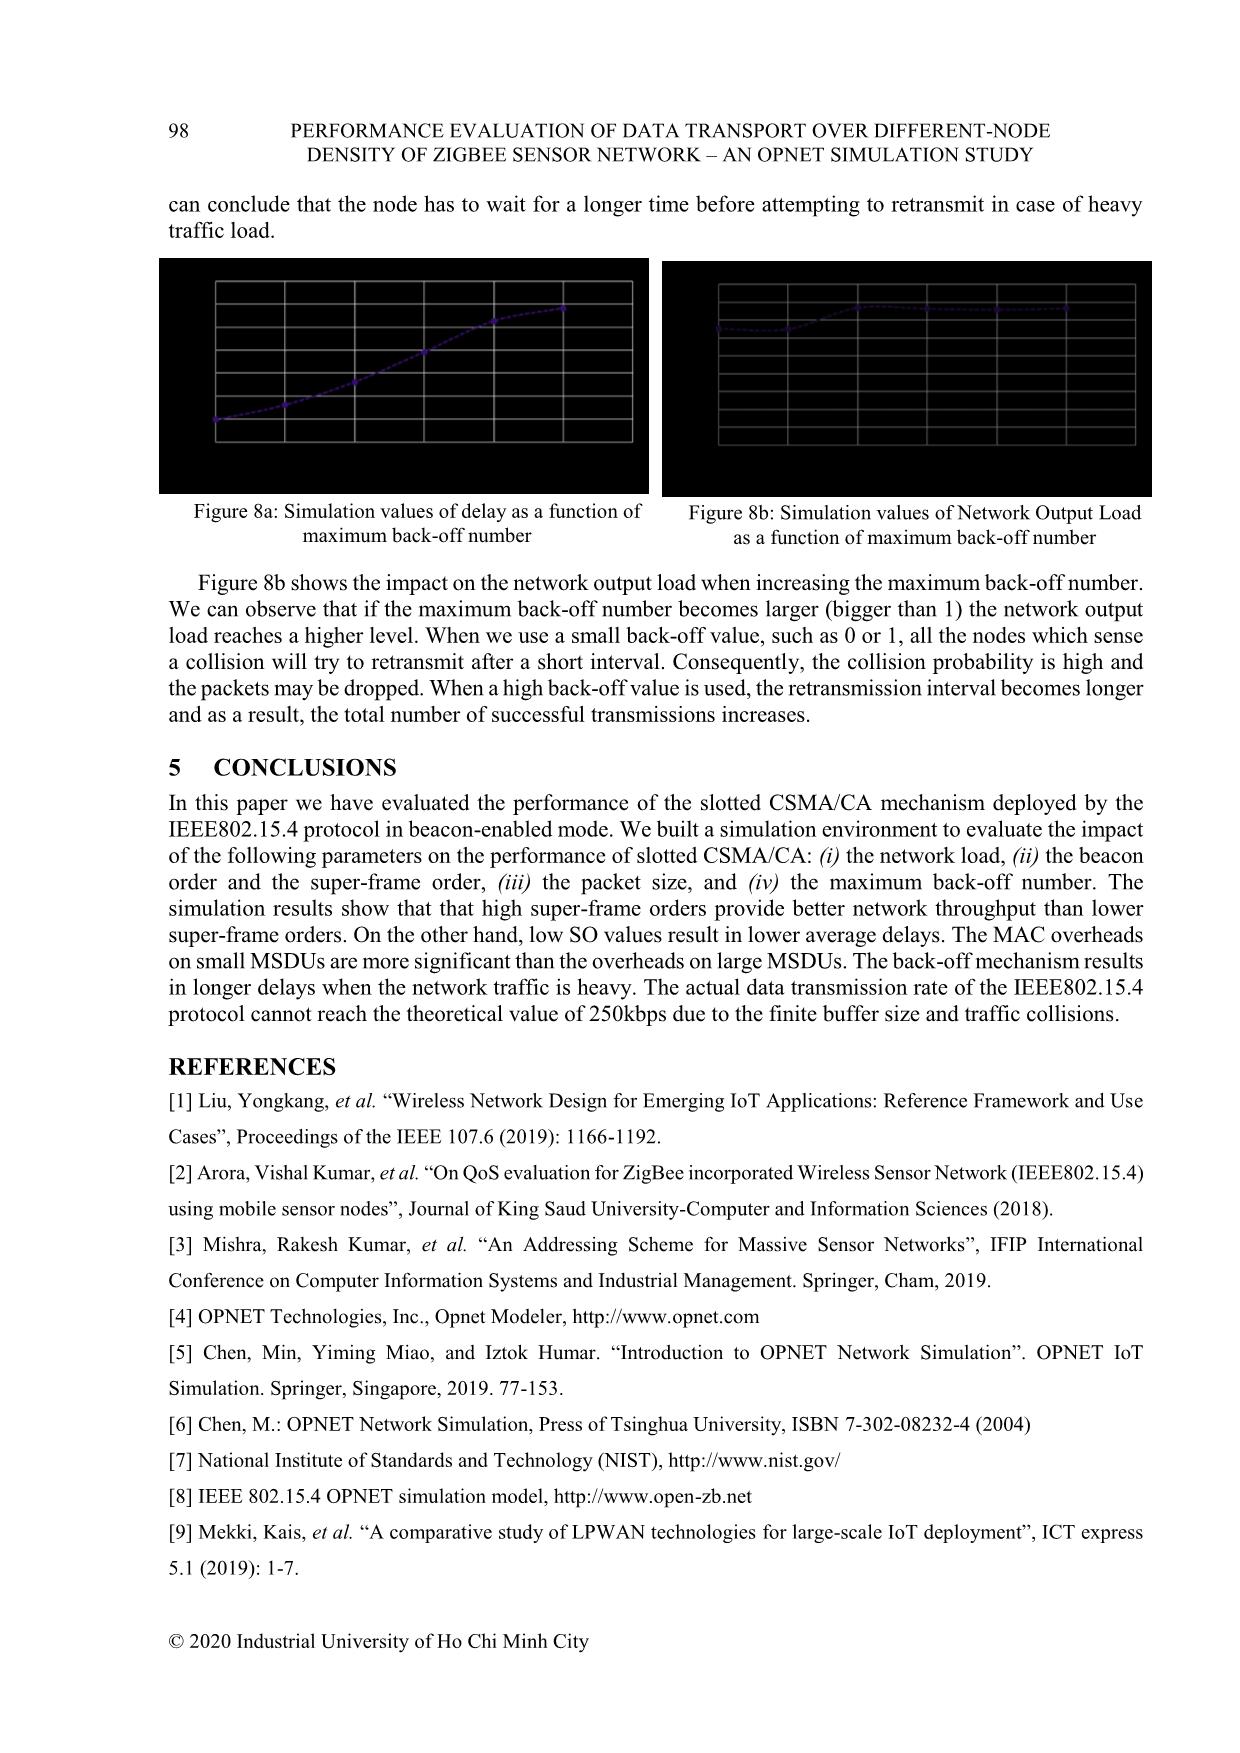
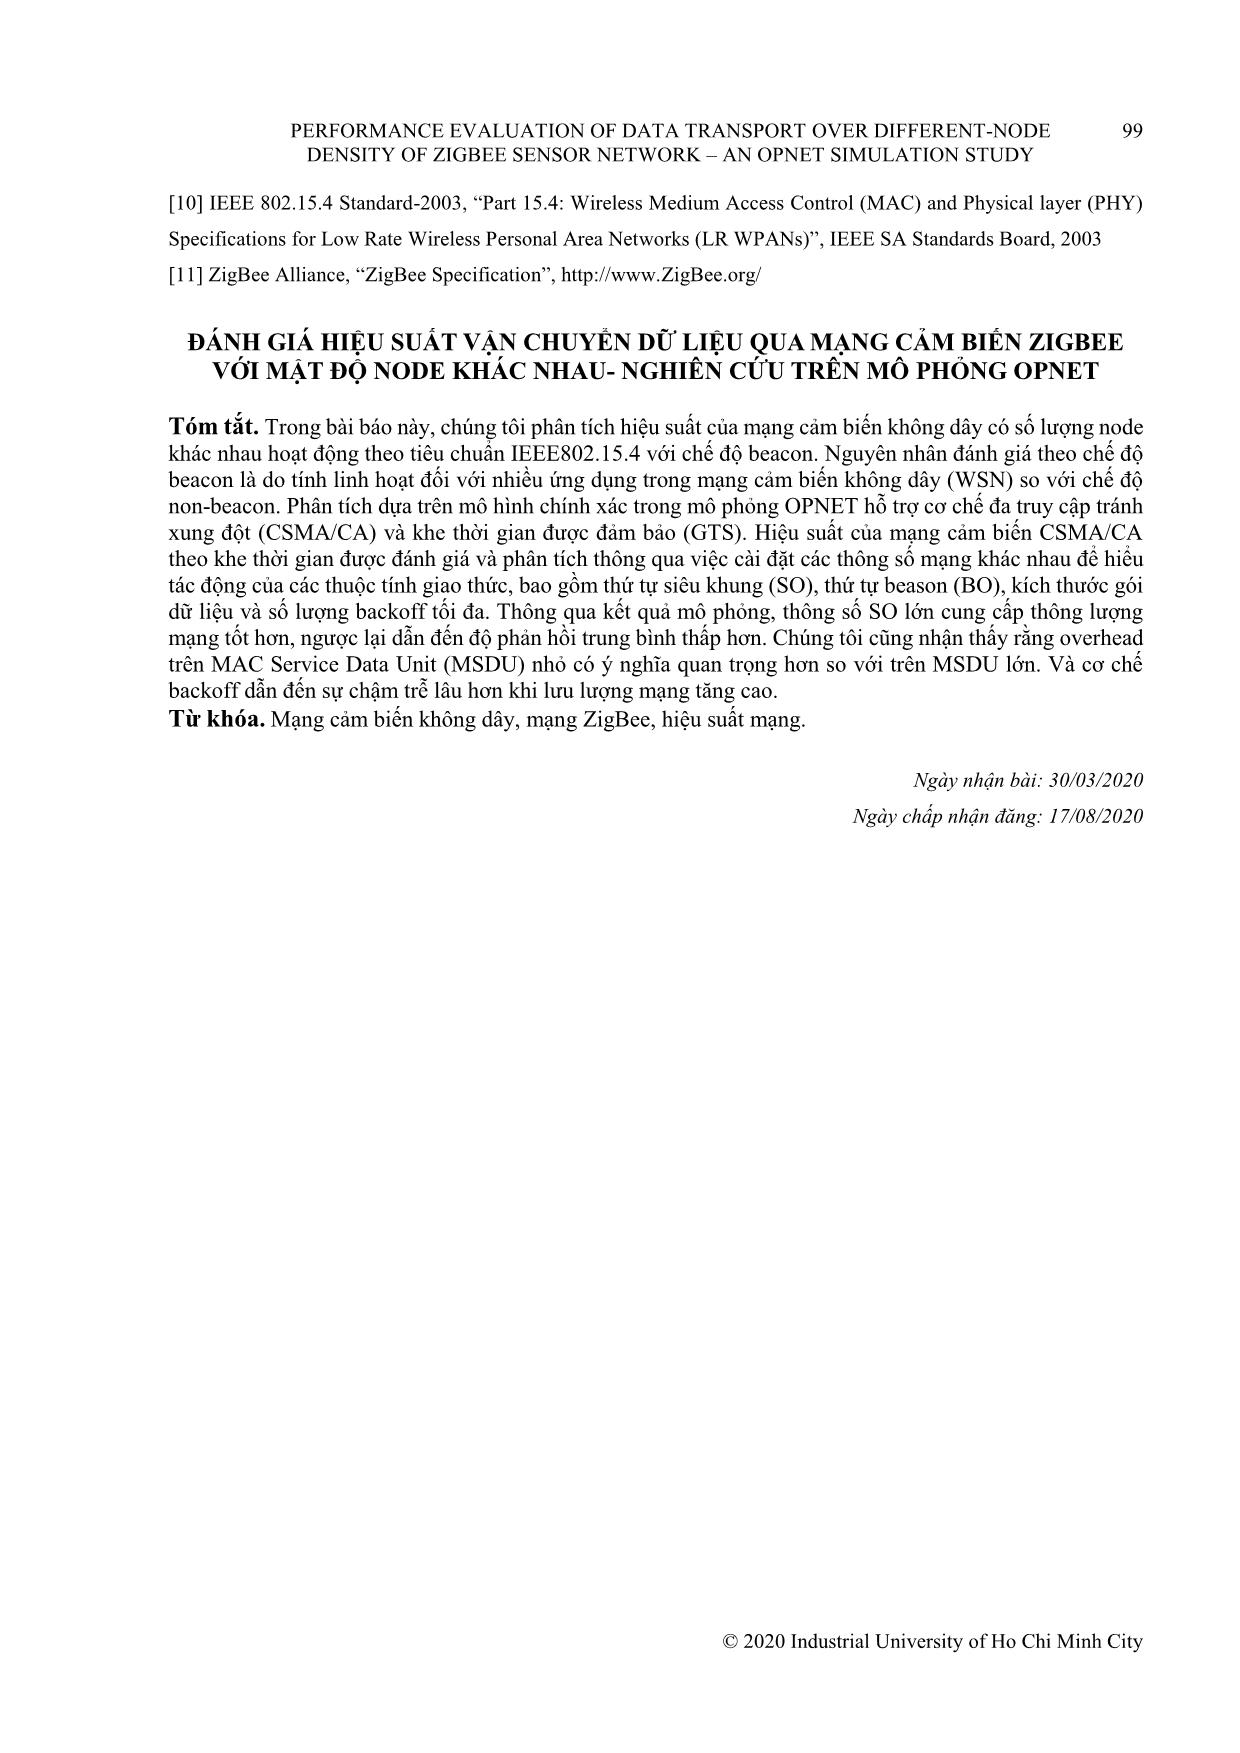
the PAN coordinator to accept or reject the GTS allocation request from end devices. This attribute only applies to the PAN coordinator. From the end device side, each device can Figure 2a: IEEE802.15.4 OPNET simulation model. Figure 2b: User-defined attributes. 94 PERFORMANCE EVALUATION OF DATA TRANSPORT OVER DIFFERENT-NODE DENSITY OF ZIGBEE SENSOR NETWORK – AN OPNET SIMULATION STUDY © 2020 Industrial University of Ho Chi Minh City specify the time when the GTS allocation and deallocation requests are sent to the PAN coordinator by setting the Start Time and Stop Time attributes. 4 SIMULATION AND RESULTS Our objective is to evaluate the performance of the ZigBee wireless sensor network. The performance of the un-slotted CSMA/CA mechanism was evaluated in [7] by using the NIST simulation model, however the slotted CSMA/CA mechanism was not addressed. In order to carry out this task, we developed a simulation environment for the IEEE802.15.4 slotted CSMA/CA mechanism using the OPNET simulator. We consider a typical star wireless sensor network with one PAN coordinator surrounded by numbers of identical nodes within the radio coverage. The node density is sequentially simulated as 1,2,3,4,5,10,20,30,40,100,130 and 150 RDFs end-nodes, respectively. One of our provision network topology simulation with 40 ZigBee end-nodes is pictured in fig. 3. Figure 3: Example of star topology with 40 ZigBee end-nodes inside 100m2 room. We particularly interest in three performance parameters, the average end-to-end delay, the network output load and the probability of success. The end-to-end delay is the transmission delay between two consecutively received packets. The probability of success is the probability of the packets being successfully received during the CAP. In order to understand the impact of the protocol attributes, including the super-frame order, beacon order, maximum back-off number and the frame size, on the network performance, we set up four primary simulation scenarios as follows. (i) The purpose of the first scenario is to evaluate the impact of the network load. (ii) The second scenario is to evaluate the impact of super-frame order and beacon order. (iii) The third scenario is to evaluate the impact of the frame size. (iv) And the last scenario is to evaluate the impact of maximum back-off number. Unless it is mentioned differently, following settings apply to all the simulation scenarios. BO and SO are always set to equal Maximum Back-off Number is set to 4 Minimum Back-off Exponent is set to 3 Only acknowledge data frame are generated GTS are enabled MSDU Inter-arrival Time and MSDU Size are constants PERFORMANCE EVALUATION OF DATA TRANSPORT OVER DIFFERENT-NODE 95 DENSITY OF ZIGBEE SENSOR NETWORK – AN OPNET SIMULATION STUDY © 2020 Industrial University of Ho Chi Minh City Simulated period is 50 seconds Buffer size is 1000 bits 4.1 Impact of number of end devices In order to evaluate the impact of the network load on the performance of ZigBee wireless sensor network, the average delay, the probability of success and the network throughput are collected as functions of the number of end devices in the network. In this scenario, each identical end device sends packets with a packet size of 100 bits (MSDU size) and a constant generation interval (MSDU Inter-arrival Time) of 0.1s during the CAP. The GTS is enabled from the 0.2s to 1.5s of the simulation period and it sends packets with a packet size of 100 bits and a constant generation interval of 0.2s during the CFP. The super-frame order and beacon order are set to 7. The arrival data rate is defined as MSDU size over MSDU Inter-arrival Time. Thus, the arrival data rates are 1kbps during the CAP and 0.5kbps during the CFP. Since GTS is enabled only at the beginning of the simulation period (from 0.2s to 1.5s), the arrival data rate is 1kbps after 1.5s. When we increase the number of end devices in the network, we increase the network load accordingly. Figures 4a and 4b present the impact on the end-to-end delay and the network throughput when step- by-step increasing the end-device number from 1 to 150. Figures 4a and 4b show that initially both the network throughputs and the delays increase with the number of end devices. When the number of end devices reaches 50, the curves become flat. The floor level of the network throughput is about 32kbps and the delay is about 0.016s. The floor level is determined by the data rate limitation of the IEEE802.15.4. Although theoretically the IEEE802.15.4 protocol can provide a capacity of 250kbps, our simulation results show that in fact the data rate is limited to 32kbps, which is 12.8% of the theoretical value. To further investigate the difference between the theoretical value and the simulation value, the percentage of successful acknowledged transmission packets are captured. As shown in fig. 5, the percentage is 100% when there is only one end device in the network. When more end devices are added to the network, more packets are dropped during the transmission due to the heavy network load and the limited buffer size. From the simulation result, we can observe that a network with 150 end nodes (each node has a data arrival rate of 1kbps) is able to successfully transmit 75% of the generated data. Figure 4a: Average delays as a function of the number of end devices. Figure 4b: Average network throughputs as a function of the number of end devices. 96 PERFORMANCE EVALUATION OF DATA TRANSPORT OVER DIFFERENT-NODE DENSITY OF ZIGBEE SENSOR NETWORK – AN OPNET SIMULATION STUDY © 2020 Industrial University of Ho Chi Minh City Figure 5: Average successful acknowledged transmission packets for different numbers of end nodes. 4.2 Impact of SO and BO The objective of this part is to evaluate the impact of super-frame order and beacon order on the performance of slotted CSMA/CA. The results are collected based on different values of SO and BO. We consider a network with 20 end devices and each of them has a data arrival rate of 3.5kbps. From fig. 6a, as we expected, low SO values produce lower network throughput. This is basically due to two reasons. First, the overhead of the beacon frame is more significant for lower SO values because beacons are more frequent. Second, in case of lower SO values, there are more collisions at the start of each super-frame. Furthermore, although the increase in the super-frame order from 0 until 4 has significant impact on the network throughput, the increase of SO from 5 to 14 has little impact on the network throughput. If SO equals to 4 as a threshold value, for SO values above the threshold, the probability of collisions is quite low. As a result, it leads to higher network throughputs but no further increases. Figure 6a: Network output load as a function of different BO, SO values. Figure 6b: The average delay as a function of different SO, BO values. PERFORMANCE EVALUATION OF DATA TRANSPORT OVER DIFFERENT-NODE 97 DENSITY OF ZIGBEE SENSOR NETWORK – AN OPNET SIMULATION STUDY © 2020 Industrial University of Ho Chi Minh City Figure 6b shows the average delay as a function of different SO, BO values. It is basically consistent with the network throughputs. There are more collisions in the beginning of a new super-frame due to the high probability of Clear Channel Assessment (CCA). Therefore, the back-off delays will not increase too much due to this frequent collision in case of low SO values. For high super-frame orders, the back-off algorithm will have less impact and the end-to-end delay will not be further increased. 4.3 Impact of packet size This part studies the impact of packet size on the performance of slotted CSMA/CA. According to the IEEE802.15.4 standard specification, the size of the MAC header is 104 bits because only 16-bit short addresses are used for communication. The maximum allowed size of the overall frame is equal to 1016 bits. Thus, the MSDU size is limited to 912 bits. In order to generate the constant data arrival rate when varying the MSDU size, for each configuration, we vary the inter-arrival times as well. The following table shows the corresponding settings of MSDU sizes and intervals. Table 2: MSDU size and interval settings MSDU Size (bit) MSDU Interval (s) Data Arrival Rate (bps) 100 0.2 500 200 0.4 500 300 0.6 500 400 0.8 500 500 1 500 600 1.2 500 700 1.4 500 800 1.6 500 900 1.8 500 As shown in fig. 7, the network output loads increase when large MSDUs are generated. When the MSDU size is small, the impact of the MAC header on the network throughputs is significant. We can observe that there is only 21kbps network throughput when the MSDU size is 100 bits as compared to the 36kbps network throughput when the MSDU size is 900 bits. A great amount of the network bandwidth is wasted by carrying MAC headers. When the MSDU size becomes larger, we need less MAC headers to frame the generated data. Consequently, more bandwidth is used to carrying data and results in a higher network throughput. Figure 7: Network output load as a function of packet size. 4.4 Impact of maximum Back-off Number This part investigates the impact of maximum back-off number on the performance of slotted CSMA/CA. Our preliminary studies show that the maximum back-off number has no impact on the network performance when the network load is light because the retransmission occurs very quickly. In order to study the impact on a heavy network, we consider a network with 30 end nodes and each node sends packets with a data arrival rate of 0.7kbps. As shown in fig. 8a, the delay is about 0.005s when no retransmission is allowed. Then it increases abruptly to reach 0.03s when five retransmissions are allowed. Therefore, we 98 PERFORMANCE EVALUATION OF DATA TRANSPORT OVER DIFFERENT-NODE DENSITY OF ZIGBEE SENSOR NETWORK – AN OPNET SIMULATION STUDY © 2020 Industrial University of Ho Chi Minh City can conclude that the node has to wait for a longer time before attempting to retransmit in case of heavy traffic load. Figure 8b shows the impact on the network output load when increasing the maximum back-off number. We can observe that if the maximum back-off number becomes larger (bigger than 1) the network output load reaches a higher level. When we use a small back-off value, such as 0 or 1, all the nodes which sense a collision will try to retransmit after a short interval. Consequently, the collision probability is high and the packets may be dropped. When a high back-off value is used, the retransmission interval becomes longer and as a result, the total number of successful transmissions increases. 5 CONCLUSIONS In this paper we have evaluated the performance of the slotted CSMA/CA mechanism deployed by the IEEE802.15.4 protocol in beacon-enabled mode. We built a simulation environment to evaluate the impact of the following parameters on the performance of slotted CSMA/CA: (i) the network load, (ii) the beacon order and the super-frame order, (iii) the packet size, and (iv) the maximum back-off number. The simulation results show that that high super-frame orders provide better network throughput than lower super-frame orders. On the other hand, low SO values result in lower average delays. The MAC overheads on small MSDUs are more significant than the overheads on large MSDUs. The back-off mechanism results in longer delays when the network traffic is heavy. The actual data transmission rate of the IEEE802.15.4 protocol cannot reach the theoretical value of 250kbps due to the finite buffer size and traffic collisions. REFERENCES [1] Liu, Yongkang, et al. “Wireless Network Design for Emerging IoT Applications: Reference Framework and Use Cases”, Proceedings of the IEEE 107.6 (2019): 1166-1192. [2] Arora, Vishal Kumar, et al. “On QoS evaluation for ZigBee incorporated Wireless Sensor Network (IEEE802.15.4) using mobile sensor nodes”, Journal of King Saud University-Computer and Information Sciences (2018). [3] Mishra, Rakesh Kumar, et al. “An Addressing Scheme for Massive Sensor Networks”, IFIP International Conference on Computer Information Systems and Industrial Management. Springer, Cham, 2019. [4] OPNET Technologies, Inc., Opnet Modeler, [5] Chen, Min, Yiming Miao, and Iztok Humar. “Introduction to OPNET Network Simulation”. OPNET IoT Simulation. Springer, Singapore, 2019. 77-153. [6] Chen, M.: OPNET Network Simulation, Press of Tsinghua University, ISBN 7-302-08232-4 (2004) [7] National Institute of Standards and Technology (NIST), [8] IEEE 802.15.4 OPNET simulation model, [9] Mekki, Kais, et al. “A comparative study of LPWAN technologies for large-scale IoT deployment”, ICT express 5.1 (2019): 1-7. Figure 8a: Simulation values of delay as a function of maximum back-off number Figure 8b: Simulation values of Network Output Load as a function of maximum back-off number PERFORMANCE EVALUATION OF DATA TRANSPORT OVER DIFFERENT-NODE 99 DENSITY OF ZIGBEE SENSOR NETWORK – AN OPNET SIMULATION STUDY © 2020 Industrial University of Ho Chi Minh City [10] IEEE 802.15.4 Standard-2003, “Part 15.4: Wireless Medium Access Control (MAC) and Physical layer (PHY) Specifications for Low Rate Wireless Personal Area Networks (LR WPANs)”, IEEE SA Standards Board, 2003 [11] ZigBee Alliance, “ZigBee Specification”, ĐÁNH GIÁ HIỆU SUẤT VẬN CHUYỂN DỮ LIỆU QUA MẠNG CẢM BIẾN ZIGBEE VỚI MẬT ĐỘ NODE KHÁC NHAU- NGHIÊN CỨU TRÊN MÔ PHỎNG OPNET Tóm tắt. Trong bài báo này, chúng tôi phân tích hiệu suất của mạng cảm biến không dây có số lượng node khác nhau hoạt động theo tiêu chuẩn IEEE802.15.4 với chế độ beacon. Nguyên nhân đánh giá theo chế độ beacon là do tính linh hoạt đối với nhiều ứng dụng trong mạng cảm biến không dây (WSN) so với chế độ non-beacon. Phân tích dựa trên mô hình chính xác trong mô phỏng OPNET hỗ trợ cơ chế đa truy cập tránh xung đột (CSMA/CA) và khe thời gian được đảm bảo (GTS). Hiệu suất của mạng cảm biến CSMA/CA theo khe thời gian được đánh giá và phân tích thông qua việc cài đặt các thông số mạng khác nhau để hiểu tác động của các thuộc tính giao thức, bao gồm thứ tự siêu khung (SO), thứ tự beason (BO), kích thước gói dữ liệu và số lượng backoff tối đa. Thông qua kết quả mô phỏng, thông số SO lớn cung cấp thông lượng mạng tốt hơn, ngược lại dẫn đến độ phản hồi trung bình thấp hơn. Chúng tôi cũng nhận thấy rằng overhead trên MAC Service Data Unit (MSDU) nhỏ có ý nghĩa quan trọng hơn so với trên MSDU lớn. Và cơ chế backoff dẫn đến sự chậm trễ lâu hơn khi lưu lượng mạng tăng cao. Từ khóa. Mạng cảm biến không dây, mạng ZigBee, hiệu suất mạng. Ngày nhận bài: 30/03/2020 Ngày chấp nhận đăng: 17/08/2020
File đính kèm:
 performance_evaluation_of_data_transport_over_differentnode.pdf

