Modeling and simulate alcohol fermentation process by simulink
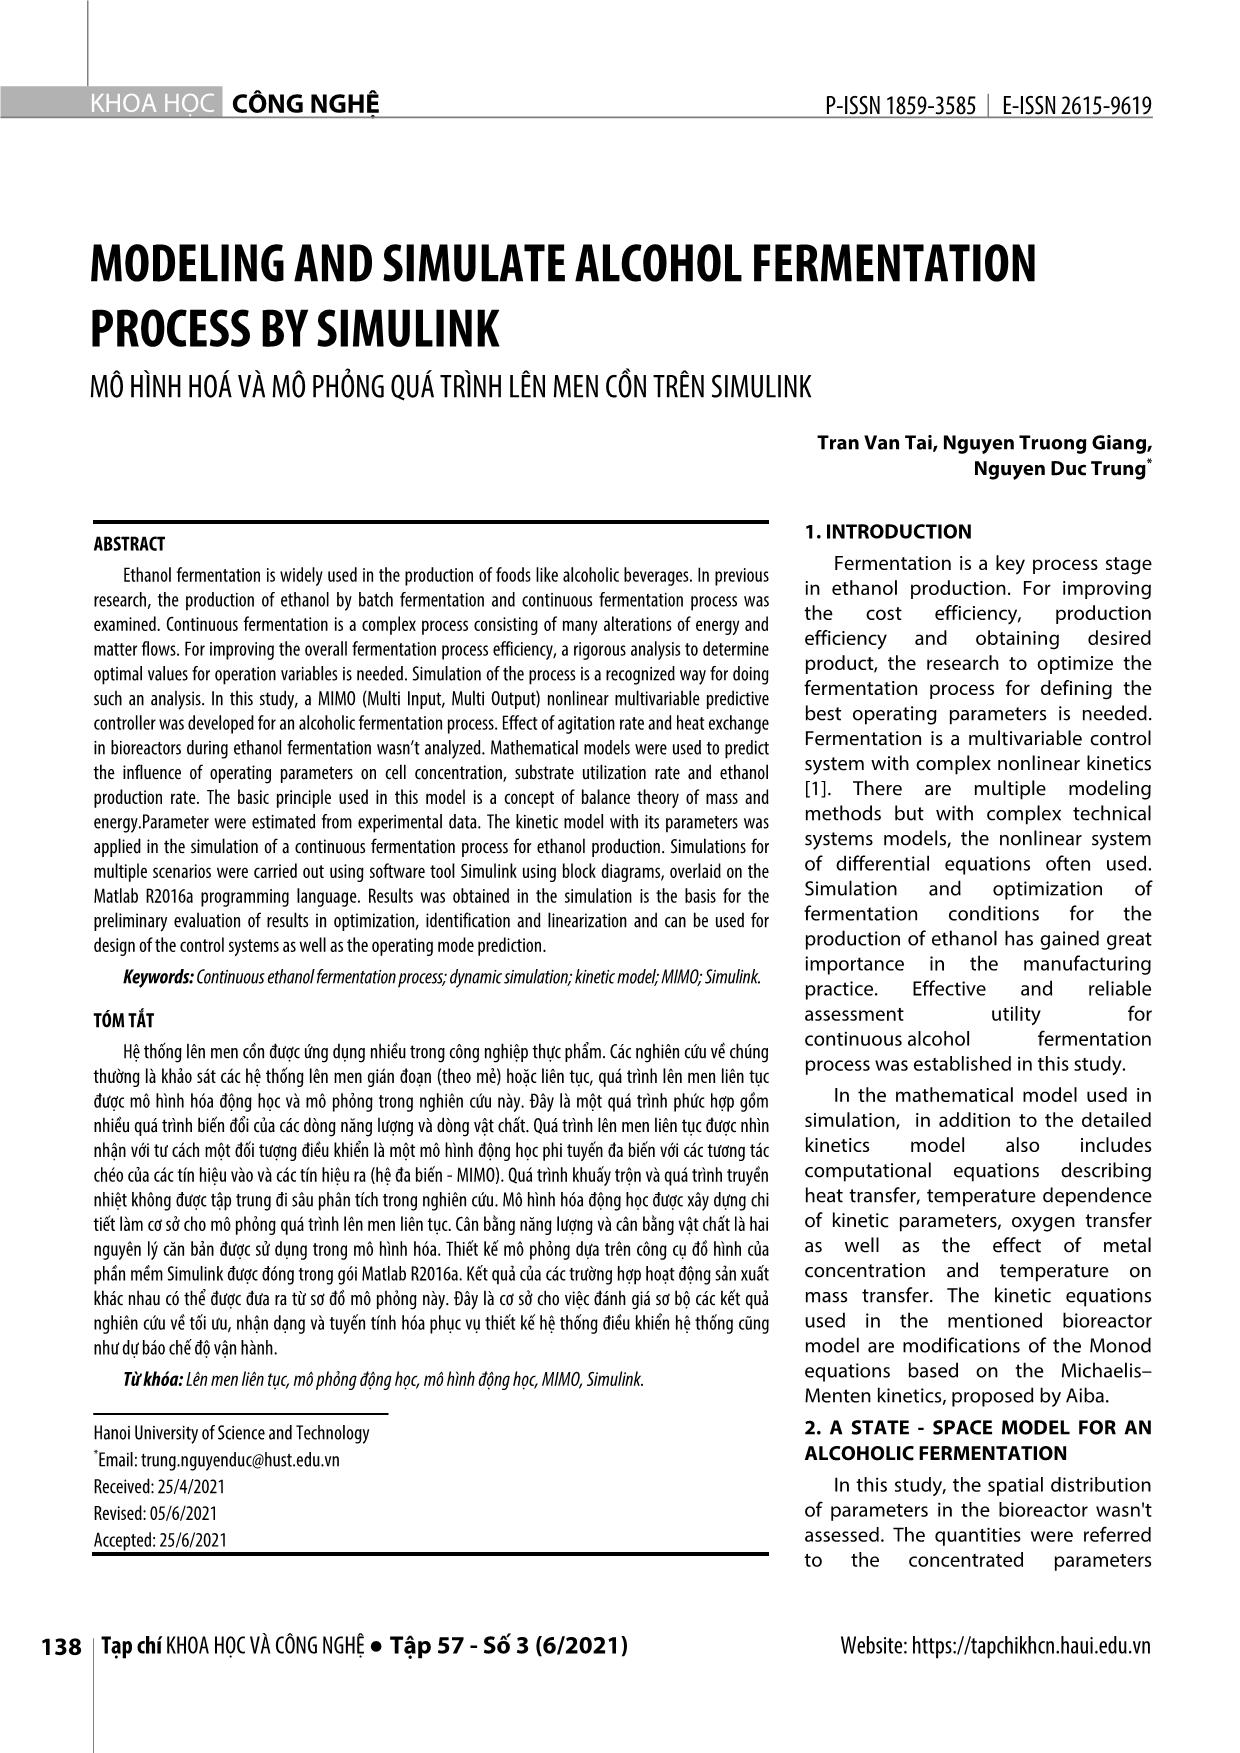
Ethanol fermentation is widely used in the production of foods like alcoholic beverages. In previous
research, the production of ethanol by batch fermentation and continuous fermentation process was
examined. Continuous fermentation is a complex process consisting of many alterations of energy and
matter flows. For improving the overall fermentation process efficiency, a rigorous analysis to determine
optimal values for operation variables is needed. Simulation of the process is a recognized way for doing
such an analysis. In this study, a MIMO (Multi Input, Multi Output) nonlinear multivariable predictive
controller was developed for an alcoholic fermentation process. Effect of agitation rate and heat exchange
in bioreactors during ethanol fermentation wasn’t analyzed. Mathematical models were used to predict
the influence of operating parameters on cell concentration, substrate utilization rate and ethanol
production rate. The basic principle used in this model is a concept of balance theory of mass and
energy.Parameter were estimated from experimental data. The kinetic model with its parameters was
applied in the simulation of a continuous fermentation process for ethanol production. Simulations for
multiple scenarios were carried out using software tool Simulink using block diagrams, overlaid on the
Matlab R2016a programming language. Results was obtained in the simulation is the basis for the
preliminary evaluation of results in optimization, identification and linearization and can be used for
design of the control systems as well as the operating mode prediction.
Trang 1
Trang 2
Trang 3
Trang 4
Trang 5
Tóm tắt nội dung tài liệu: Modeling and simulate alcohol fermentation process by simulink
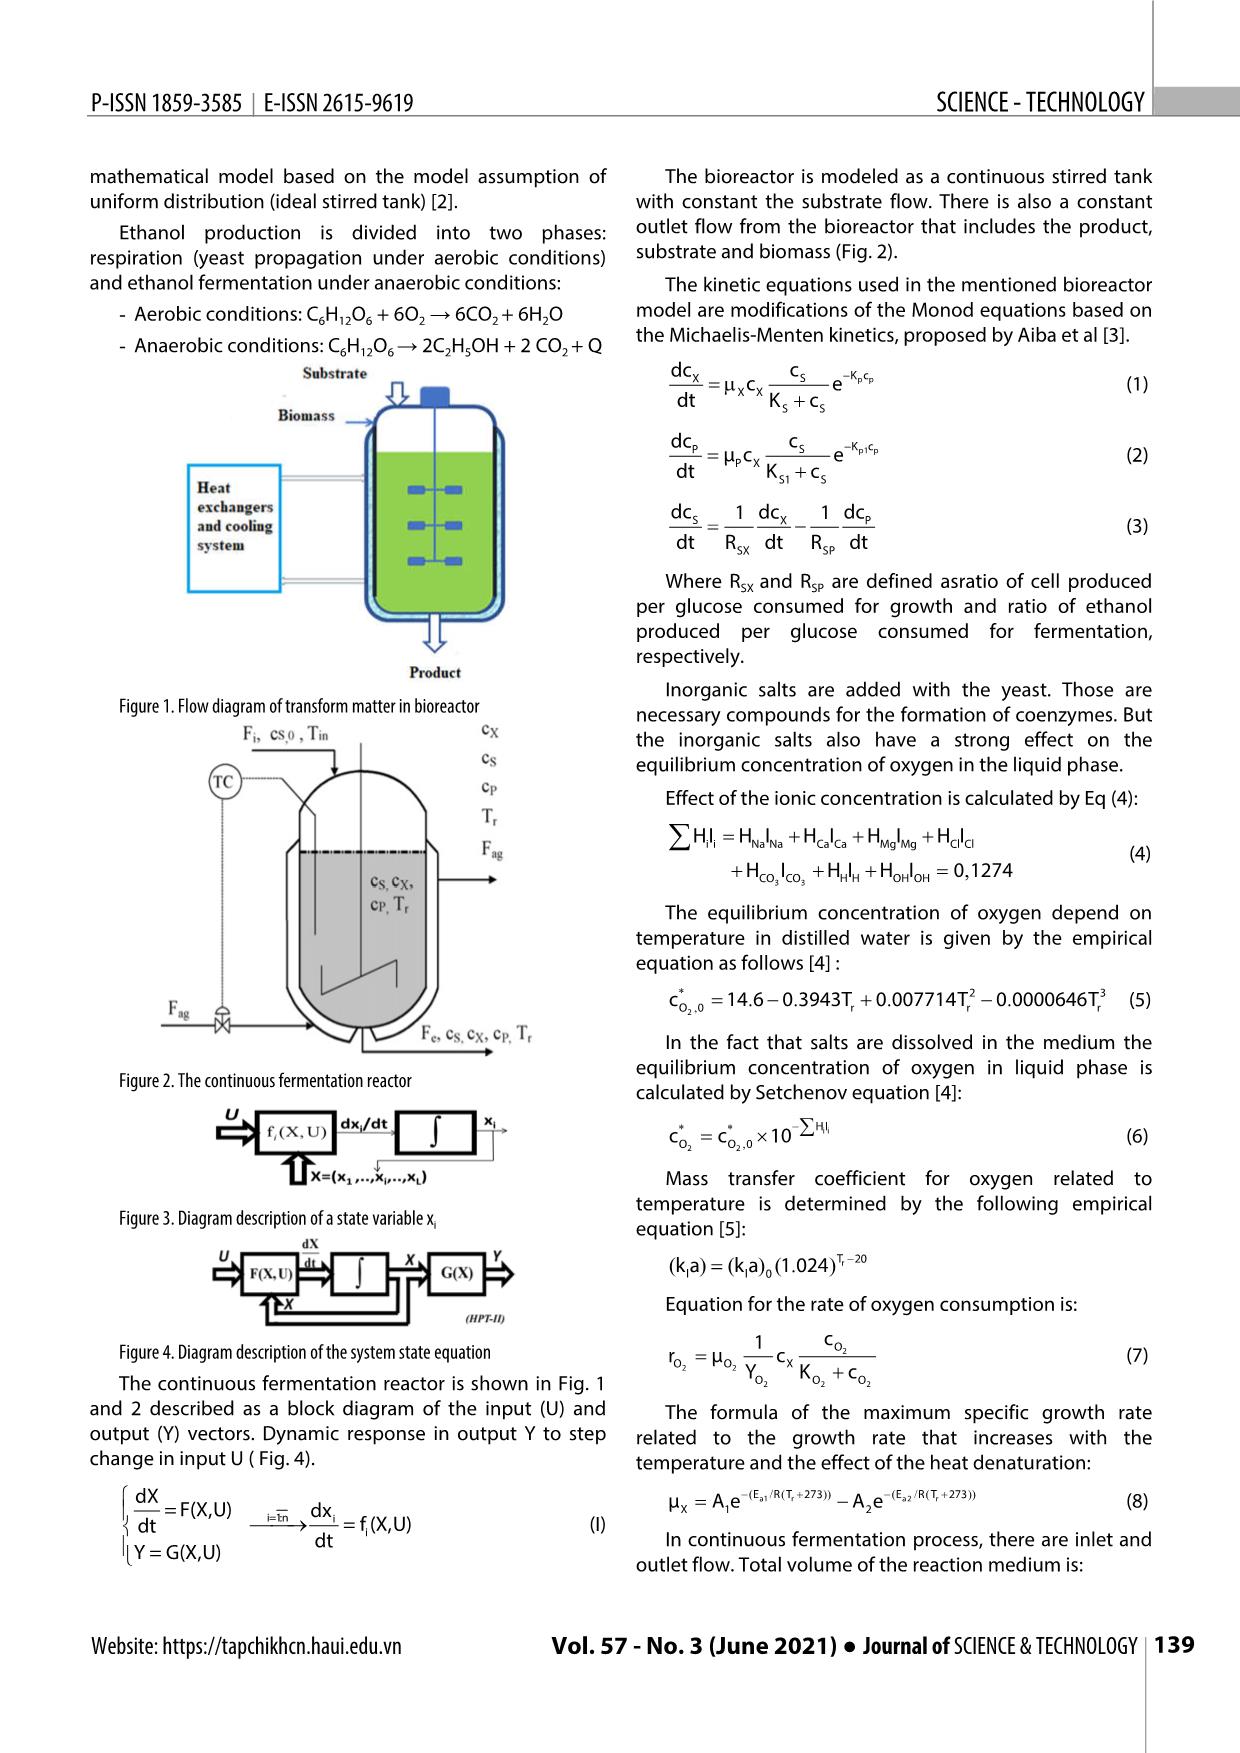
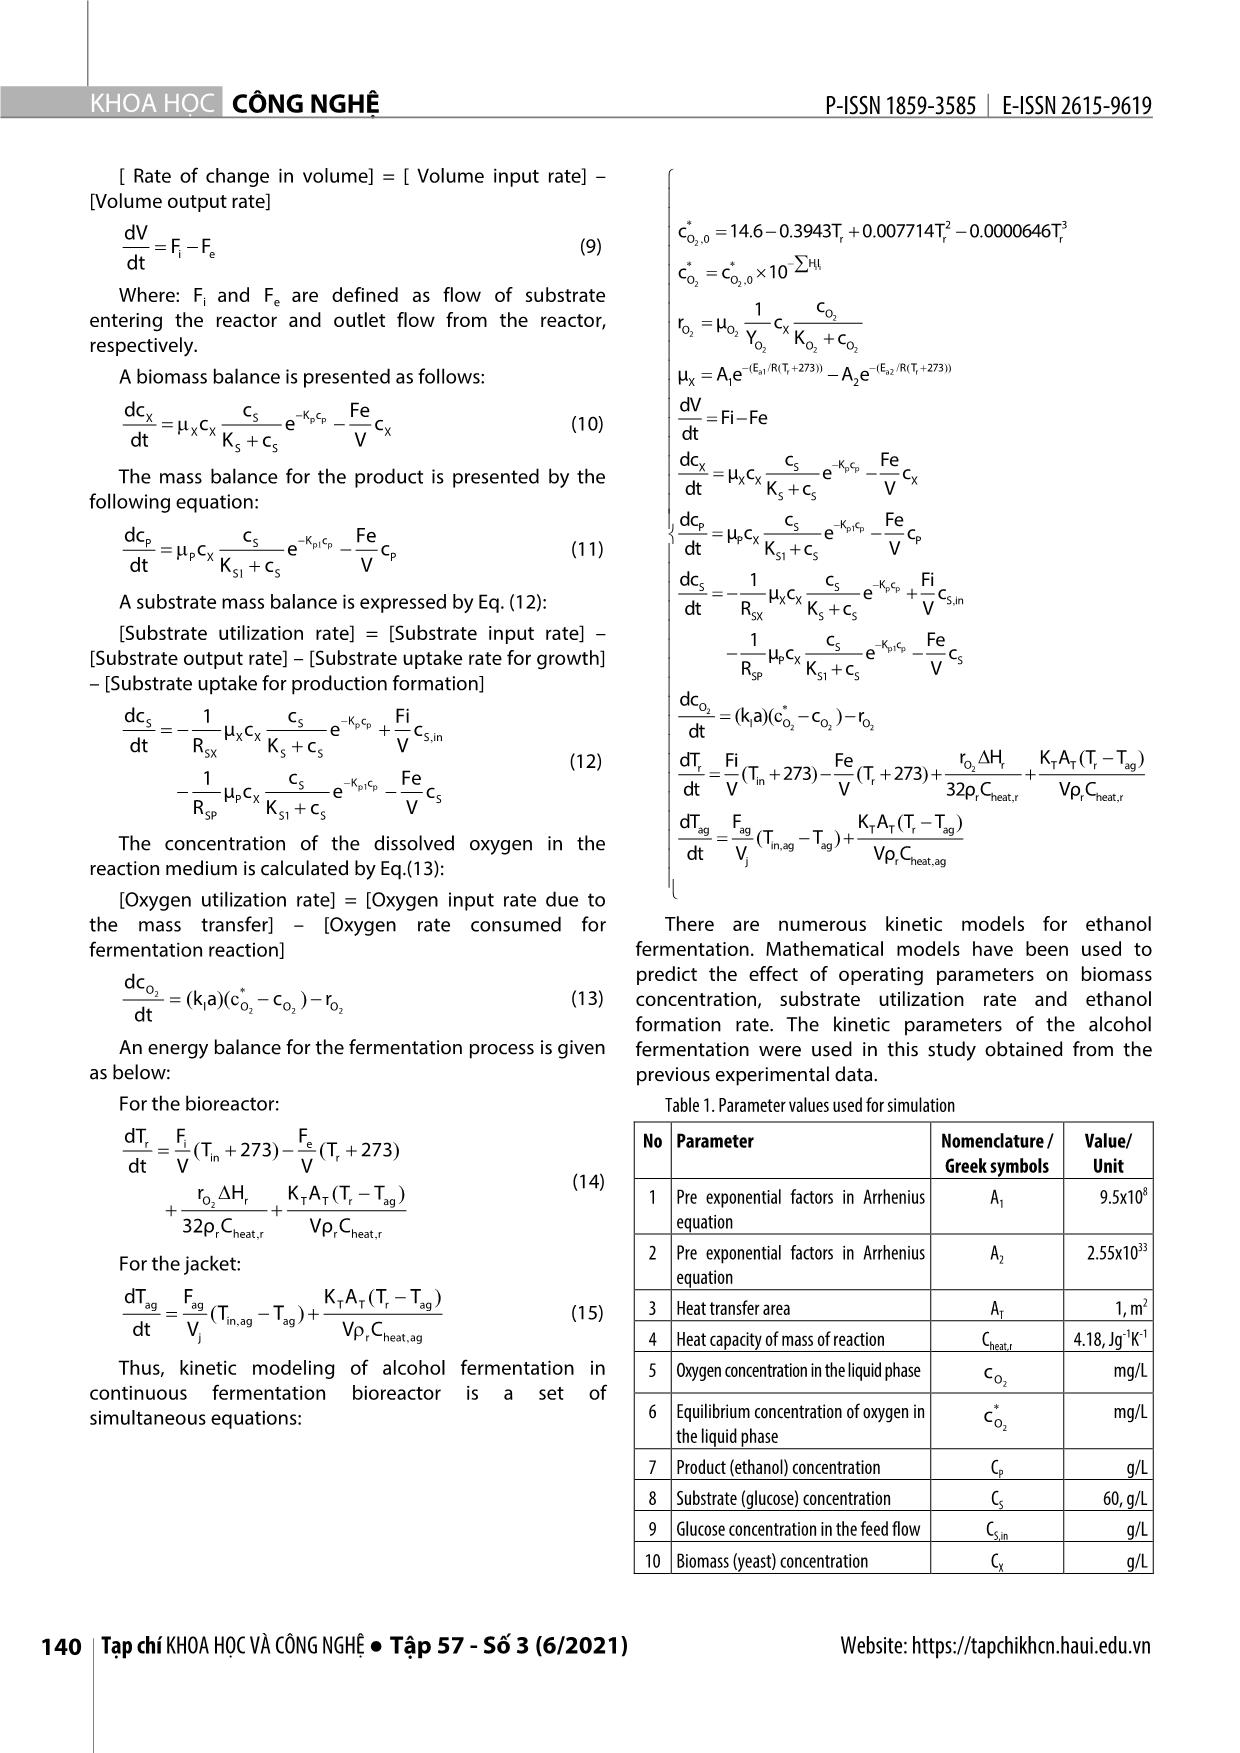
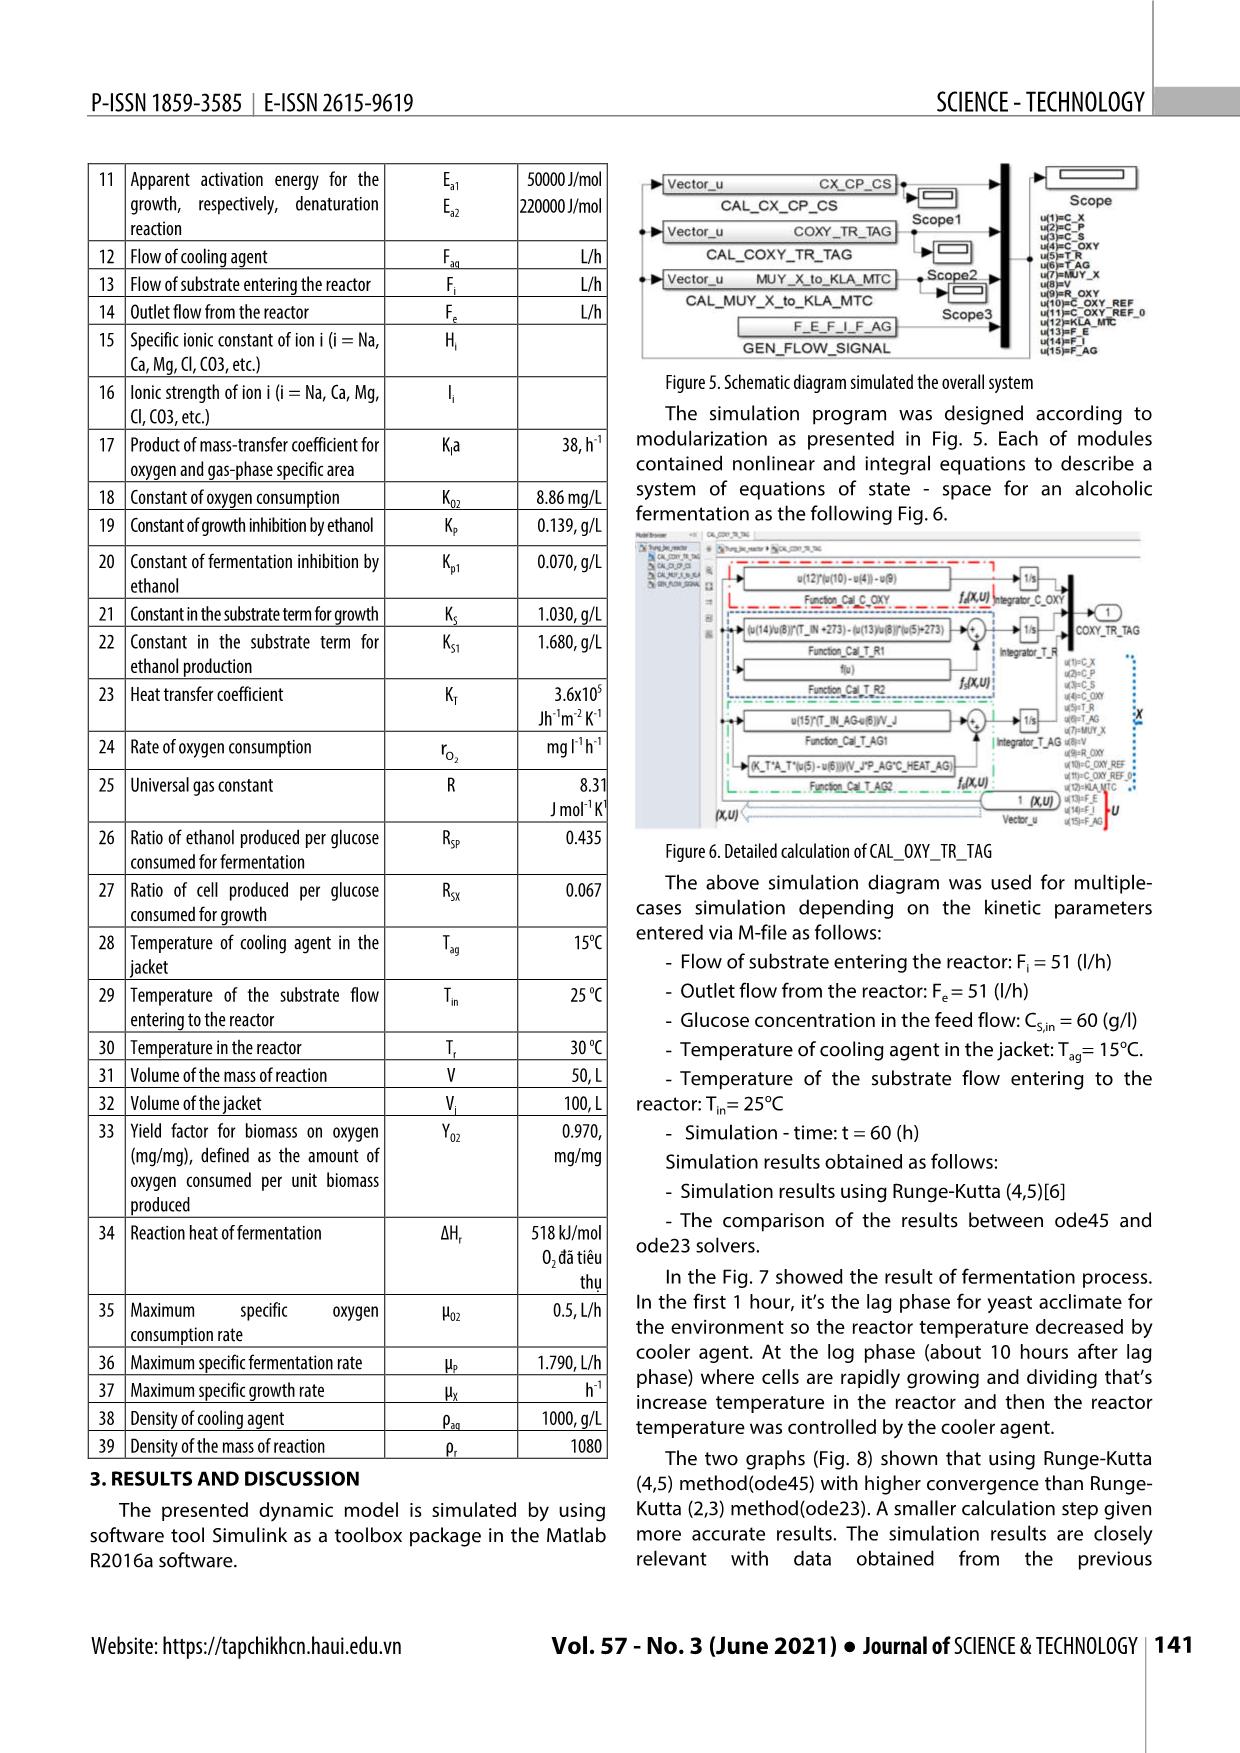
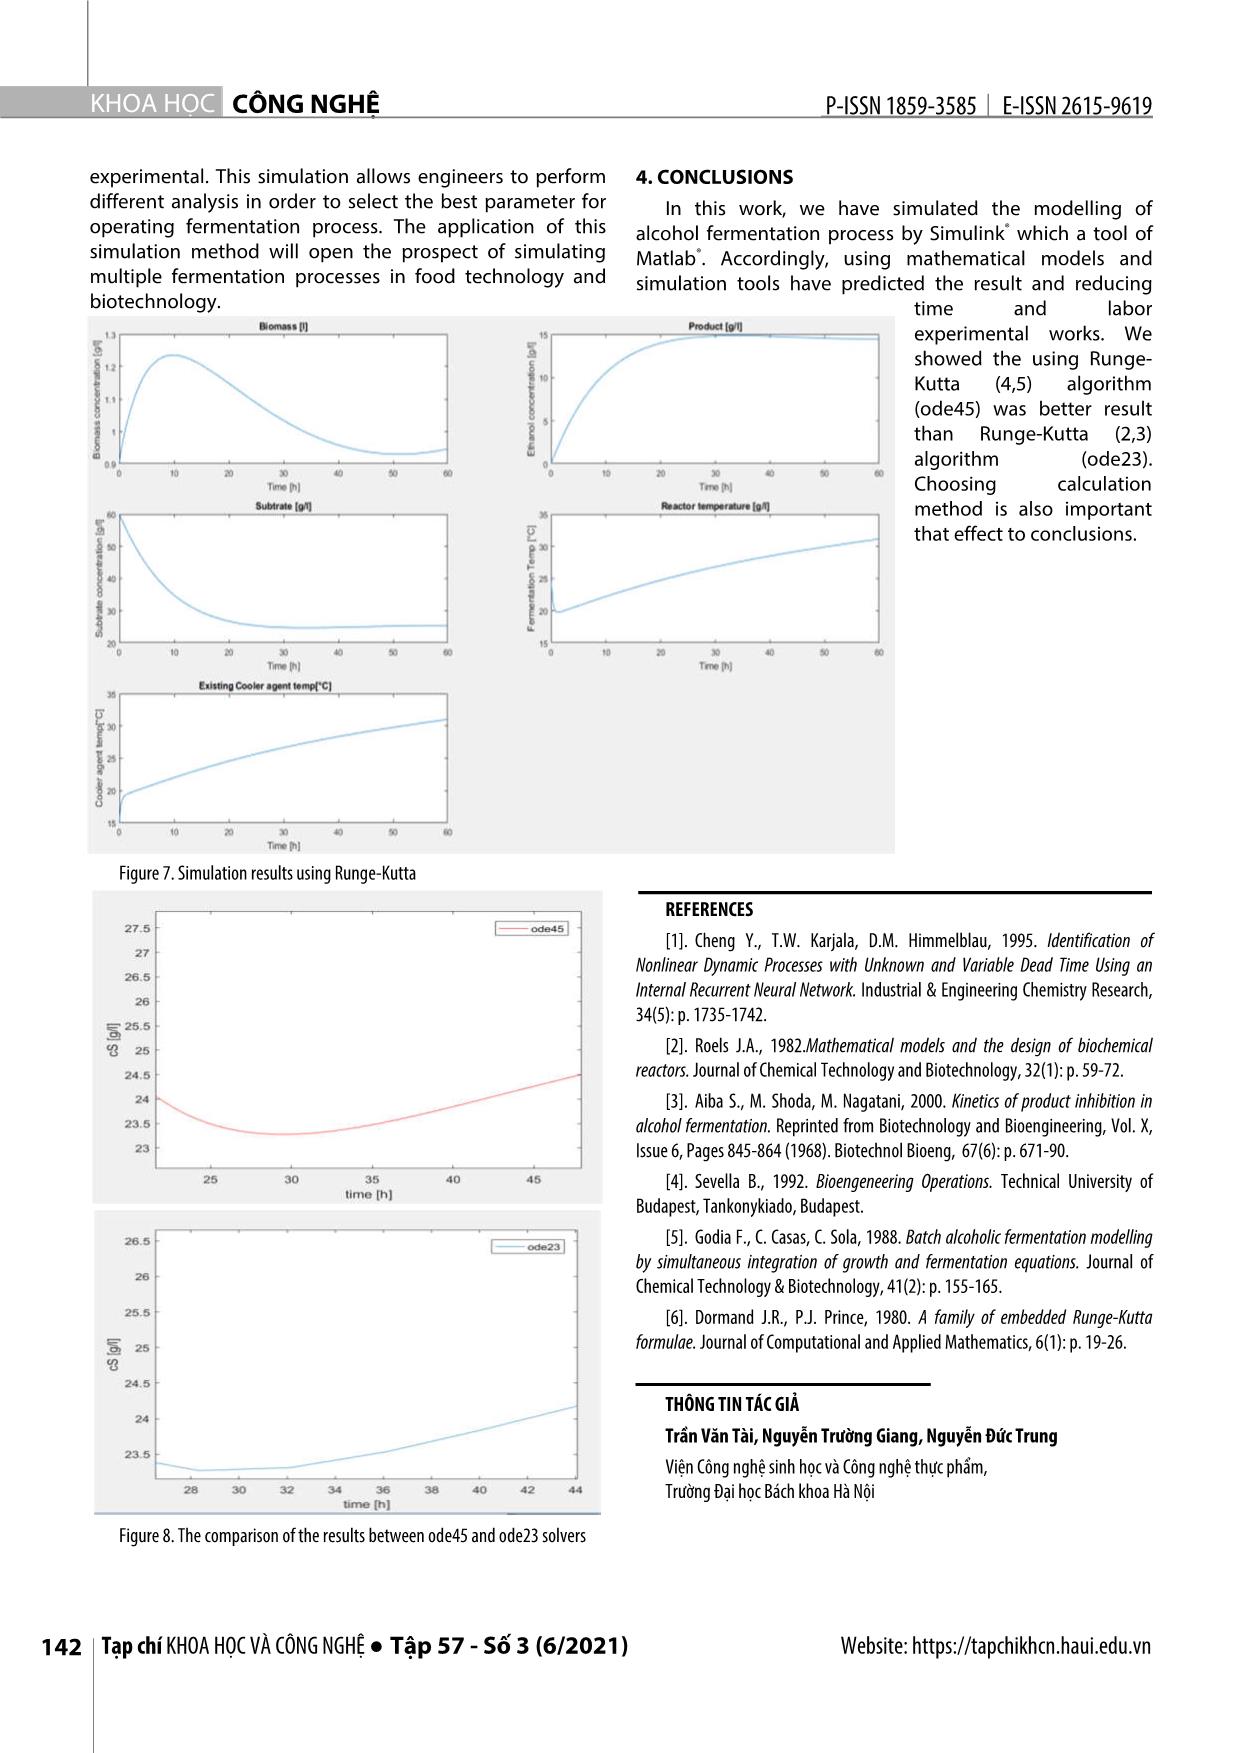
n men cồn được ứng dụng nhiều trong công nghiệp thực phẩm. Các nghiên cứu về chúng process was established in this study. thường là khảo sát các hệ thống lên men gián đoạn (theo mẻ) hoặc liên tục, quá trình lên men liên tục được mô hình hóa động học và mô phỏng trong nghiên cứu này. Đây là một quá trình phức hợp gồm In the mathematical model used in nhiều quá trình biến đổi của các dòng năng lượng và dòng vật chất. Quá trình lên men liên tục được nhìn simulation, in addition to the detailed nhận với tư cách một đối tượng điều khiển là một mô hình động học phi tuyến đa biến với các tương tác kinetics model also includes chéo của các tín hiệu vào và các tín hiệu ra (hệ đa biến - MIMO). Quá trình khuấy trộn và quá trình truyền computational equations describing nhiệt không được tập trung đi sâu phân tích trong nghiên cứu. Mô hình hóa động học được xây dựng chi heat transfer, temperature dependence tiết làm cơ sở cho mô phỏng quá trình lên men liên tục. Cân bằng năng lượng và cân bằng vật chất là hai of kinetic parameters, oxygen transfer nguyên lý căn bản được sử dụng trong mô hình hóa. Thiết kế mô phỏng dựa trên công cụ đồ hình của as well as the effect of metal phần mềm Simulink được đóng trong gói Matlab R2016a. Kết quả của các trường hợp hoạt động sản xuất concentration and temperature on khác nhau có thể được đưa ra từ sơ đồ mô phỏng này. Đây là cơ sở cho việc đánh giá sơ bộ các kết quả mass transfer. The kinetic equations nghiên cứu về tối ưu, nhận dạng và tuyến tính hóa phục vụ thiết kế hệ thống điều khiển hệ thống cũng used in the mentioned bioreactor như dự báo chế độ vận hành. model are modifications of the Monod Từ khóa: Lên men liên tục, mô phỏng động học, mô hình động học, MIMO, Simulink. equations based on the Michaelis– Menten kinetics, proposed by Aiba. Hanoi University of Science and Technology 2. A STATE - SPACE MODEL FOR AN *Email: trung.nguyenduc@hust.edu.vn ALCOHOLIC FERMENTATION Received: 25/4/2021 In this study, the spatial distribution Revised: 05/6/2021 of parameters in the bioreactor wasn't Accepted: 25/6/2021 assessed. The quantities were referred to the concentrated parameters 138 Tạp chí KHOA HỌC VÀ CÔNG NGHỆ ● Tập 57 - Số 3 (6/2021) Website: https://tapchikhcn.haui.edu.vn P-ISSN 1859-3585 E-ISSN 2615-9619 SCIENCE - TECHNOLOGY mathematical model based on the model assumption of The bioreactor is modeled as a continuous stirred tank uniform distribution (ideal stirred tank) [2]. with constant the substrate flow. There is also a constant Ethanol production is divided into two phases: outlet flow from the bioreactor that includes the product, respiration (yeast propagation under aerobic conditions) substrate and biomass (Fig. 2). and ethanol fermentation under anaerobic conditions: The kinetic equations used in the mentioned bioreactor - Aerobic conditions: C6H12O6 + 6O2 → 6CO2 + 6H2O model are modifications of the Monod equations based on the Michaelis-Menten kinetics, proposed by Aiba et al [3]. - Anaerobic conditions: C6H12O6 → 2C2H5OH + 2 CO2 + Q dcX cS Kp c p mXXc e (1) dt KSS c dcP cS Kp1 c p μPX c e (2) dt KS1 c S dc 1dc 1 dc S XP (3) dt RSX dt R SP dt Where RSX and RSP are defined asratio of cell produced per glucose consumed for growth and ratio of ethanol produced per glucose consumed for fermentation, respectively. Inorganic salts are added with the yeast. Those are Figure 1. Flow diagram of transform matter in bioreactor necessary compounds for the formation of coenzymes. But the inorganic salts also have a strong effect on the equilibrium concentration of oxygen in the liquid phase. Effect of the ionic concentration is calculated by Eq (4): HIHIHIHIHIi i Na Na Ca Ca Mg Mg Cl Cl (4) H I H I H I 0, 1274 CO3 CO 3 H H OH OH The equilibrium concentration of oxygen depend on temperature in distilled water is given by the empirical equation as follows [4] : * 2 3 c, 14.... 6 0 3943T 0 007714T 0 0000646T (5) O2 0 r r r In the fact that salts are dissolved in the medium the equilibrium concentration of oxygen in liquid phase is Figure 2. The continuous fermentation reactor calculated by Setchenov equation [4]: c** c 10 HIi i (6) O2 O 2 , 0 Mass transfer coefficient for oxygen related to temperature is determined by the following empirical Figure 3. Diagram description of a state variable x i equation [5]: Tr 20 ()()(.)kl a k l a 0 1 024 Equation for the rate of oxygen consumption is: 1 cO Figure 4. Diagram description of the system state equation r μ c 2 (7) OOX2 2 YOOO K c The continuous fermentation reactor is shown in Fig. 1 2 2 2 and 2 described as a block diagram of the input (U) and The formula of the maximum specific growth rate output (Y) vectors. Dynamic response in output Y to step related to the growth rate that increases with the change in input U ( Fig. 4). temperature and the effect of the heat denaturation: ( / ( )) ( / ( )) dX Ea1 R T r 273 E a2 R T r 273 μX A 1 e A 2 e (8) = F(X,U) i=1:n dx dt i = f (X,U) (I) dt i In continuous fermentation process, there are inlet and Y = G(X,U) outlet flow. Total volume of the reaction medium is: Website: https://tapchikhcn.haui.edu.vn Vol. 57 - No. 3 (June 2021) ● Journal of SCIENCE & TECHNOLOGY 139 KHOA H ỌC CÔNG NGHỆ P-ISSN 1859-3585 E-ISSN 2615-9619 [ Rate of change in volume] = [ Volume input rate] – [Volume output rate] c* 14.... 6 0 3943T 0 007714T2 0 0000646T 3 dV O2 , 0 r r r FFi e (9) dt c** c 10 HIi i O2 O 2 , 0 Where: Fi and Fe are defined as flow of substrate 1 cO entering the reactor and outlet flow from the reactor, r μ c 2 OOX2 2 Y K c respectively. OOO2 2 2 ( / ( )) ( / ( )) A biomass balance is presented as follows: μ A eEa1 R T r 273 A e E a2 R T r 273 X 1 2 dc c K c Fe dV X mcS ep p c (10) Fi Fe XXX dt dt KSS c V dc c K c Fe X S p p The mass balance for the product is presented by the μXXX c e c dt K c V following equation: SS dcP cS Kp1 c p Fe dc c K c Fe μPXP c e c P mcS ep1 p c (11) dt K c V PXP S1 S dt KSS1 c V dc1 c K c Fi SS μ c ep p c A substrate mass balance is expressed by Eq. (12): X X S, in dt RSX K S c S V [Substrate utilization rate] = [Substrate input rate] – 1c K c Fe S p1 p [Substrate output rate] – [Substrate uptake rate for growth] μPXS c e c RSP K S1 c S V – [Substrate uptake for production formation] dc O2 * dc1 c K c Fi (k a )(c c ) r SS μ c ep p c dt l O2 O 2 O 2 dt RX X K c V S, in SX S S rD H KATT() (12) dTr Fi Fe O2 r T T r ag 1c K c Fe ()()Tin 273 T r 273 μ cS ep1 p c dt V V 32ρ C Vρ C PXS r heat,, r r heat r RSP K S1 c S V dTag F ag K T A T( T r T ag ) ()TTin, ag ag The concentration of the dissolved oxygen in the dt V Vρ C reaction medium is calculated by Eq.(13): j r heat, ag [Oxygen utilization rate] = [Oxygen input rate due to the mass transfer] – [Oxygen rate consumed for There are numerous kinetic models for ethanol fermentation reaction] fermentation. Mathematical models have been used to dc predict the effect of operating parameters on biomass O2 (k a )(c* c ) r (13) concentration, substrate utilization rate and ethanol l O2 O 2 O 2 dt formation rate. The kinetic parameters of the alcohol An energy balance for the fermentation process is given fermentation were used in this study obtained from the as below: previous experimental data. For the bioreactor: Table 1. Parameter values used for simulation dT F F r i ()()T 273 e T 273 No Parameter Nomenclature / Value/ dt Vin V r Greek symbols Unit (14) 8 rOD H r KATTT T() r ag 1 Pre exponential factors in Arrhenius A 9.5x10 2 1 equation 32ρr C heat,, r Vρ r C heat r 2 Pre exponential factors in Arrhenius A 2.55x1033 For the jacket: 2 equation dT F K A() T T ag ag T T r ag 3 Heat transfer area A 1, m2 ()TTin, ag ag (15) T dt Vj V r C heat, ag -1 -1 4 Heat capacity of mass of reaction Cheat,r 4.18, Jg K Thus, kinetic modeling of alcohol fermentation in 5 Oxygen concentration in the liquid phase cO mg/L continuous fermentation bioreactor is a set of 2 6 Equilibrium concentration of oxygen in * mg/L simultaneous equations: cO the liquid phase 2 7 Product (ethanol) concentration CP g/L 8 Substrate (glucose) concentration CS 60, g/L 9 Glucose concentration in the feed flow CS,in g/L 10 Biomass (yeast) concentration CX g/L 140 Tạp chí KHOA HỌC VÀ CÔNG NGHỆ ● Tập 57 - Số 3 (6/2021) Website: https://tapchikhcn.haui.edu.vn P-ISSN 1859-3585 E-ISSN 2615-9619 SCIENCE - TECHNOLOGY 11 Apparent activation energy for the Ea1 50000 J/mol growth, respectively, denaturation Ea2 220000 J/mol reaction 12 Flow of cooling agent Fag L/h 13 Flow of substrate entering the reactor Fi L/h 14 Outlet flow from the reactor Fe L/h 15 Specific ionic constant of ion i (i = Na, Hi Ca, Mg, Cl, CO3, etc.) Figure 5. Schematic diagram simulated the overall system 16 Ionic strength of ion i (i = Na, Ca, Mg, Ii Cl, CO3, etc.) The simulation program was designed according to -1 modularization as presented in Fig. 5. Each of modules 17 Product of mass-transfer coefficient for Kla 38, h oxygen and gas-phase specific area contained nonlinear and integral equations to describe a 18 Constant of oxygen consumption K 8.86 mg/L system of equations of state - space for an alcoholic O2 fermentation as the following Fig. 6. 19 Constant of growth inhibition by ethanol KP 0.139, g/L 20 Constant of fermentation inhibition by Kp1 0.070, g/L ethanol 21 Constant in the substrate term for growth KS 1.030, g/L 22 Constant in the substrate term for KS1 1.680, g/L ethanol production 5 23 Heat transfer coefficient KT 3.6x10 Jh-1m-2 K-1 24 Rate of oxygen consumption r mg l-1 h-1 O2 25 Universal gas constant R 8.31 J mol-1 K1 26 Ratio of ethanol produced per glucose R 0.435 SP Figure 6. Detailed calculation of CAL_OXY_TR_TAG consumed for fermentation The above simulation diagram was used for multiple- 27 Ratio of cell produced per glucose RSX 0.067 consumed for growth cases simulation depending on the kinetic parameters o entered via M-file as follows: 28 Temperature of cooling agent in the Tag 15 C jacket - Flow of substrate entering the reactor: Fi = 51 (l/h) o - 29 Temperature of the substrate flow Tin 25 C Outlet flow from the reactor: Fe = 51 (l/h) entering to the reactor - Glucose concentration in the feed flow: CS,in = 60 (g/l) o o 30 Temperature in the reactor Tr 30 C - Temperature of cooling agent in the jacket: Tag= 15 C. 31 Volume of the mass of reaction V 50, L - Temperature of the substrate flow entering to the o 32 Volume of the jacket Vj 100, L reactor: Tin= 25 C 33 Yield factor for biomass on oxygen YO2 0.970, - Simulation - time: t = 60 (h) (mg/mg), defined as the amount of mg/mg Simulation results obtained as follows: oxygen consumed per unit biomass - Simulation results using Runge-Kutta (4,5)[6] produced - The comparison of the results between ode45 and 34 Reaction heat of fermentation ∆H 518 kJ/mol r ode23 solvers. O2 đã tiêu thụ In the Fig. 7 showed the result of fermentation process. In the first 1 hour, it’s the lag phase for yeast acclimate for 35 Maximum specific oxygen μO2 0.5, L/h consumption rate the environment so the reactor temperature decreased by cooler agent. At the log phase (about 10 hours after lag 36 Maximum specific fermentation rate μ 1.790, L/h P phase) where cells are rapidly growing and dividing that’s 37 Maximum specific growth rate μ h-1 X increase temperature in the reactor and then the reactor 38 Density of cooling agent ρag 1000, g/L temperature was controlled by the cooler agent. 39 Density of the mass of reaction ρ 1080 r The two graphs (Fig. 8) shown that using Runge-Kutta 3. RESULTS AND DISCUSSION (4,5) method(ode45) with higher convergence than Runge- The presented dynamic model is simulated by using Kutta (2,3) method(ode23). A smaller calculation step given software tool Simulink as a toolbox package in the Matlab more accurate results. The simulation results are closely R2016a software. relevant with data obtained from the previous Website: https://tapchikhcn.haui.edu.vn Vol. 57 - No. 3 (June 2021) ● Journal of SCIENCE & TECHNOLOGY 141 KHOA H ỌC CÔNG NGHỆ P-ISSN 1859-3585 E-ISSN 2615-9619 experimental. This simulation allows engineers to perform 4. CONCLUSIONS different analysis in order to select the best parameter for In this work, we have simulated the modelling of operating fermentation process. The application of this alcohol fermentation process by Simulink® which a tool of simulation method will open the prospect of simulating Matlab®. Accordingly, using mathematical models and multiple fermentation processes in food technology and simulation tools have predicted the result and reducing biotechnology. time and labor experimental works. We showed the using Runge- Kutta (4,5) algorithm (ode45) was better result than Runge-Kutta (2,3) algorithm (ode23). Choosing calculation method is also important that effect to conclusions. Figure 7. Simulation results using Runge-Kutta REFERENCES [1]. Cheng Y., T.W. Karjala, D.M. Himmelblau, 1995. Identification of Nonlinear Dynamic Processes with Unknown and Variable Dead Time Using an Internal Recurrent Neural Network. Industrial & Engineering Chemistry Research, 34(5): p. 1735-1742. [2]. Roels J.A., 1982.Mathematical models and the design of biochemical reactors. Journal of Chemical Technology and Biotechnology, 32(1): p. 59-72. [3]. Aiba S., M. Shoda, M. Nagatani, 2000. Kinetics of product inhibition in alcohol fermentation. Reprinted from Biotechnology and Bioengineering, Vol. X, Issue 6, Pages 845-864 (1968). Biotechnol Bioeng, 67(6): p. 671-90. [4]. Sevella B., 1992. Bioengeneering Operations. Technical University of Budapest, Tankonykiado, Budapest. [5]. Godia F., C. Casas, C. Sola, 1988. Batch alcoholic fermentation modelling by simultaneous integration of growth and fermentation equations. Journal of Chemical Technology & Biotechnology, 41(2): p. 155-165. [6]. Dormand J.R., P.J. Prince, 1980. A family of embedded Runge-Kutta formulae. Journal of Computational and Applied Mathematics, 6(1): p. 19-26. THÔNG TIN TÁC GIẢ Trần Văn Tài, Nguyễn Trường Giang, Nguyễn Đức Trung Viện Công nghệ sinh học và Công nghệ thực phẩm, Trường Đại học Bách khoa Hà Nội Figure 8. The comparison of the results between ode45 and ode23 solvers 142 Tạp chí KHOA HỌC VÀ CÔNG NGHỆ ● Tập 57 - Số 3 (6/2021) Website: https://tapchikhcn.haui.edu.vn
File đính kèm:
 modeling_and_simulate_alcohol_fermentation_process_by_simuli.pdf

