Impacts of rubber plantation on diversity of understory vegetation and soil animals in bao lam rubber enterprise, Bao Lam district, Lam Dong province
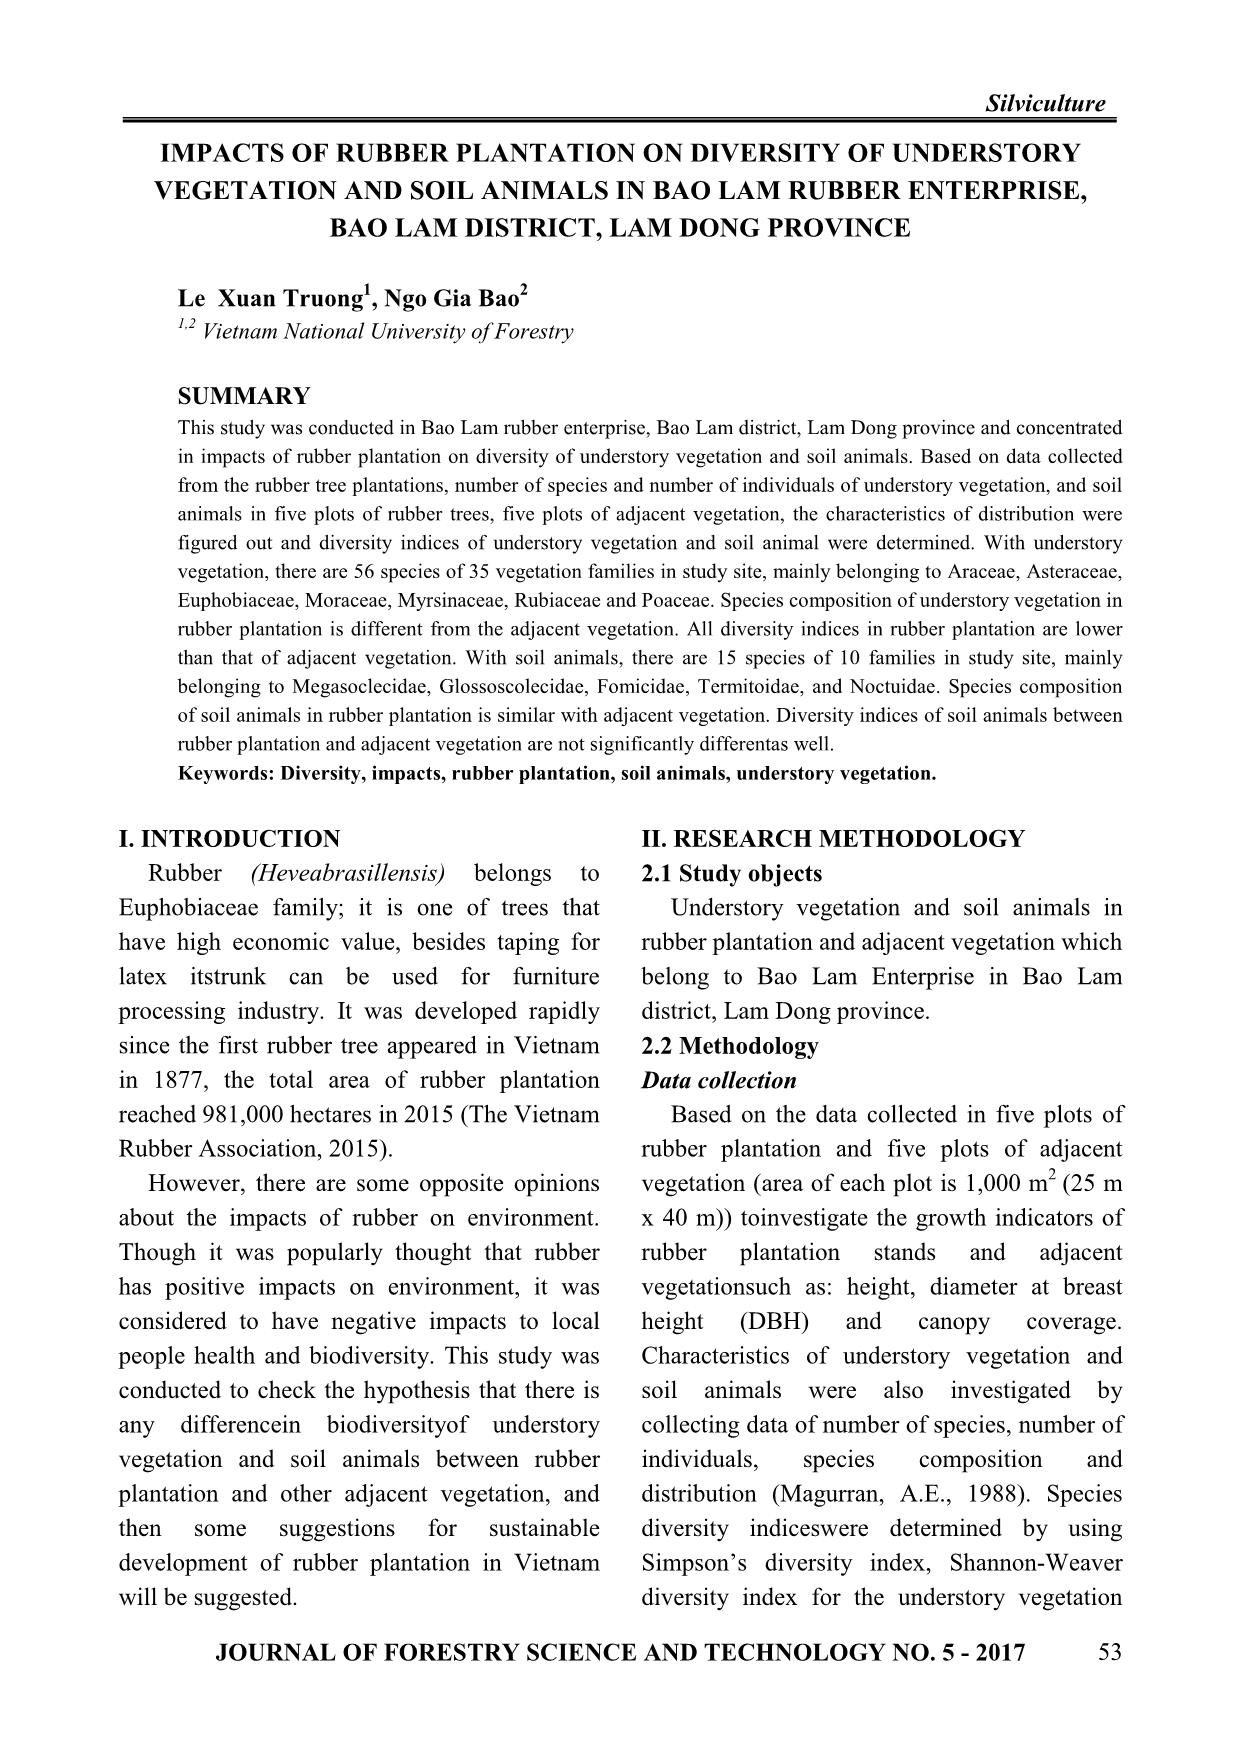
This study was conducted in Bao Lam rubber enterprise, Bao Lam district, Lam Dong province and concentrated in impacts of rubber plantation on diversity of understory vegetation and soil animals. Based on data collected from the rubber tree plantations, number of species and number of individuals of understory vegetation, and soil animals in five plots of rubber trees, five plots of adjacent vegetation, the characteristics of distribution were figured out and diversity indices of understory vegetation and soil animal were determined. With understory vegetation, there are 56 species of 35 vegetation families in study site, mainly belonging to Araceae, Asteraceae, Euphobiaceae, Moraceae, Myrsinaceae, Rubiaceae and Poaceae. Species composition of understory vegetation in rubber plantation is different from the adjacent vegetation. All diversity indices in rubber plantation are lower than that of adjacent vegetation. With soil animals, there are 15 species of 10 families in study site, mainly belonging to Megasoclecidae, Glossoscolecidae, Fomicidae, Termitoidae, and Noctuidae. Species composition of soil animals in rubber plantation is similar with adjacent vegetation. Diversity indices of soil animals between rubber plantation and adjacent vegetation are not significantly differentas well
Trang 1
Trang 2
Trang 3
Trang 4
Trang 5
Trang 6
Trang 7
Trang 8
Tóm tắt nội dung tài liệu: Impacts of rubber plantation on diversity of understory vegetation and soil animals in bao lam rubber enterprise, Bao Lam district, Lam Dong province
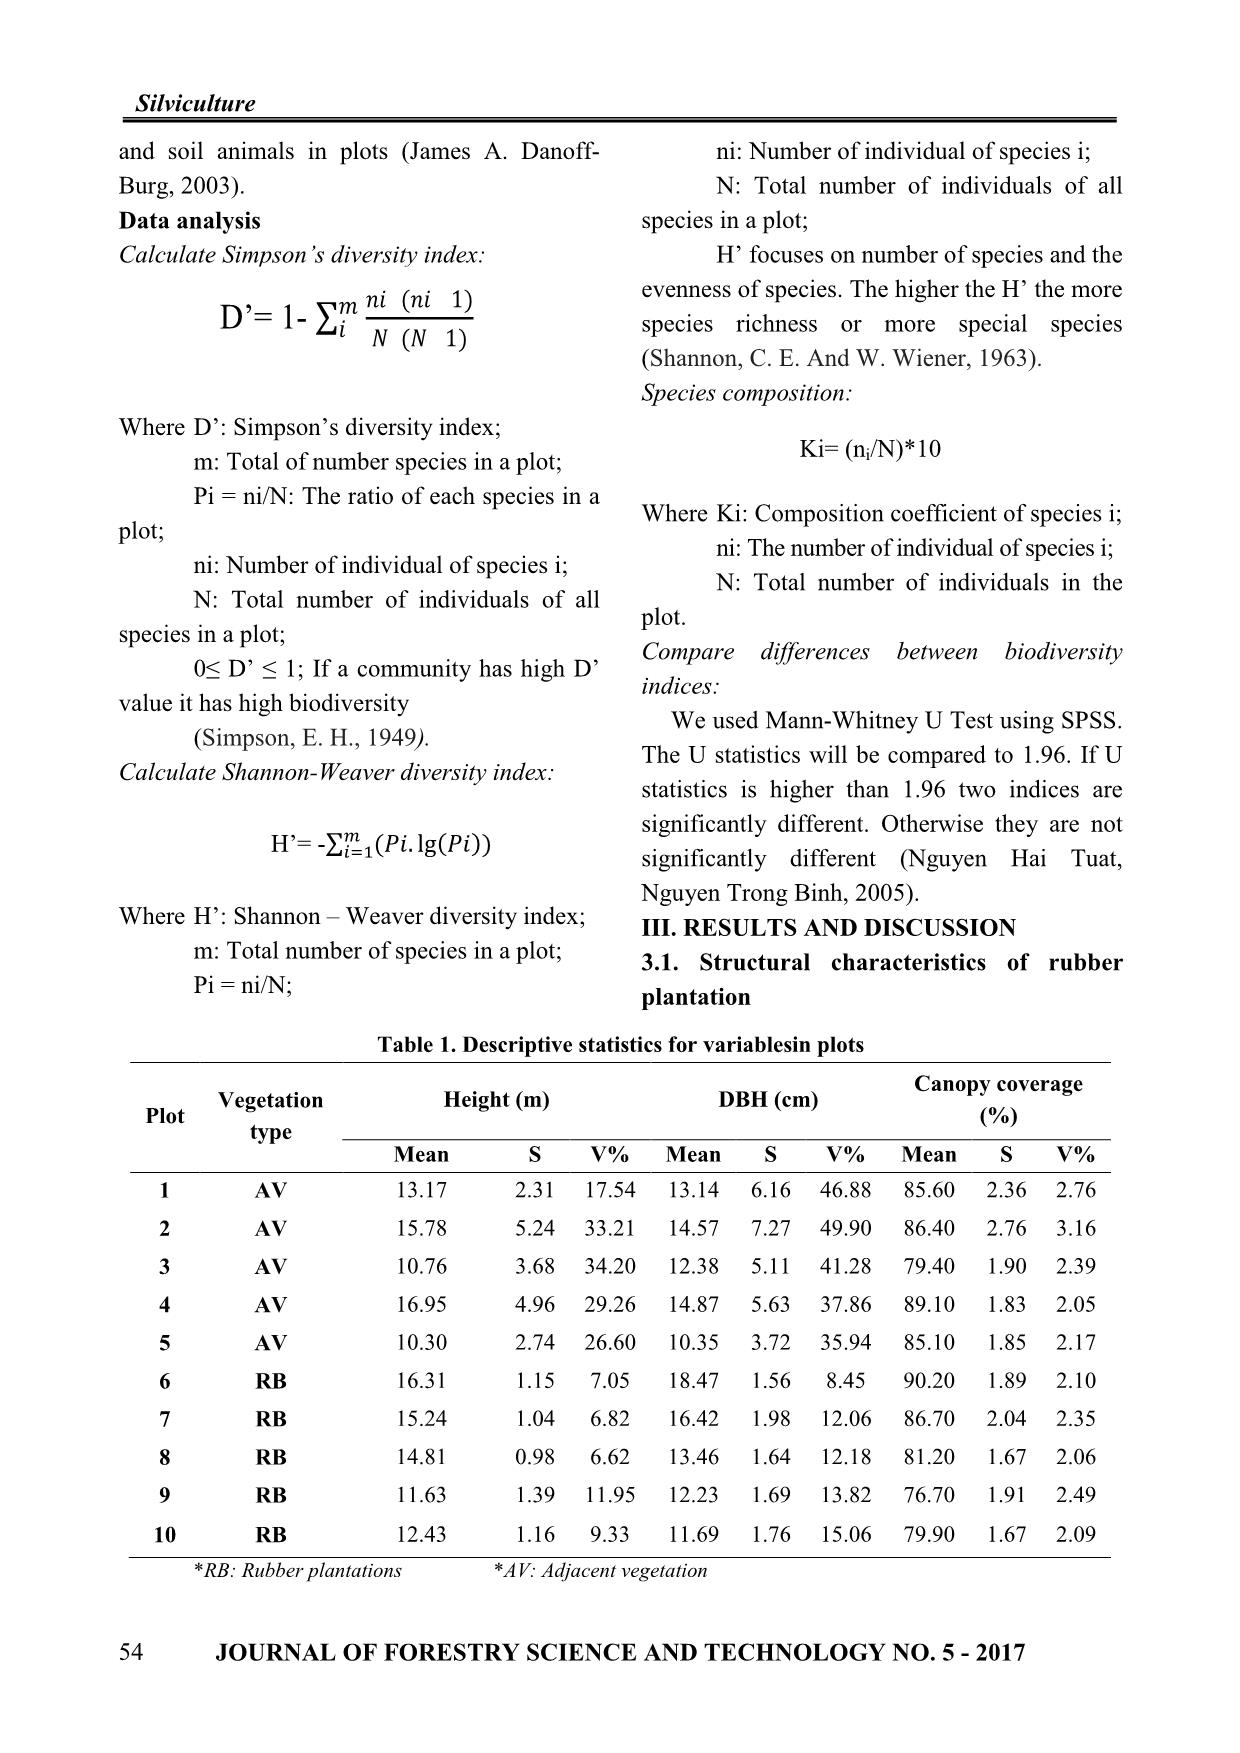
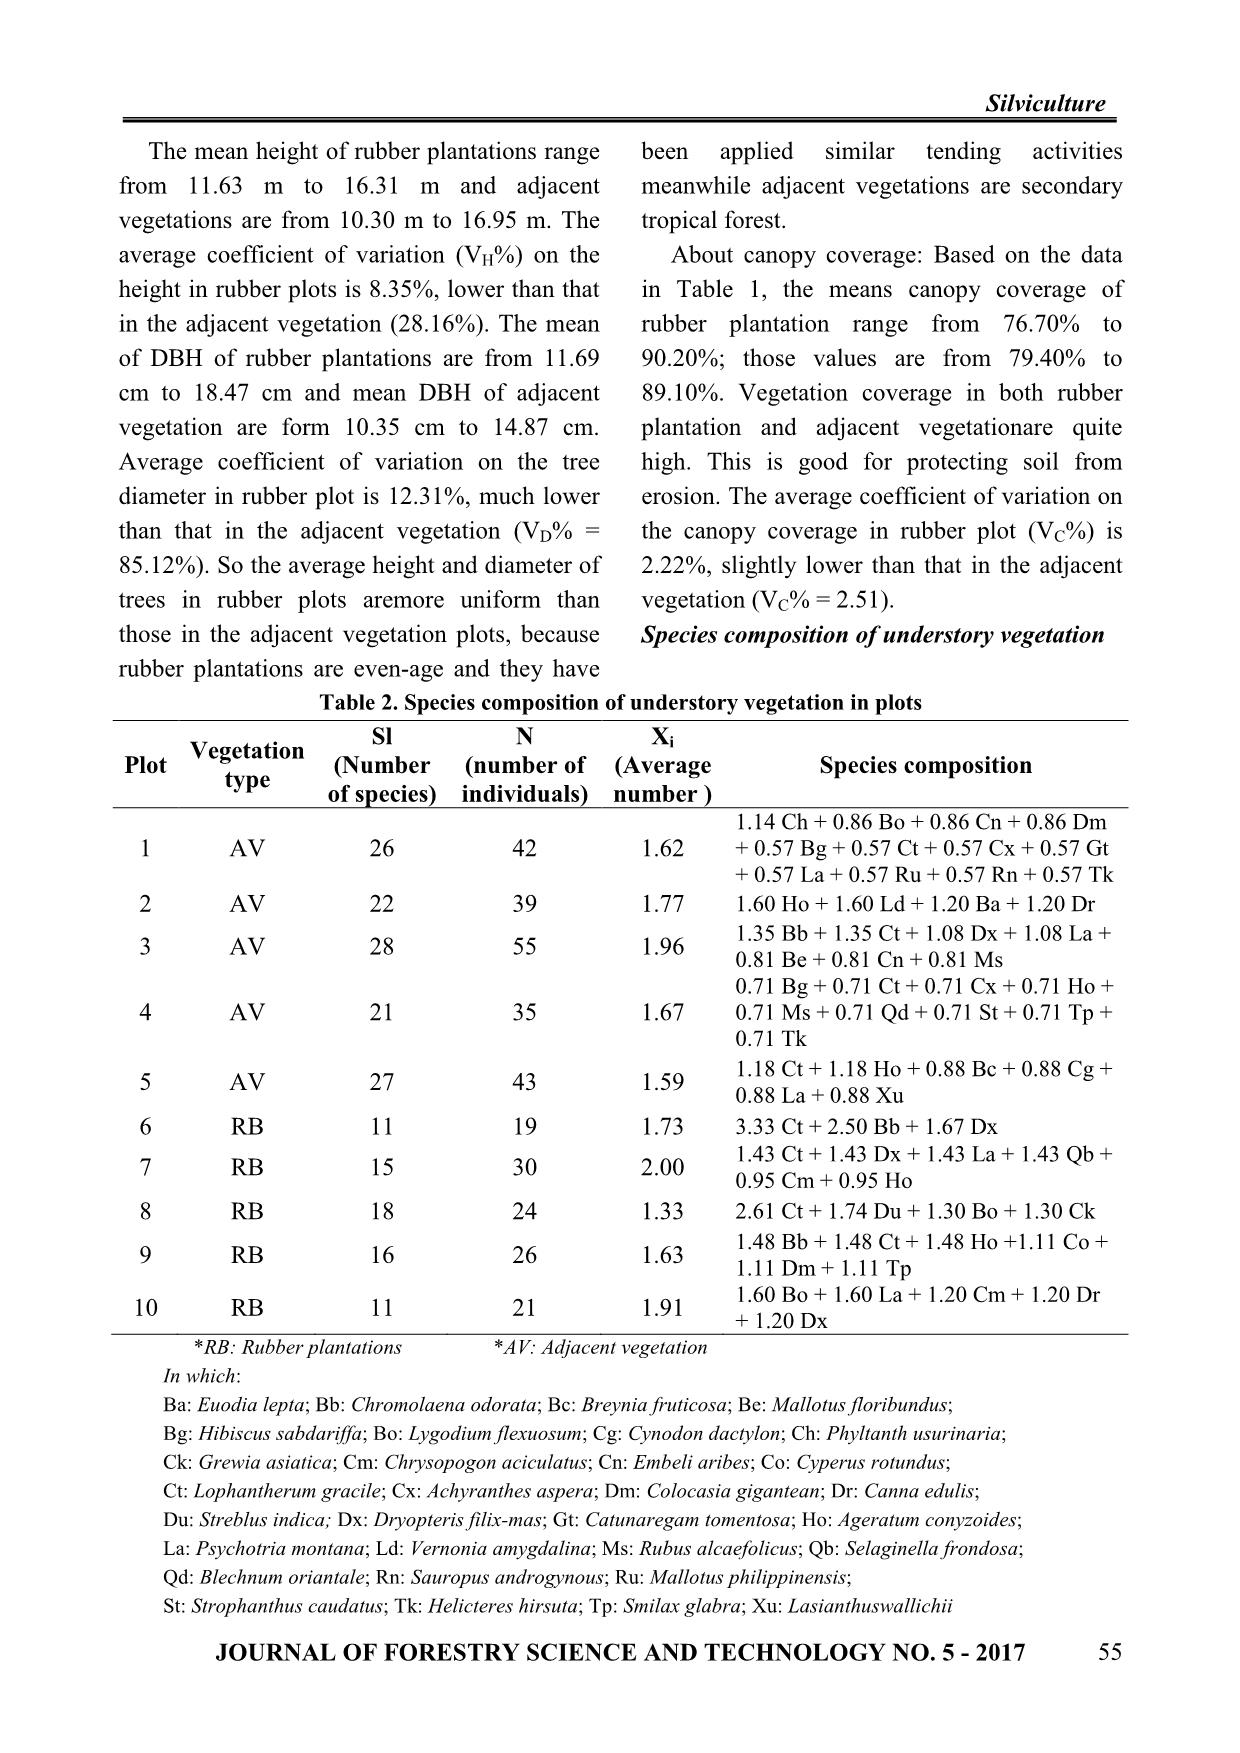
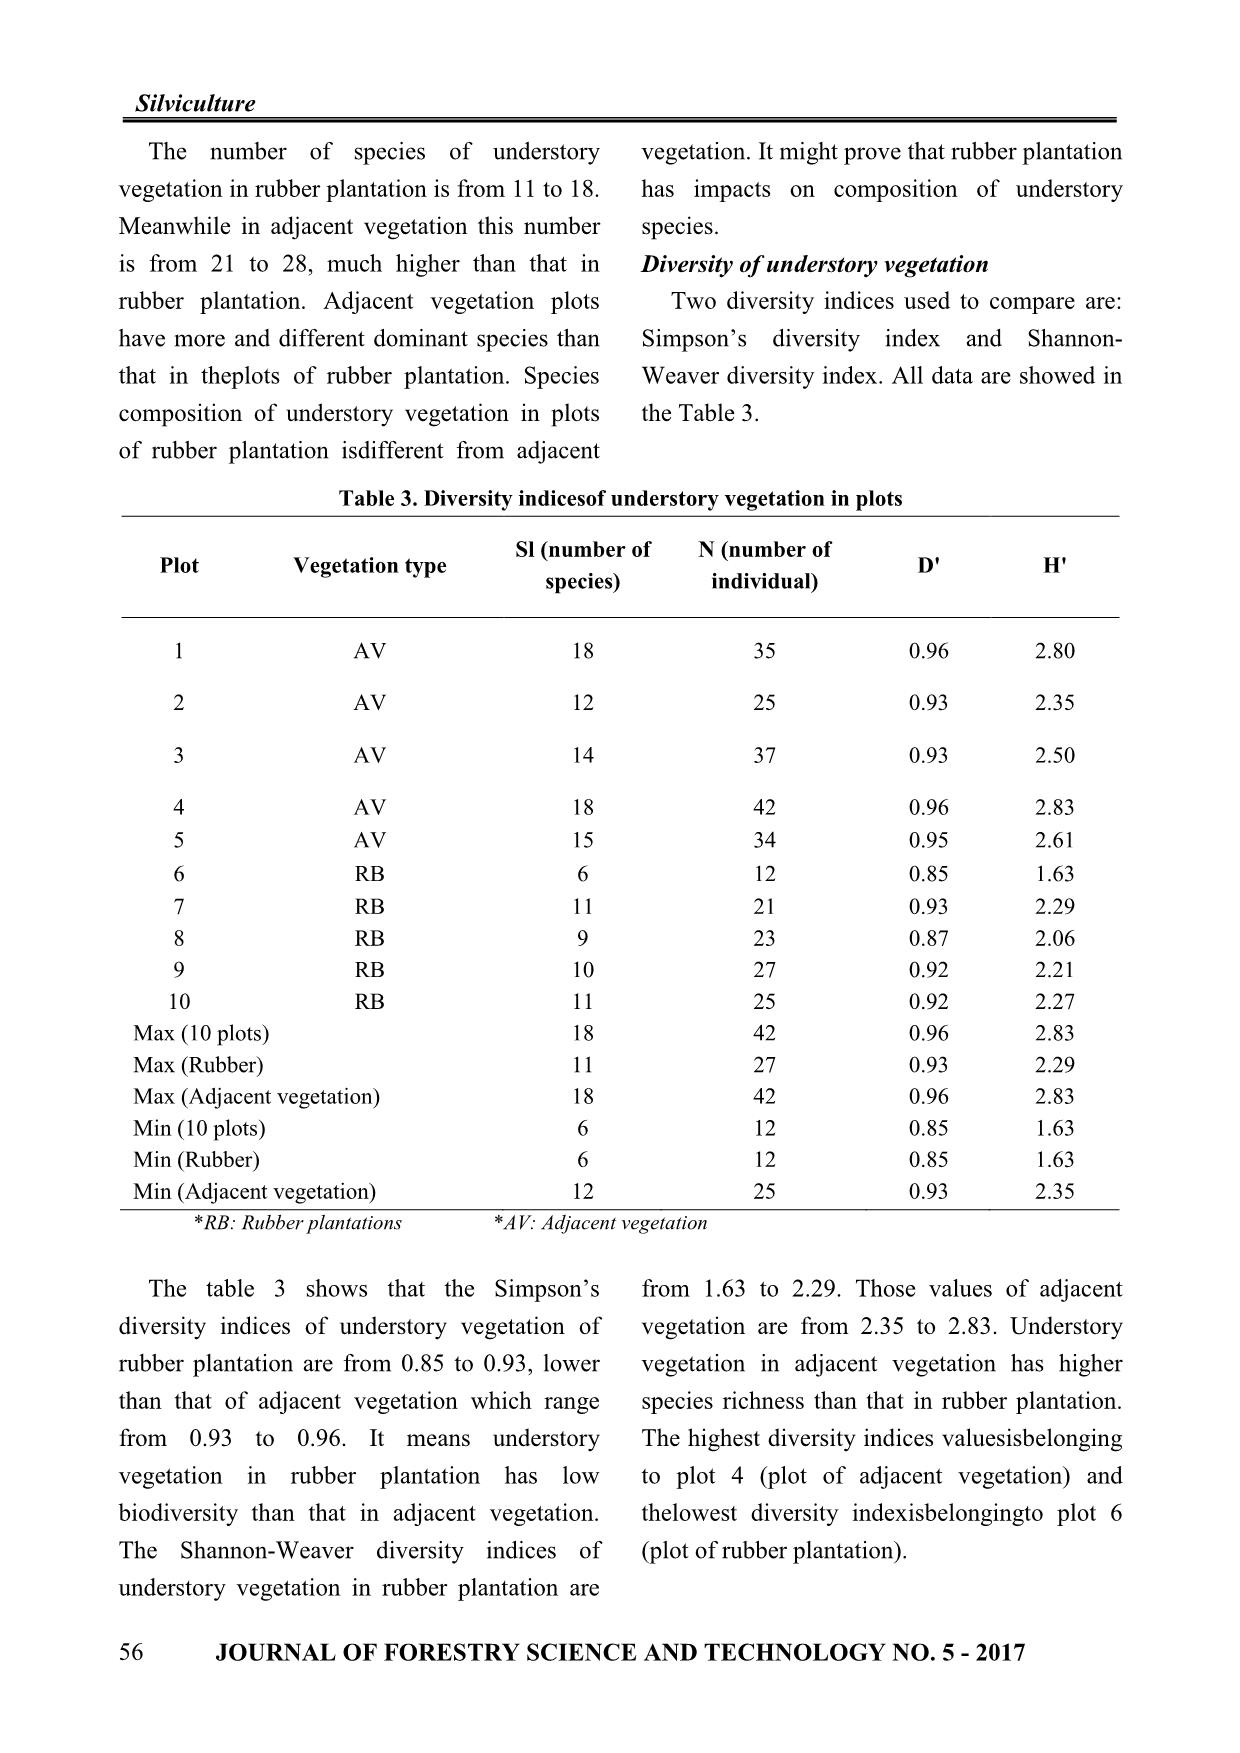
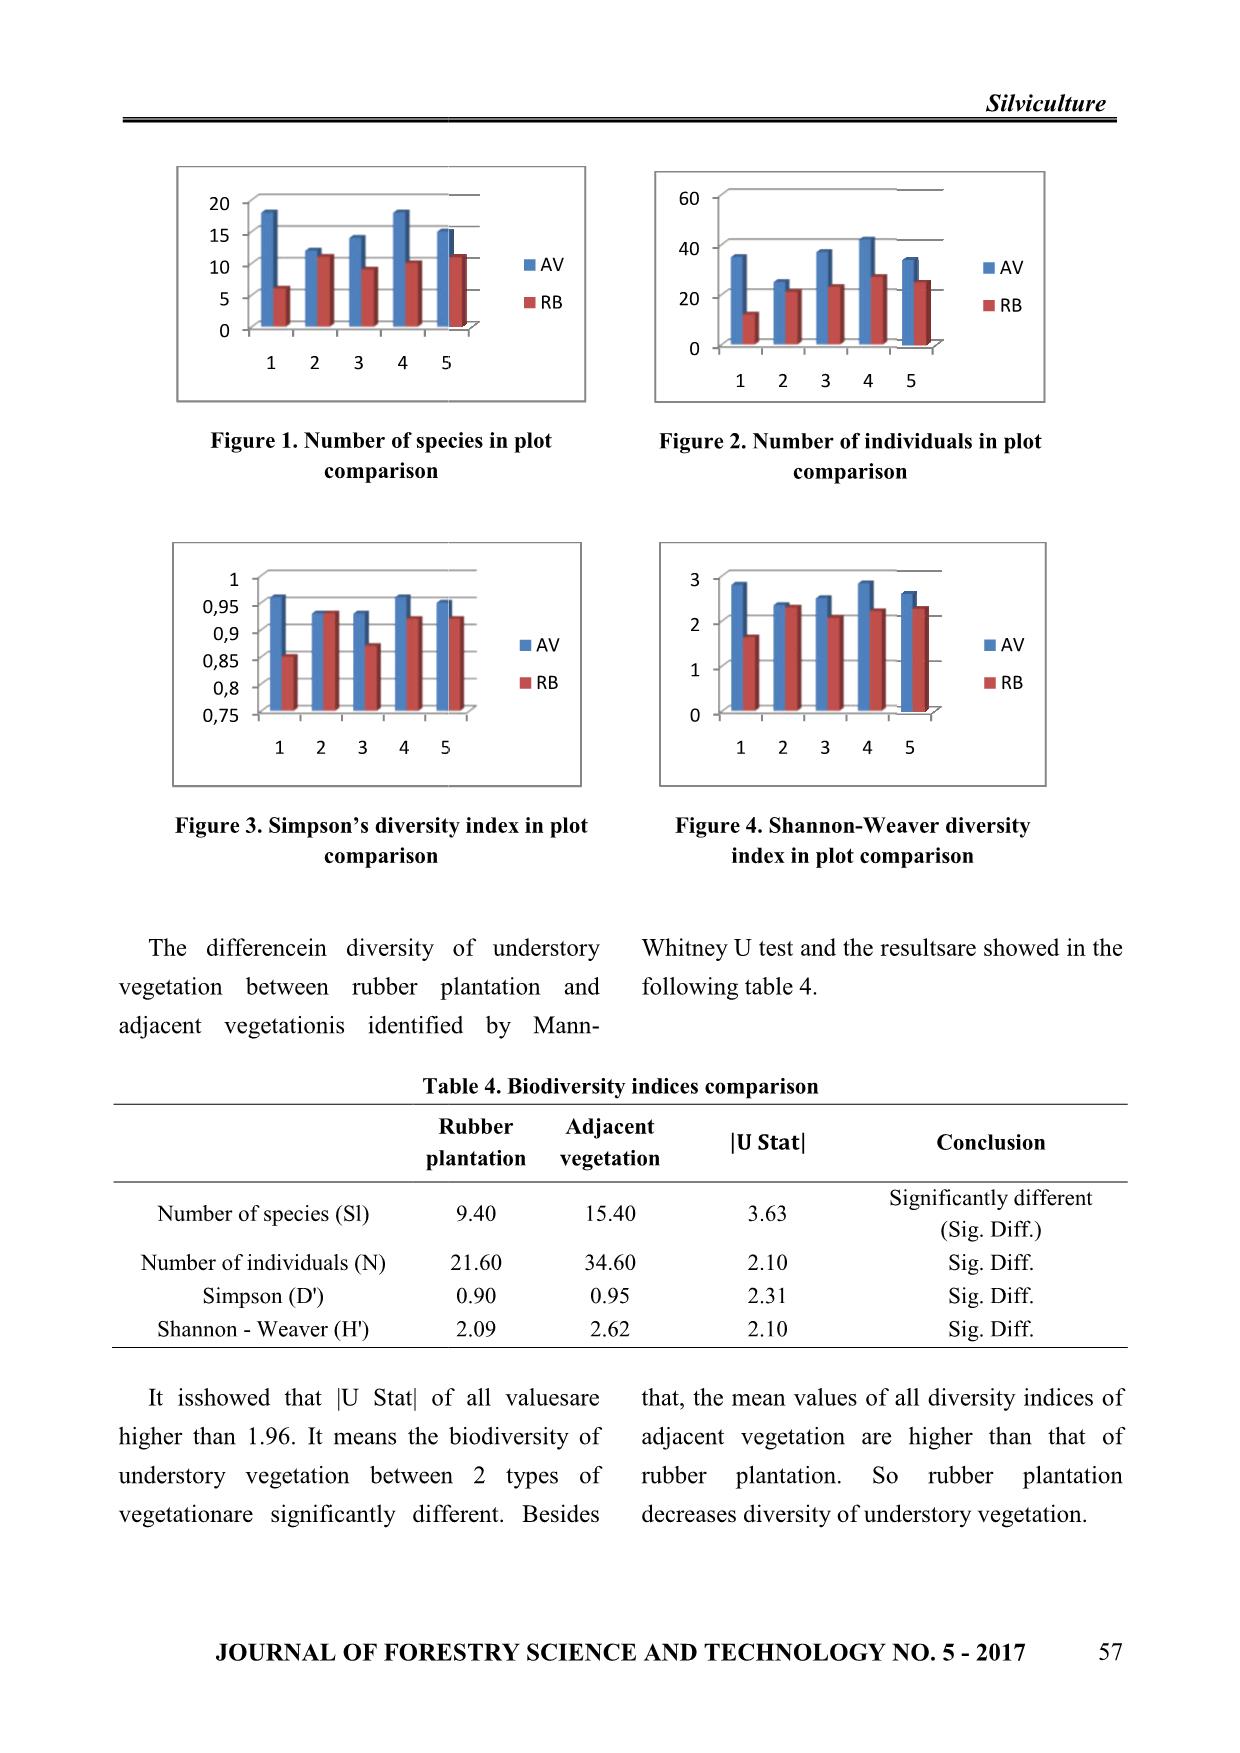
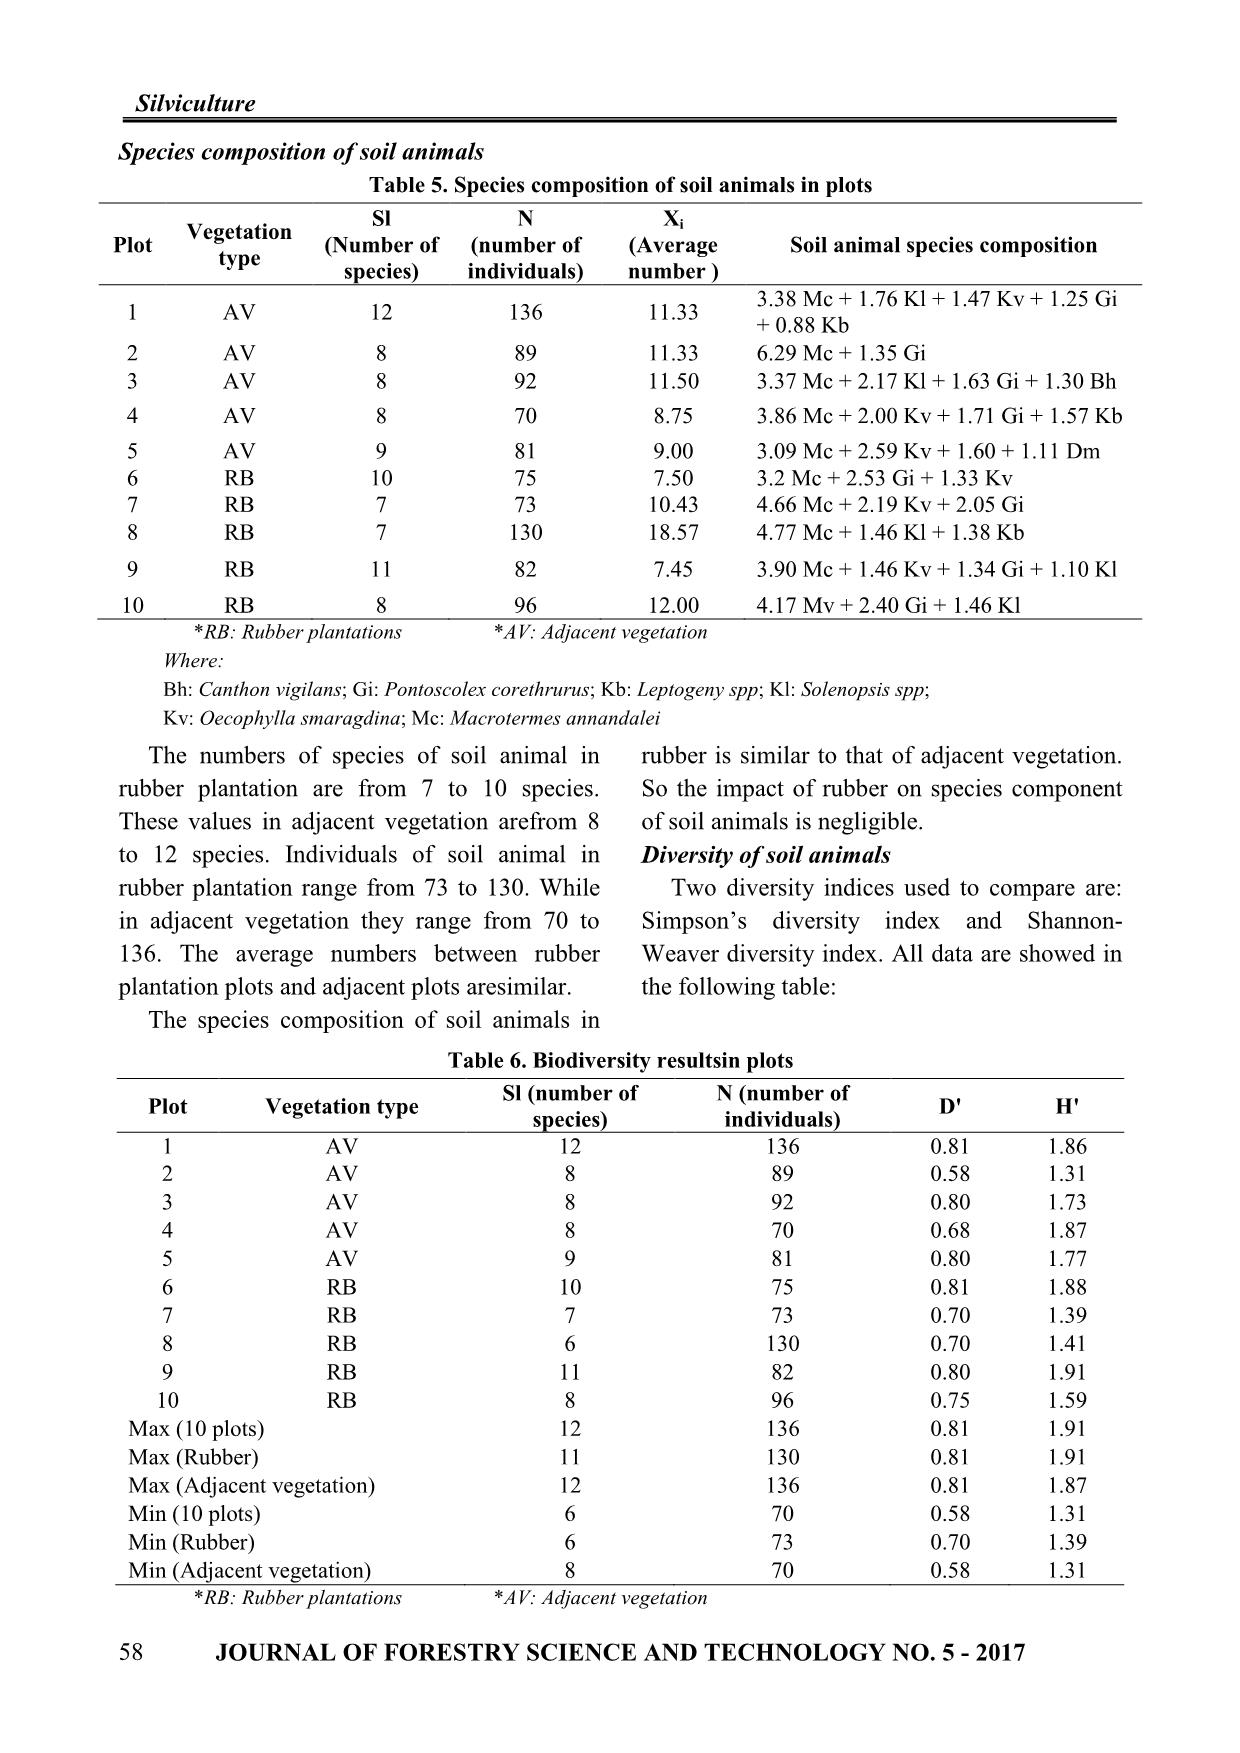
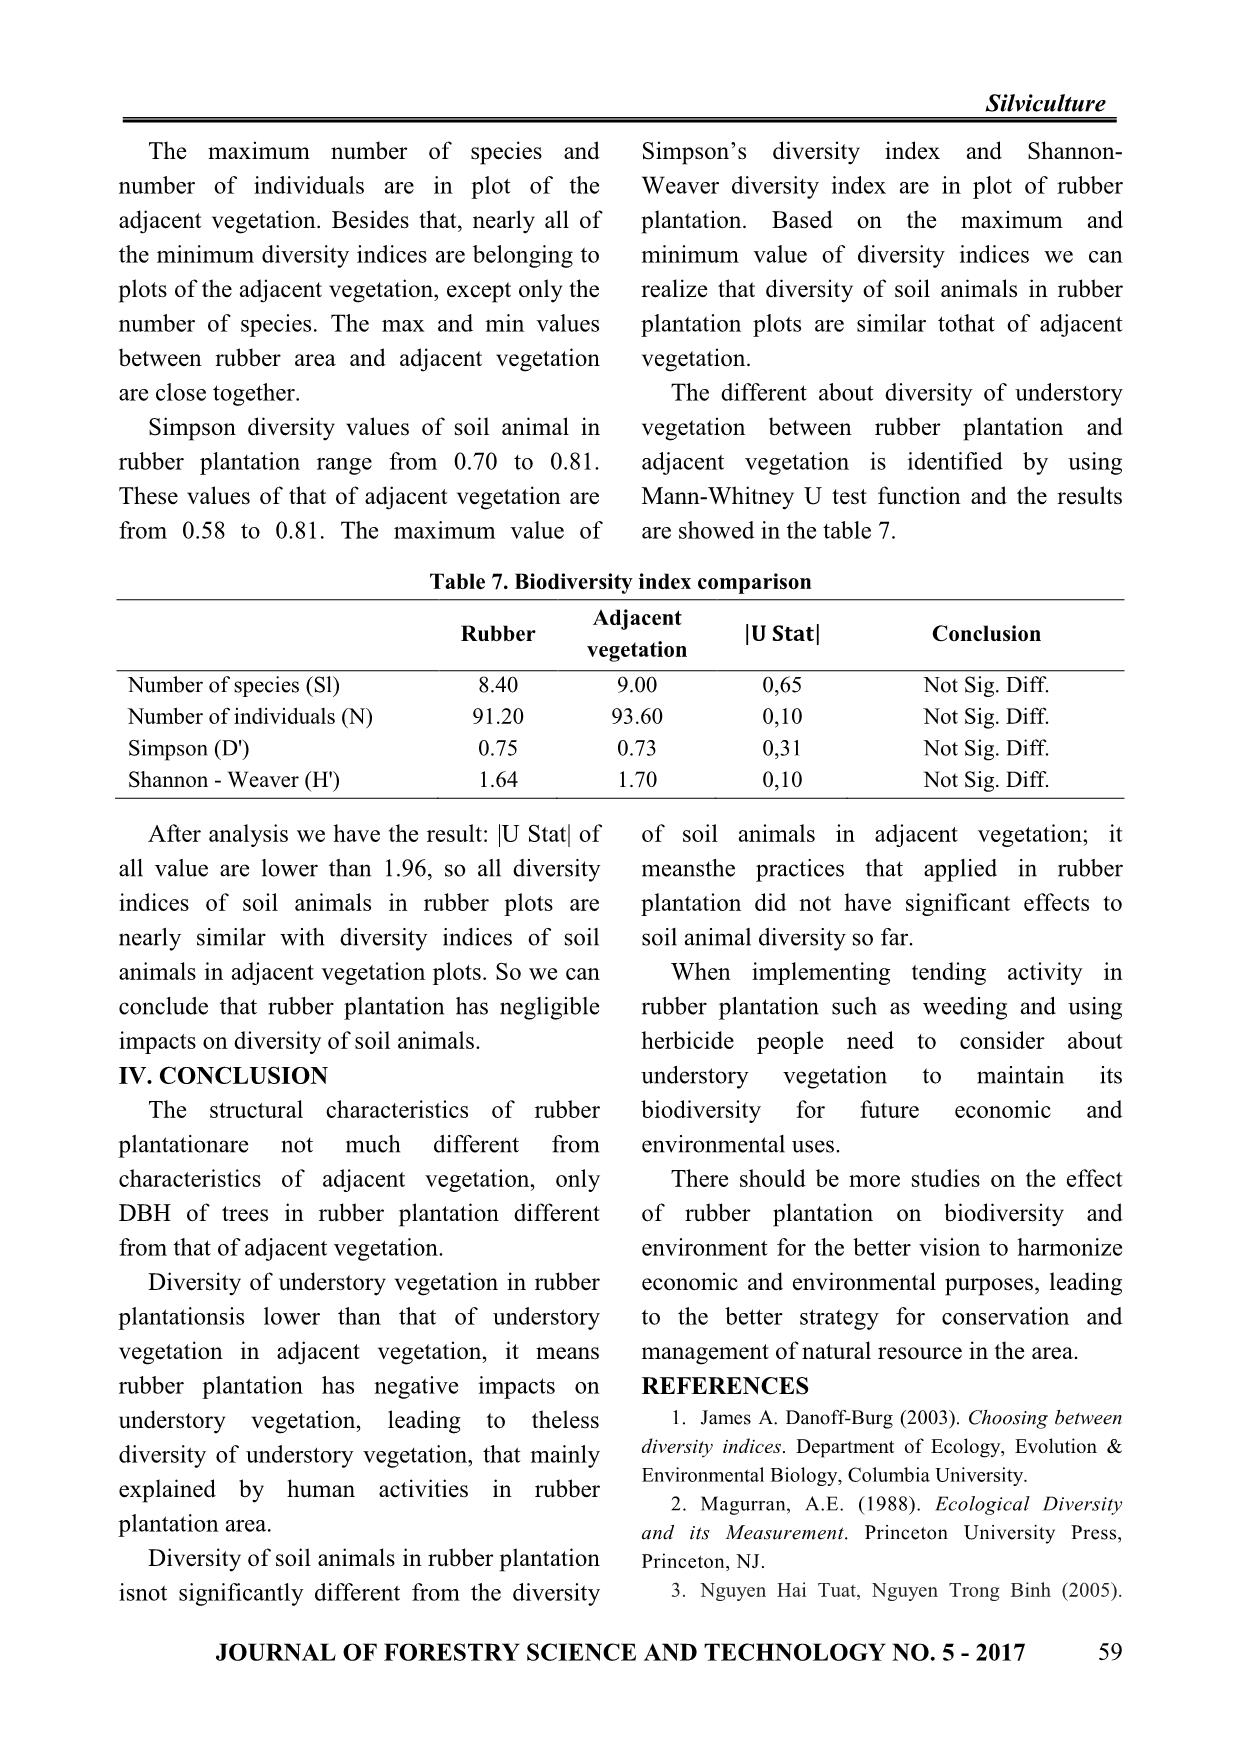
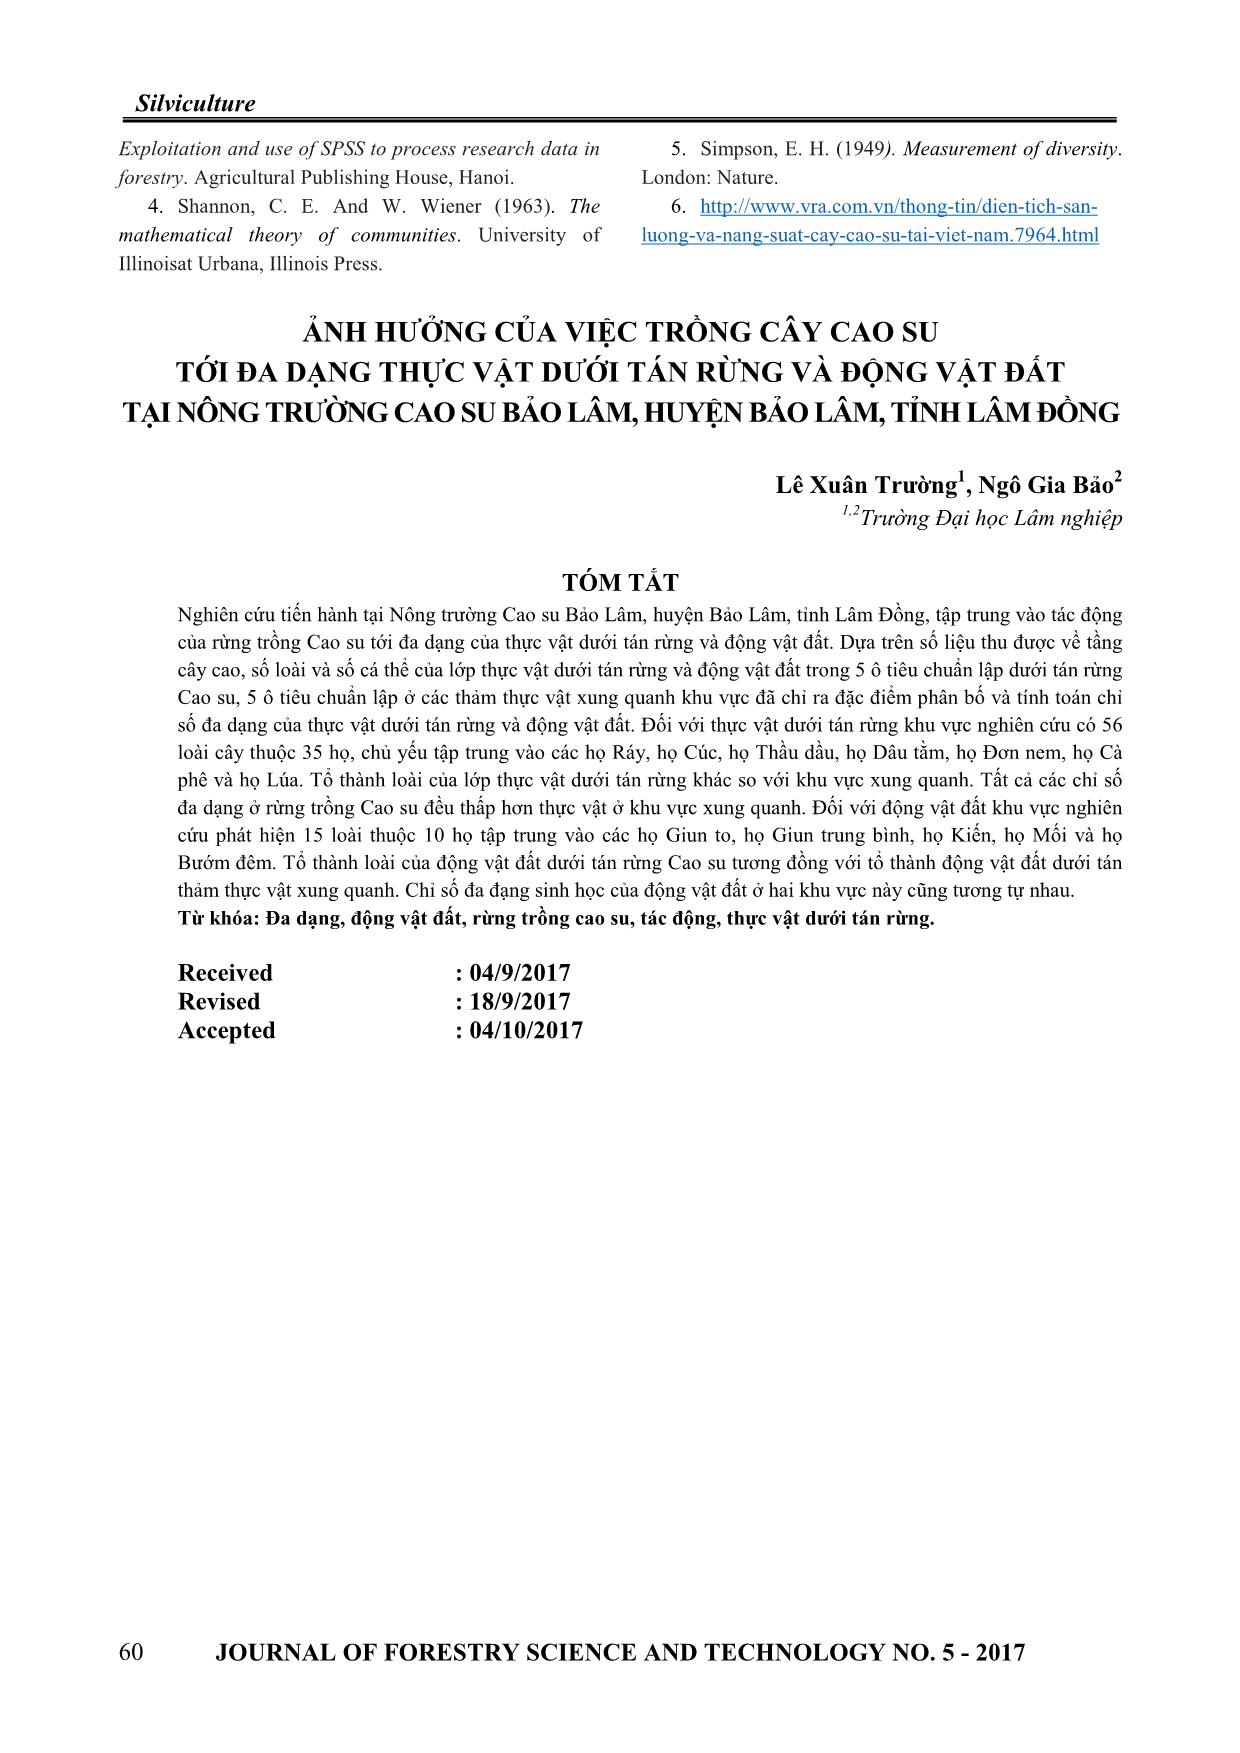
2 16.42 1.98 12.06 86.70 2.04 2.35 8 RB 14.81 0.98 6.62 13.46 1.64 12.18 81.20 1.67 2.06 9 RB 11.63 1.39 11.95 12.23 1.69 13.82 76.70 1.91 2.49 10 RB 12.43 1.16 9.33 11.69 1.76 15.06 79.90 1.67 2.09 *RB: Rubber plantations *AV: Adjacent vegetation 54 JOURNAL OF FORESTRY SCIENCE AND TECHNOLOGY NO. 5 - 2017 Silviculture The mean height of rubber plantations range been applied similar tending activities from 11.63 m to 16.31 m and adjacent meanwhile adjacent vegetations are secondary vegetations are from 10.30 m to 16.95 m. The tropical forest. average coefficient of variation (VH%) on the About canopy coverage: Based on the data height in rubber plots is 8.35%, lower than that in Table 1, the means canopy coverage of in the adjacent vegetation (28.16%). The mean rubber plantation range from 76.70% to of DBH of rubber plantations are from 11.69 90.20%; those values are from 79.40% to cm to 18.47 cm and mean DBH of adjacent 89.10%. Vegetation coverage in both rubber vegetation are form 10.35 cm to 14.87 cm. plantation and adjacent vegetationare quite Average coefficient of variation on the tree high. This is good for protecting soil from diameter in rubber plot is 12.31%, much lower erosion. The average coefficient of variation on than that in the adjacent vegetation (VD% = the canopy coverage in rubber plot (VC%) is 85.12%). So the average height and diameter of 2.22%, slightly lower than that in the adjacent trees in rubber plots aremore uniform than vegetation (VC% = 2.51). those in the adjacent vegetation plots, because Species composition of understory vegetation rubber plantations are even-age and they have Table 2. Species composition of understory vegetation in plots Sl N X Vegetation i Plot (Number (number of (Average Species composition type of species) individuals) number ) 1.14 Ch + 0.86 Bo + 0.86 Cn + 0.86 Dm 1 AV 26 42 1.62 + 0.57 Bg + 0.57 Ct + 0.57 Cx + 0.57 Gt + 0.57 La + 0.57 Ru + 0.57 Rn + 0.57 Tk 2 AV 22 39 1.77 1.60 Ho + 1.60 Ld + 1.20 Ba + 1.20 Dr 1.35 Bb + 1.35 Ct + 1.08 Dx + 1.08 La + 3 AV 28 55 1.96 0.81 Be + 0.81 Cn + 0.81 Ms 0.71 Bg + 0.71 Ct + 0.71 Cx + 0.71 Ho + 4 AV 21 35 1.67 0.71 Ms + 0.71 Qd + 0.71 St + 0.71 Tp + 0.71 Tk 1.18 Ct + 1.18 Ho + 0.88 Bc + 0.88 Cg + 5 AV 27 43 1.59 0.88 La + 0.88 Xu 6 RB 11 19 1.73 3.33 Ct + 2.50 Bb + 1.67 Dx 1.43 Ct + 1.43 Dx + 1.43 La + 1.43 Qb + 7 RB 15 30 2.00 0.95 Cm + 0.95 Ho 8 RB 18 24 1.33 2.61 Ct + 1.74 Du + 1.30 Bo + 1.30 Ck 1.48 Bb + 1.48 Ct + 1.48 Ho +1.11 Co + 9 RB 16 26 1.63 1.11 Dm + 1.11 Tp 1.60 Bo + 1.60 La + 1.20 Cm + 1.20 Dr 10 RB 11 21 1.91 + 1.20 Dx *RB: Rubber plantations *AV: Adjacent vegetation In which: Ba: Euodia lepta; Bb: Chromolaena odorata; Bc: Breynia fruticosa; Be: Mallotus floribundus; Bg: Hibiscus sabdariffa; Bo: Lygodium flexuosum; Cg: Cynodon dactylon; Ch: Phyltanth usurinaria; Ck: Grewia asiatica; Cm: Chrysopogon aciculatus; Cn: Embeli aribes; Co: Cyperus rotundus; Ct: Lophantherum gracile; Cx: Achyranthes aspera; Dm: Colocasia gigantean; Dr: Canna edulis; Du: Streblus indica; Dx: Dryopteris filix-mas; Gt: Catunaregam tomentosa; Ho: Ageratum conyzoides; La: Psychotria montana; Ld: Vernonia amygdalina; Ms: Rubus alcaefolicus; Qb: Selaginella frondosa; Qd: Blechnum oriantale; Rn: Sauropus androgynous; Ru: Mallotus philippinensis; St: Strophanthus caudatus; Tk: Helicteres hirsuta; Tp: Smilax glabra; Xu: Lasianthuswallichii JOURNAL OF FORESTRY SCIENCE AND TECHNOLOGY NO. 5 - 2017 55 Silviculture The number of species of understory vegetation. It might prove that rubber plantation vegetation in rubber plantation is from 11 to 18. has impacts on composition of understory Meanwhile in adjacent vegetation this number species. is from 21 to 28, much higher than that in Diversity of understory vegetation rubber plantation. Adjacent vegetation plots Two diversity indices used to compare are: have more and different dominant species than Simpson’s diversity index and Shannon- that in theplots of rubber plantation. Species Weaver diversity index. All data are showed in composition of understory vegetation in plots the Table 3. of rubber plantation isdifferent from adjacent Table 3. Diversity indicesof understory vegetation in plots Sl (number of N (number of Plot Vegetation type D' H' species) individual) 1 AV 18 35 0.96 2.80 2 AV 12 25 0.93 2.35 3 AV 14 37 0.93 2.50 4 AV 18 42 0.96 2.83 5 AV 15 34 0.95 2.61 6 RB 6 12 0.85 1.63 7 RB 11 21 0.93 2.29 8 RB 9 23 0.87 2.06 9 RB 10 27 0.92 2.21 10 RB 11 25 0.92 2.27 Max (10 plots) 18 42 0.96 2.83 Max (Rubber) 11 27 0.93 2.29 Max (Adjacent vegetation) 18 42 0.96 2.83 Min (10 plots) 6 12 0.85 1.63 Min (Rubber) 6 12 0.85 1.63 Min (Adjacent vegetation) 12 25 0.93 2.35 *RB: Rubber plantations *AV: Adjacent vegetation The table 3 shows that the Simpson’s from 1.63 to 2.29. Those values of adjacent diversity indices of understory vegetation of vegetation are from 2.35 to 2.83. Understory rubber plantation are from 0.85 to 0.93, lower vegetation in adjacent vegetation has higher than that of adjacent vegetation which range species richness than that in rubber plantation. from 0.93 to 0.96. It means understory The highest diversity indices valuesisbelonging vegetation in rubber plantation has low to plot 4 (plot of adjacent vegetation) and biodiversity than that in adjacent vegetation. thelowest diversity indexisbelongingto plot 6 The Shannon-Weaver diversity indices of (plot of rubber plantation). understory vegetation in rubber plantation are 56 JOURNAL OF FORESTRY SCIENCE AND TECHNOLOGY NO. 5 - 2017 Silviculture 20 60 15 40 10 AV AV 5 RB 20 RB 0 0 1 2 3 4 5 1 2 3 4 5 Figure 1. Number of species in plot Figure 2. Number of individuals in plot comparison comparison 1 3 0,95 0,9 2 AV AV 0,85 1 0,8 RB RB 0,75 0 1 2 3 4 5 1 2 3 4 5 Figure 3. Simpson’s diversity index in plot Figure 4. Shannon-Weaver diversity comparison index in plot comparison The differencein diversity of understory Whitney U test and the resultsare showed in the vegetation between rubber plantation and following table 4. adjacent vegetationis identified by Mann- Table 4. Biodiversity indices comparison Rubber Adjacent |� ����| Conclusion plantation vegetation Significantly different Number of species (Sl) 9.40 15.40 3.63 (Sig. Diff.) Number of individuals (N) 21.60 34.60 2.10 Sig. Diff. Simpson (D') 0.90 0.95 2.31 Sig. Diff. Shannon - Weaver (H') 2.09 2.62 2.10 Sig. Diff. It isshowed that |U Stat| of all valuesare that, the mean values of all diversity indices of higher than 1.96. It means the biodiversity of adjacent vegetation are higher than that of understory vegetation between 2 types of rubber plantation. So rubber plantation vegetationare significantly different. Besides decreases diversity of understory vegetation. JOURNAL OF FORESTRY SCIENCE AND TECHNOLOGY NO. 5 - 2017 57 Silviculture Species composition of soil animals Table 5. Species composition of soil animals in plots Sl N X Vegetation i Plot (Number of (number of (Average Soil animal species composition type species) individuals) number ) 3.38 Mc + 1.76 Kl + 1.47 Kv + 1.25 Gi 1 AV 12 136 11.33 + 0.88 Kb 2 AV 8 89 11.33 6.29 Mc + 1.35 Gi 3 AV 8 92 11.50 3.37 Mc + 2.17 Kl + 1.63 Gi + 1.30 Bh 4 AV 8 70 8.75 3.86 Mc + 2.00 Kv + 1.71 Gi + 1.57 Kb 5 AV 9 81 9.00 3.09 Mc + 2.59 Kv + 1.60 + 1.11 Dm 6 RB 10 75 7.50 3.2 Mc + 2.53 Gi + 1.33 Kv 7 RB 7 73 10.43 4.66 Mc + 2.19 Kv + 2.05 Gi 8 RB 7 130 18.57 4.77 Mc + 1.46 Kl + 1.38 Kb 9 RB 11 82 7.45 3.90 Mc + 1.46 Kv + 1.34 Gi + 1.10 Kl 10 RB 8 96 12.00 4.17 Mv + 2.40 Gi + 1.46 Kl *RB: Rubber plantations *AV: Adjacent vegetation Where: Bh: Canthon vigilans; Gi: Pontoscolex corethrurus; Kb: Leptogeny spp; Kl: Solenopsis spp; Kv: Oecophylla smaragdina; Mc: Macrotermes annandalei The numbers of species of soil animal in rubber is similar to that of adjacent vegetation. rubber plantation are from 7 to 10 species. So the impact of rubber on species component These values in adjacent vegetation arefrom 8 of soil animals is negligible. to 12 species. Individuals of soil animal in Diversity of soil animals rubber plantation range from 73 to 130. While Two diversity indices used to compare are: in adjacent vegetation they range from 70 to Simpson’s diversity index and Shannon- 136. The average numbers between rubber Weaver diversity index. All data are showed in plantation plots and adjacent plots aresimilar. the following table: The species composition of soil animals in Table 6. Biodiversity resultsin plots Sl (number of N (number of Plot Vegetation type D' H' species) individuals) 1 AV 12 136 0.81 1.86 2 AV 8 89 0.58 1.31 3 AV 8 92 0.80 1.73 4 AV 8 70 0.68 1.87 5 AV 9 81 0.80 1.77 6 RB 10 75 0.81 1.88 7 RB 7 73 0.70 1.39 8 RB 6 130 0.70 1.41 9 RB 11 82 0.80 1.91 10 RB 8 96 0.75 1.59 Max (10 plots) 12 136 0.81 1.91 Max (Rubber) 11 130 0.81 1.91 Max (Adjacent vegetation) 12 136 0.81 1.87 Min (10 plots) 6 70 0.58 1.31 Min (Rubber) 6 73 0.70 1.39 Min (Adjacent vegetation) 8 70 0.58 1.31 *RB: Rubber plantations *AV: Adjacent vegetation 58 JOURNAL OF FORESTRY SCIENCE AND TECHNOLOGY NO. 5 - 2017 Silviculture The maximum number of species and Simpson’s diversity index and Shannon- number of individuals are in plot of the Weaver diversity index are in plot of rubber adjacent vegetation. Besides that, nearly all of plantation. Based on the maximum and the minimum diversity indices are belonging to minimum value of diversity indices we can plots of the adjacent vegetation, except only the realize that diversity of soil animals in rubber number of species. The max and min values plantation plots are similar tothat of adjacent between rubber area and adjacent vegetation vegetation. are close together. The different about diversity of understory Simpson diversity values of soil animal in vegetation between rubber plantation and rubber plantation range from 0.70 to 0.81. adjacent vegetation is identified by using These values of that of adjacent vegetation are Mann-Whitney U test function and the results from 0.58 to 0.81. The maximum value of are showed in the table 7. Table 7. Biodiversity index comparison Adjacent Rubber |� ����| Conclusion vegetation Number of species (Sl) 8.40 9.00 0,65 Not Sig. Diff. Number of individuals (N) 91.20 93.60 0,10 Not Sig. Diff. Simpson (D') 0.75 0.73 0,31 Not Sig. Diff. Shannon - Weaver (H') 1.64 1.70 0,10 Not Sig. Diff. After analysis we have the result: |U Stat| of of soil animals in adjacent vegetation; it all value are lower than 1.96, so all diversity meansthe practices that applied in rubber indices of soil animals in rubber plots are plantation did not have significant effects to nearly similar with diversity indices of soil soil animal diversity so far. animals in adjacent vegetation plots. So we can When implementing tending activity in conclude that rubber plantation has negligible rubber plantation such as weeding and using impacts on diversity of soil animals. herbicide people need to consider about IV. CONCLUSION understory vegetation to maintain its The structural characteristics of rubber biodiversity for future economic and plantationare not much different from environmental uses. characteristics of adjacent vegetation, only There should be more studies on the effect DBH of trees in rubber plantation different of rubber plantation on biodiversity and from that of adjacent vegetation. environment for the better vision to harmonize Diversity of understory vegetation in rubber economic and environmental purposes, leading plantationsis lower than that of understory to the better strategy for conservation and vegetation in adjacent vegetation, it means management of natural resource in the area. rubber plantation has negative impacts on REFERENCES understory vegetation, leading to theless 1. James A. Danoff-Burg (2003). Choosing between diversity of understory vegetation, that mainly diversity indices. Department of Ecology, Evolution & Environmental Biology, Columbia University. explained by human activities in rubber 2. Magurran, A.E. (1988). Ecological Diversity plantation area. and its Measurement. Princeton University Press, Diversity of soil animals in rubber plantation Princeton, NJ. isnot significantly different from the diversity 3. Nguyen Hai Tuat, Nguyen Trong Binh (2005). JOURNAL OF FORESTRY SCIENCE AND TECHNOLOGY NO. 5 - 2017 59 Silviculture Exploitation and use of SPSS to process research data in 5. Simpson, E. H. (1949). Measurement of diversity. forestry. Agricultural Publishing House, Hanoi. London: Nature. 4. Shannon, C. E. And W. Wiener (1963). The 6. mathematical theory of communities. University of luong-va-nang-suat-cay-cao-su-tai-viet-nam.7964.html Illinoisat Urbana, Illinois Press. ẢNH HƯỞNG CỦA VIỆC TRỒNG CÂY CAO SU TỚI ĐA DẠNG THỰC VẬT DƯỚI TÁN RỪNG VÀ ĐỘNG VẬT ĐẤT TẠI NÔNG TRƯỜNG CAO SU BẢO LÂM, HUYỆN BẢO LÂM, TỈNH LÂM ĐỒNG Lê Xuân Trường1, Ngô Gia Bảo2 1,2Trường Đại học Lâm nghiệp TÓM TẮT Nghiên cứu tiến hành tại Nông trường Cao su Bảo Lâm, huyện Bảo Lâm, tỉnh Lâm Đồng, tập trung vào tác động của rừng trồng Cao su tới đa dạng của thực vật dưới tán rừng và động vật đất. Dựa trên số liệu thu được về tầng cây cao, số loài và số cá thể của lớp thực vật dưới tán rừng và động vật đất trong 5 ô tiêu chuẩn lập dưới tán rừng Cao su, 5 ô tiêu chuẩn lập ở các thảm thực vật xung quanh khu vực đã chỉ ra đặc điểm phân bố và tính toán chỉ số đa dạng của thực vật dưới tán rừng và động vật đất. Đối với thực vật dưới tán rừng khu vực nghiên cứu có 56 loài cây thuộc 35 họ, chủ yếu tập trung vào các họ Ráy, họ Cúc, họ Thầu dầu, họ Dâu tằm, họ Đơn nem, họ Cà phê và họ Lúa. Tổ thành loài của lớp thực vật dưới tán rừng khác so với khu vực xung quanh. Tất cả các chỉ số đa dạng ở rừng trồng Cao su đều thấp hơn thực vật ở khu vực xung quanh. Đối với động vật đất khu vực nghiên cứu phát hiện 15 loài thuộc 10 họ tập trung vào các họ Giun to, họ Giun trung bình, họ Kiến, họ Mối và họ Bướm đêm. Tổ thành loài của động vật đất dưới tán rừng Cao su tương đồng với tổ thành động vật đất dưới tán thảm thực vật xung quanh. Chỉ số đa đạng sinh học của động vật đất ở hai khu vực này cũng tương tự nhau. Từ khóa: Đa dạng, động vật đất, rừng trồng cao su, tác động, thực vật dưới tán rừng. Received : 04/9/2017 Revised : 18/9/2017 Accepted : 04/10/2017 60 JOURNAL OF FORESTRY SCIENCE AND TECHNOLOGY NO. 5 - 2017
File đính kèm:
 impacts_of_rubber_plantation_on_diversity_of_understory_vege.pdf

