Crypto-Currency: Empirical evidence from GSADF and wavelet coherence techniques
This study is targeted towards the explosive behavior of crypto-currencies, namely Bitcoin, Etherium,
Litecoin and Ripple by investigating the crypto-currencies bubbles and the causal link between Bitcoin
and other three crypto-currencies prices, using GSADF and wavelet coherence tests. The study aims
to answer the following questions which have not been investigated in the literature to our best
knowledge (i) Was there any bubble in the prices of Bitcoin, Etherium, Litecoin and Ripple and
between 01.09.2016 and 01.04.2019? If yes, why (ii) was there any linkage between Bitcoin and
Etherium, Litecoin and Ripple? Our findings reveal that (a) there were some bubbles in the cryptocurrencies for the periods investigated; (b) there was a positive correlation between Bitcoin and
Etherium, Litecoin and Ripple in the short-run; (c) changes in Bitcoin prices lead changes Etherium,
Litecoin and Ripple prices in the long run at different periods.
Trang 1
Trang 2
Trang 3
Trang 4
Trang 5
Trang 6
Trang 7
Trang 8
Trang 9
Trang 10
Tóm tắt nội dung tài liệu: Crypto-Currency: Empirical evidence from GSADF and wavelet coherence techniques
Backwards SADF sequence (left axis)
95% critical value sequence (left axis)
LITECOIN (right axis)
GSADF test
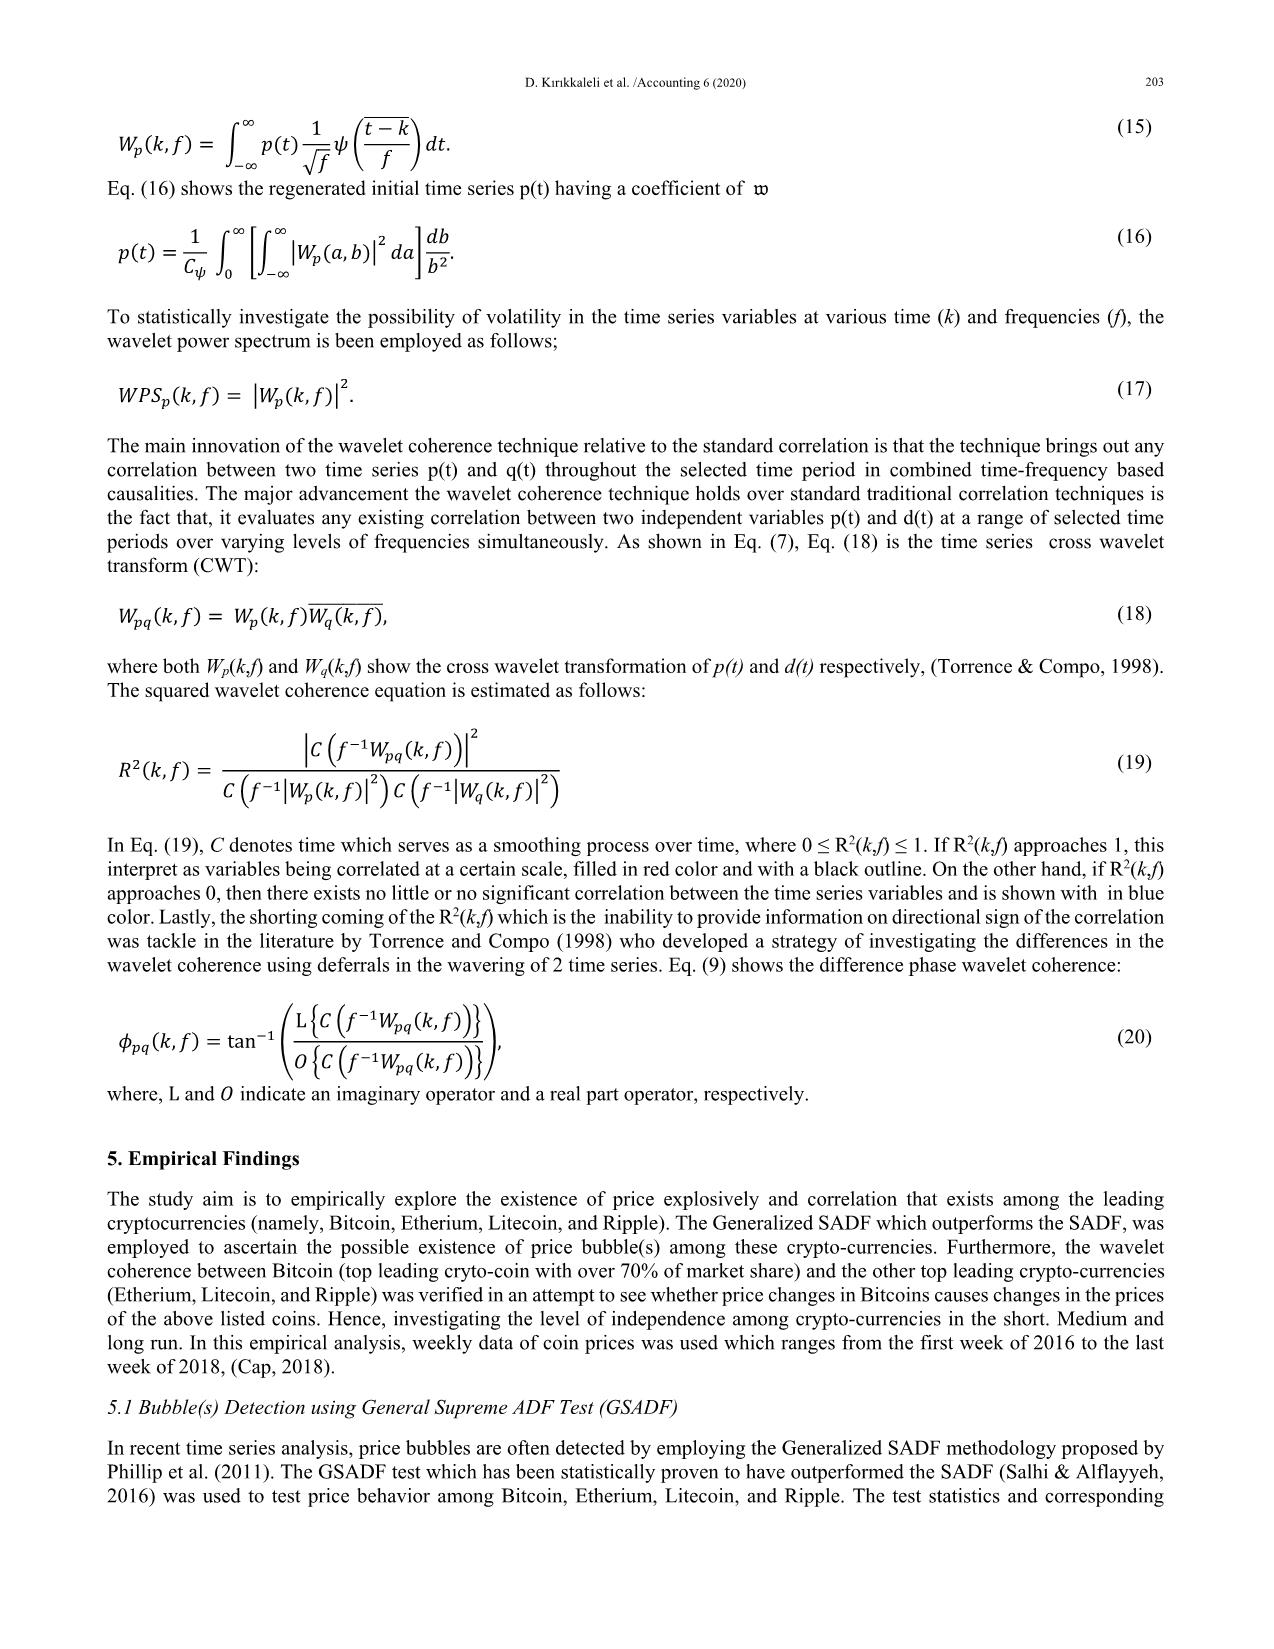
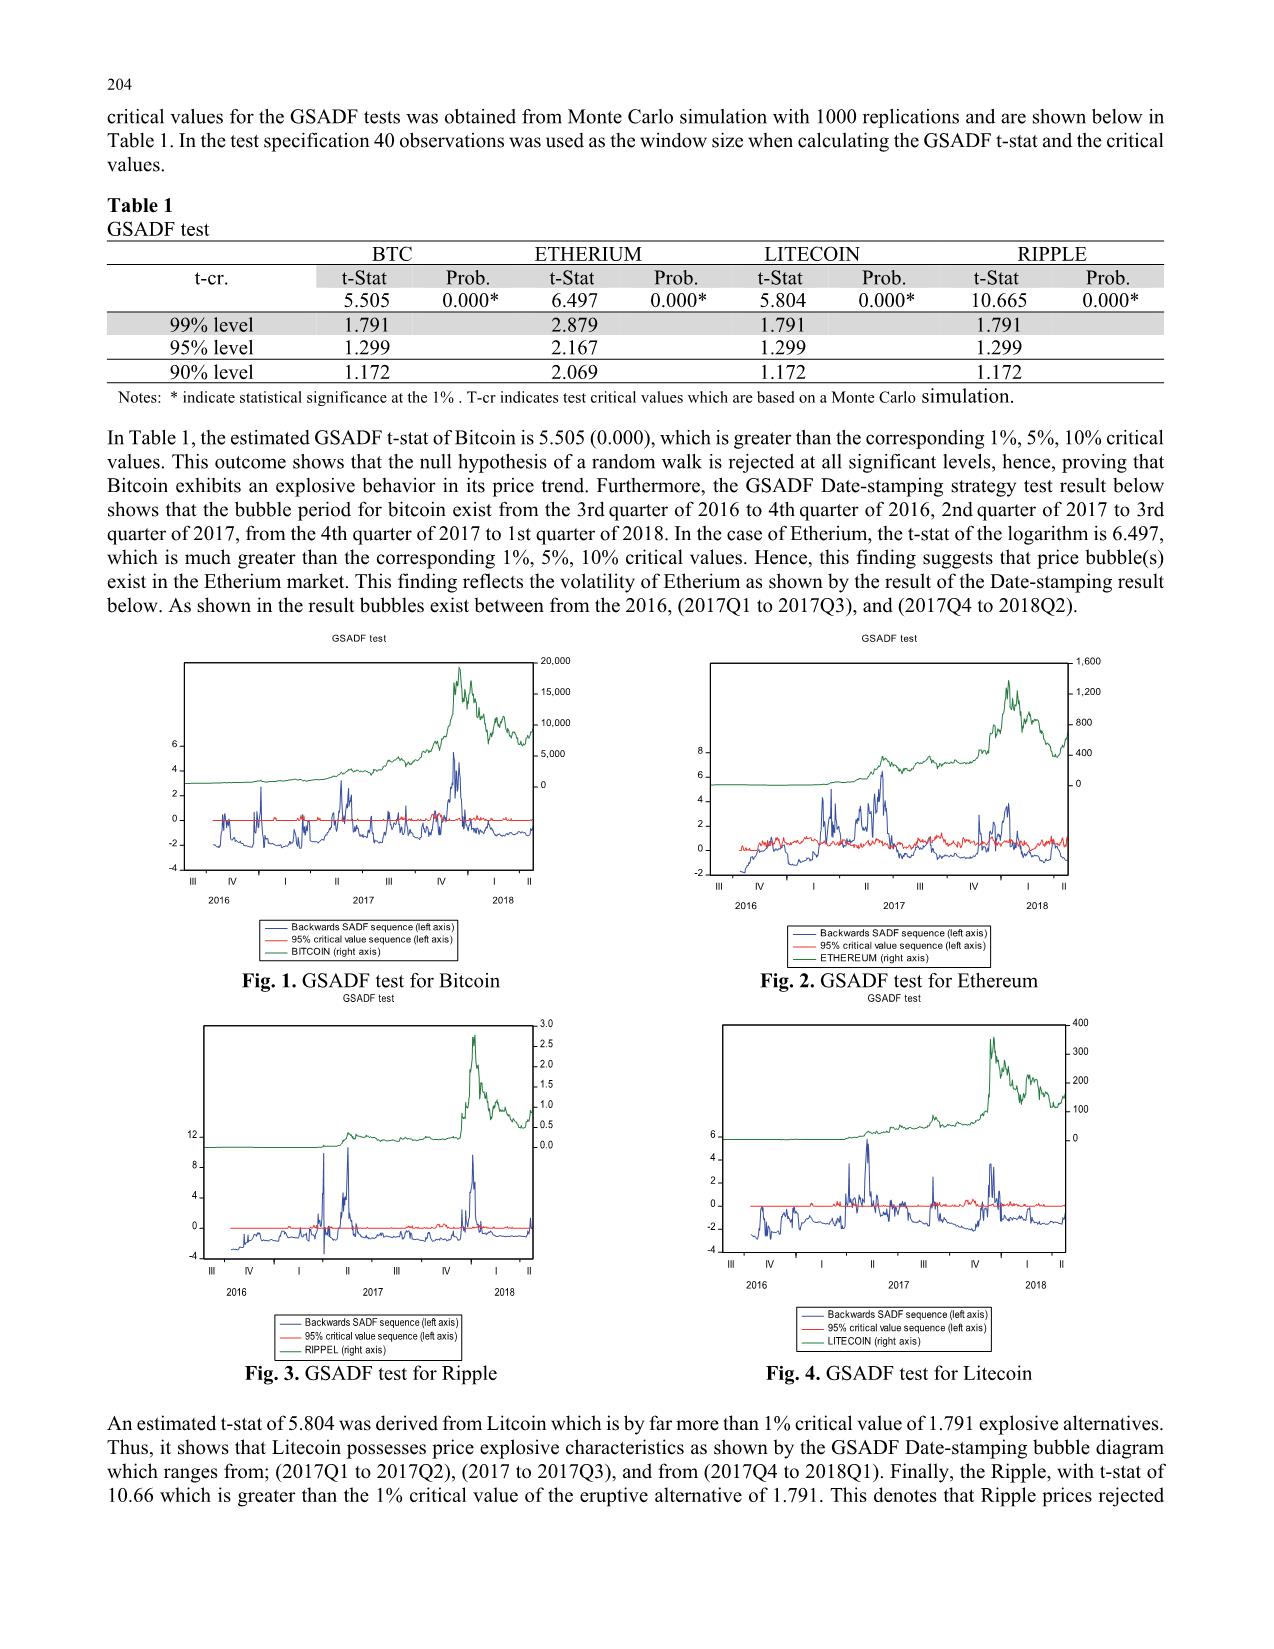
Fig. 3. GSADF test for Ripple Fig. 4. GSADF test for Litecoin
An estimated t-stat of 5.804 was derived from Litcoin which is by far more than 1% critical value of 1.791 explosive alternatives.
Thus, it shows that Litecoin possesses price explosive characteristics as shown by the GSADF Date-stamping bubble diagram
which ranges from; (2017Q1 to 2017Q2), (2017 to 2017Q3), and from (2017Q4 to 2018Q1). Finally, the Ripple, with t-stat of
10.66 which is greater than the 1% critical value of the eruptive alternative of 1.791. This denotes that Ripple prices rejected
D. Kırıkkaleli et al. /Accounting 6 (2020) 205
the null hypothesis of a random walk, showing a significant level of price bubble in the series and this bubble phases are been
captured in the GSADF Date-stamping result. This bubble periods ranges from the (2017Q1 to 2017Q2), and between the 4th
quarter of 2017 to the 1st quarter of 2018.
5.2 Power Spectrum Interpretation
As explained earlier in the methodology section, the power spectrum shows the areas of high and low amplitude and also the
magnitude of the volatility in a particular region in the data set. Below are the power spectra for crypto-currencies employed
in this study.
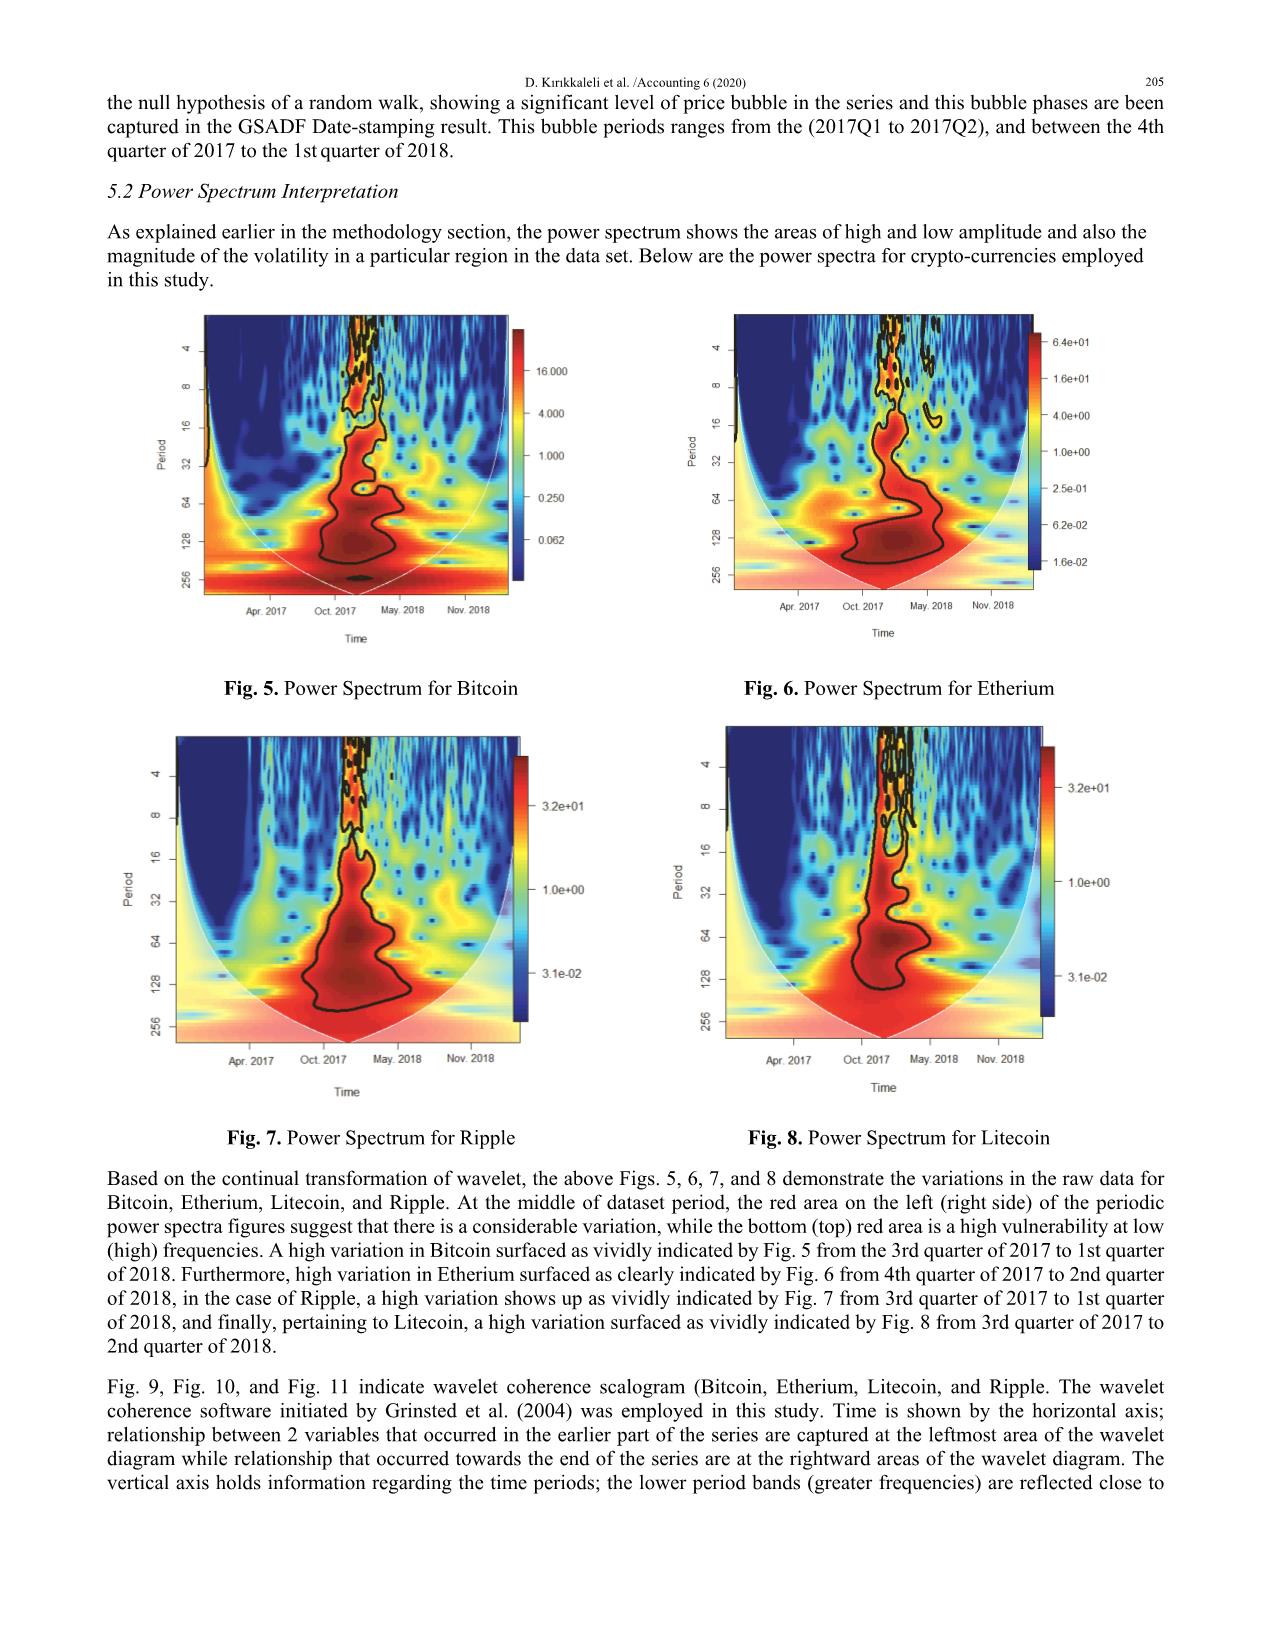
Fig. 5. Power Spectrum for Bitcoin Fig. 6. Power Spectrum for Etherium
Fig. 7. Power Spectrum for Ripple Fig. 8. Power Spectrum for Litecoin
Based on the continual transformation of wavelet, the above Figs. 5, 6, 7, and 8 demonstrate the variations in the raw data for
Bitcoin, Etherium, Litecoin, and Ripple. At the middle of dataset period, the red area on the left (right side) of the periodic
power spectra figures suggest that there is a considerable variation, while the bottom (top) red area is a high vulnerability at low
(high) frequencies. A high variation in Bitcoin surfaced as vividly indicated by Fig. 5 from the 3rd quarter of 2017 to 1st quarter
of 2018. Furthermore, high variation in Etherium surfaced as clearly indicated by Fig. 6 from 4th quarter of 2017 to 2nd quarter
of 2018, in the case of Ripple, a high variation shows up as vividly indicated by Fig. 7 from 3rd quarter of 2017 to 1st quarter
of 2018, and finally, pertaining to Litecoin, a high variation surfaced as vividly indicated by Fig. 8 from 3rd quarter of 2017 to
2nd quarter of 2018.
Fig. 9, Fig. 10, and Fig. 11 indicate wavelet coherence scalogram (Bitcoin, Etherium, Litecoin, and Ripple. The wavelet
coherence software initiated by Grinsted et al. (2004) was employed in this study. Time is shown by the horizontal axis;
relationship between 2 variables that occurred in the earlier part of the series are captured at the leftmost area of the wavelet
diagram while relationship that occurred towards the end of the series are at the rightward areas of the wavelet diagram. The
vertical axis holds information regarding the time periods; the lower period bands (greater frequencies) are reflected close to
 206
the top and the lower frequencies (higher bands) close to the bottom. The wavelets coherence indicates the regions of the time-
frequency space in which the two series move simultaneously. In the inner sphere of the time-frequency space, the warmer the
color, the higher the coherence (that can be construed as correlation); the colors used on this work, range from dark blue
(0, indicates coherence does not surface) to dark red (1, reflects strong correlation). A thick black line surrounds statistically
significant regions of coherence. Two things appear in the direction of the arrows: the correlation and the time series at that
point leading the relationship. Arrows pointing leftwards reflects anti-phase, implying that there is negative relationship between
the two-time series while arrows pointing rightwards indicates in-phase which implies that there is positive relationship between
the two-time series. On the other hand, a downward pointing arrow suggests the first series leads the second which interpret as;
prices behaviors in the first series causes subsequent price behaviors in the second series, vice versa.
Although, the time series perceived are finite, not every data is necessary for the areas at the beginning and end of the data
(particularly for the higher periods). One option selected is to pad the data set with nulls were necessary to make computing
viable. Null padding will, however, affect the results reliability. This distinction in the reliability of results should be depicted
by using a cone of influence. The pale colors portray those regions with little reliable results outside the cone of influence. More
data are required in higher bands to calculate the cone structure. Figs. 9, 10 and 11 show the scalograms of the wavelet coherence
between Bitcoin and varying combinations of other crypto-currencies (Etherium, Ripple, and Litecoin). The scalograms for all
relationships are estimated separately. A view of a series enables the comparison with different crypto-currencies of any
associations with Bitcoin. Staring down, a column shows how Bitcoin is correlated with a certain crypto-currency. The shaded
red areas suggest places within the pricing series of crypto-currencies recognized as bubble-like structures utilizing the GSADF
bubble test discussed earlier. However, it should be observed that for Bitcoin, Etherium, Ripple and Litecoin between 2016 and
2018 the dark blue areas were due to a shortage of data for these metrics before 2016. In order to be clear, it is necessary to
define the short, medium and long term explicitly. Throughout this work, 2–4 and 4–8 days’ period band are referred to short
term. The medium-term refers to 8–16, and 16–32 days’ period band. 32–64, and 64–256-days period bands are referred to as
the long-term.
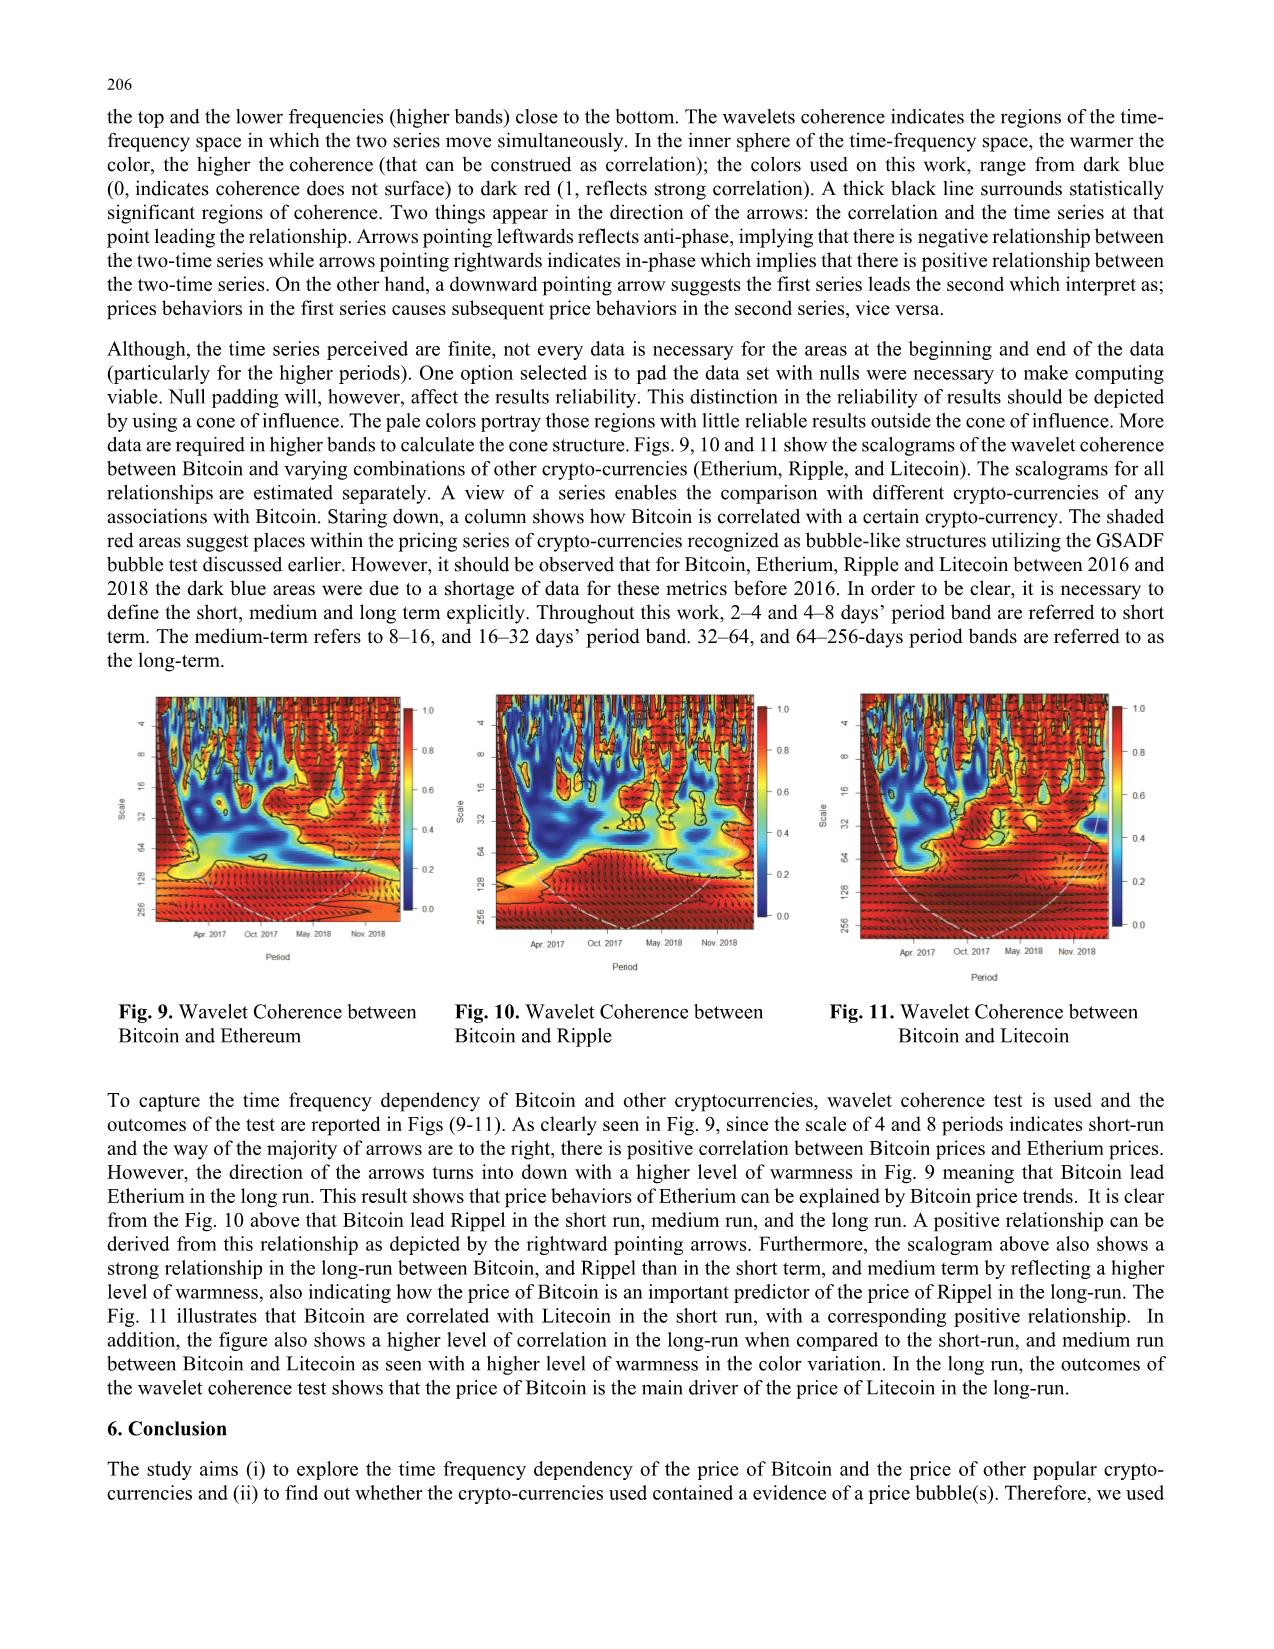
Fig. 9. Wavelet Coherence between
Bitcoin and Ethereum
Fig. 10. Wavelet Coherence between
Bitcoin and Ripple
Fig. 11. Wavelet Coherence between
Bitcoin and Litecoin
To capture the time frequency dependency of Bitcoin and other cryptocurrencies, wavelet coherence test is used and the
outcomes of the test are reported in Figs (9-11). As clearly seen in Fig. 9, since the scale of 4 and 8 periods indicates short-run
and the way of the majority of arrows are to the right, there is positive correlation between Bitcoin prices and Etherium prices.
However, the direction of the arrows turns into down with a higher level of warmness in Fig. 9 meaning that Bitcoin lead
Etherium in the long run. This result shows that price behaviors of Etherium can be explained by Bitcoin price trends. It is clear
from the Fig. 10 above that Bitcoin lead Rippel in the short run, medium run, and the long run. A positive relationship can be
derived from this relationship as depicted by the rightward pointing arrows. Furthermore, the scalogram above also shows a
strong relationship in the long-run between Bitcoin, and Rippel than in the short term, and medium term by reflecting a higher
level of warmness, also indicating how the price of Bitcoin is an important predictor of the price of Rippel in the long-run. The
Fig. 11 illustrates that Bitcoin are correlated with Litecoin in the short run, with a corresponding positive relationship. In
addition, the figure also shows a higher level of correlation in the long-run when compared to the short-run, and medium run
between Bitcoin and Litecoin as seen with a higher level of warmness in the color variation. In the long run, the outcomes of
the wavelet coherence test shows that the price of Bitcoin is the main driver of the price of Litecoin in the long-run.
6. Conclusion
The study aims (i) to explore the time frequency dependency of the price of Bitcoin and the price of other popular crypto-
currencies and (ii) to find out whether the crypto-currencies used contained a evidence of a price bubble(s). Therefore, we used
D. Kırıkkaleli et al. /Accounting 6 (2020) 207
wavelet coherence and GSADF approaches in the present study. The outcome reveals the existence of bubbles among all the
variables considered in the study. The outcomes from the wavelet coherence analysis further shed more light into the
relationship between Bitcoin and its counterparts. The main finding reflects that there exists a short term, medium term, and
long-term relationships among the crypto-currencies. Based on the results of the GSADF test and further analysis, some
explanations are provided based on the strong long-term relationship between the variables.
These findings are useful for anyone who explores Bitcoin's dependency on other crypto-currencies in academia or industry.
The reinforcement of bubble relationship also shows how crypto-currencies can be utilized as speculative assets. Coherence
strengthening is far less prominent in the short and medium term in bubble regimes. In the short run, daily news items and
intraday trading activities can hide the consequences of bubbles. Furthermore, the relationship between Bitcoin and its
counterparts (Etherium, Ripples, and Litecoin) is also shown to be inconsistent and generally weak in the short and medium-
term. However, there is proof that Bitcoin will lead in the medium and long term when it comes to compare with the other
crypto-currencies.
With regards to the links between different crypto-currencies, significant correlation between these coins is noted in the short
term, due to the similar financial characteristics they possess. It is shown that short-term correlations between crypto-currencies
are again based on news items and broad events on the market. Substantially, the results outlined here are expected to stimulate
further work in this field, particularly in relation to bubble dynamics in crypto-currency markets, and how changes in Bitcoin
price affect them over time. In addition, a short-term relationship between crypto-currencies and speculative activities might
warrant research on mechanisms that influence crypto-currency markets in the events such as news items possibly in the same
way as for other asset classes, and might lead to a portfolio-balancing strategy to adapt automatically to the market news.
References
Astill, S., Harvey, D. I., Leybourne, S. J., & Taylor, A. R. (2017). Tests for an end-of-sample bubble in financial time series.
Econometric Reviews, 36(6-9), 651-666.
Bariviera, A. F., Basgall, M. J., Hasperué, W., & Naiouf, M. (2017). Some stylized facts of the Bitcoin market. Physica A:
Statistical Mechanics and its Applications, 484, 82-90.
Baur, D. G., Dimpfl, T., & Kuck, K. (2018). Bitcoin, gold and the US dollar–A replication and extension. Finance Research
Letters, 25, 103-110.
Bouri, E., Gupta, R., Lahiani, A., & Shahbaz, M. (2018). Testing for asymmetric nonlinear short-and long-run relationships
between bitcoin, aggregate commodity and gold prices. Resources Policy, 57, 224-235.
Cap, C. M. (2018). Cryptocurrency market capitalizations. Retrieved on January, 21, 2018.
Chueng, A., Roca, E., & Su, J. J. (2015). Crypto-currency bubbles: an application of the Phillips–Shi–Yu (2013) methodology
on Mt. Gox bitcoin prices. Applied Economics, 47(23), 2348-2358.
Corbet, S., McHugh, G., & Meegan, A. (2017). The influence of central bank monetary policy announcements on cryptocurrency
return volatility. Investment Management & Financial Innovations, 14(4), 60.
Dickey, D. A., & Fuller, W. A. (1979). Distribution of the estimators for autoregressive time series with a unit root. Journal of
the American Statistical Association, 74(366a), 427-431.
Dyhrberg, A. H. (2016). Bitcoin, gold and the dollar–A GARCH volatility analysis. Finance Research Letters, 16, 85-92.
Fantazzini, D. (2016). The oil price crash in 2014/15: Was there a (negative) financial bubble?. Energy Policy, 96, 383-396.
Fry, J., & Cheah, E. T. (2016). Negative bubbles and shocks in cryptocurrency markets. International Review of Financial
Analysis, 47, 343-352.
Goupillaud, P., Grossmann, A., & Morlet, J. (1984). Cycle-octave and related transforms in seismic signal analysis.
Geoexploration, 23(1), 85-102.
Grinsted, A., Moore, J. C., & Jevrejeva, S. (2004). Application of the cross wavelet transform and wavelet coherence to
geophysical time series. Nonlinear Processes in Geophysics, 11(5/6), 561-566.
Kristoufek, L. (2013). BitCoin meets Google Trends and Wikipedia: Quantifying the relationship between phenomena of the
Internet era. Scientific reports, 3, 3415.
Larsen, E. S. (1997). Theories and tests for bubbles (Master's thesis, Universitetet i Tromsø).
Osterrieder, J., & Lorenz, J. (2017). A statistical risk assessment of Bitcoin and its extreme tail behavior. Annals of Financial
Economics, 12(01), 1750003.
Pal, D., & Mitra, S. K. (2017). Time-frequency contained co-movement of crude oil and world food prices: A wavelet-based
analysis. Energy Economics, 62, 230-239.
Phillips, P.C.B., Shi, S., & Yu, J. (2012) Testing for multiple bubbles. Cowles Foundation Discussion Paper No.1843
Phillips, P. C., Wu, Y., & Yu, J. (2011). Explosive behavior in the 1990s Nasdaq: When did exuberance escalate asset
values?. International Economic Review, 52(1), 201-226.
Phillips, P. C., & Yu, J. (2011). Dating the timeline of financial bubbles during the subprime crisis. Quantitative
Economics, 2(3), 455-491.
 208
Phillips, P. C., Shi, S., & Yu, J. (2015). Testing for multiple bubbles: Historical episodes of exuberance and collapse in the S&P
500. International Economic Review, 56(4), 1043-1078.
Phillips, P. C., Wu, Y., & Yu, J. (2011). Explosive behavior in the 1990s Nasdaq: When did exuberance escalate asset values?.
International Economic Review, 52(1), 201-226.
Pichl, L., & Kaizoji, T. (2017). Volatility analysis of bitcoin. Quantitative Finance and Economics, 1, 474-485.
Salhi, B., & Alflayyeh, S. (2016). Impact of Speculation and Bubble Detection in Stock Markets: The Tunisian and the Moroccan
Cases. Journal of Management and Strategy, 7(2), 73-89.
Semiromi, B., & Reza, M. (2010). Literatures about asset price bubbles and monetary policies. In International Conference on
Applied Economics, ICOAE (Vol. 2010, pp. 695-703).
Su, C. W., Li, Z. Z., Tao, R., & Si, D. K. (2018). Testing for multiple bubbles in bitcoin markets: A generalized sup ADF test.
Japan and the World Economy, 46, 56-63.
Urquhart, A., & Zhang, H. (2018). Is Bitcoin a hedge or safe-haven for currencies. An intraday analysis, 1-25.
Torrence, C., & Compo, G. P. (1998). A practical guide to wavelet analysis. Bulletin of the American Meteorological society,
79(1), 61-78.
© 2019 by the authors; licensee Growing Science, Canada. This is an open access article distributed
under the terms and conditions of the Creative Commons Attribution (CC-BY) license
(
File đính kèm:
 crypto_currency_empirical_evidence_from_gsadf_and_wavelet_co.pdf

