Analysis of supply response of black tiger shrimp production using Nerlove model
This study aims to analyze the effect of black tiger shrimp price and other factors on the shrimp area
in the Mekong Delta using the supply response function based on the Nerlovian partial adjustment
model. Using quarterly panel data collected from four provinces (Ca Mau, Bac Lieu, Soc Trang, and
Kien Giang) for the period of 2014 to 2017, the estimates in the supply response are obtained from
Fixed-Effects (FE) method. Results indicate that the adaptive expectation hypothesis to the simple
Cobweb model is likely to best fit the data. The estimates of the supply response model show that
information used for expected price formation quickly responded in making a decision of black tiger
shrimp production. In both the short run and long run, the expected price has a significant effect in
directing black tiger shrimp farmers to formulate the supply response decision. The acreage response
elasticity is more elastic
Trang 1
Trang 2
Trang 3
Trang 4
Trang 5
Trang 6
Trang 7
Trang 8
Tóm tắt nội dung tài liệu: Analysis of supply response of black tiger shrimp production using Nerlove model
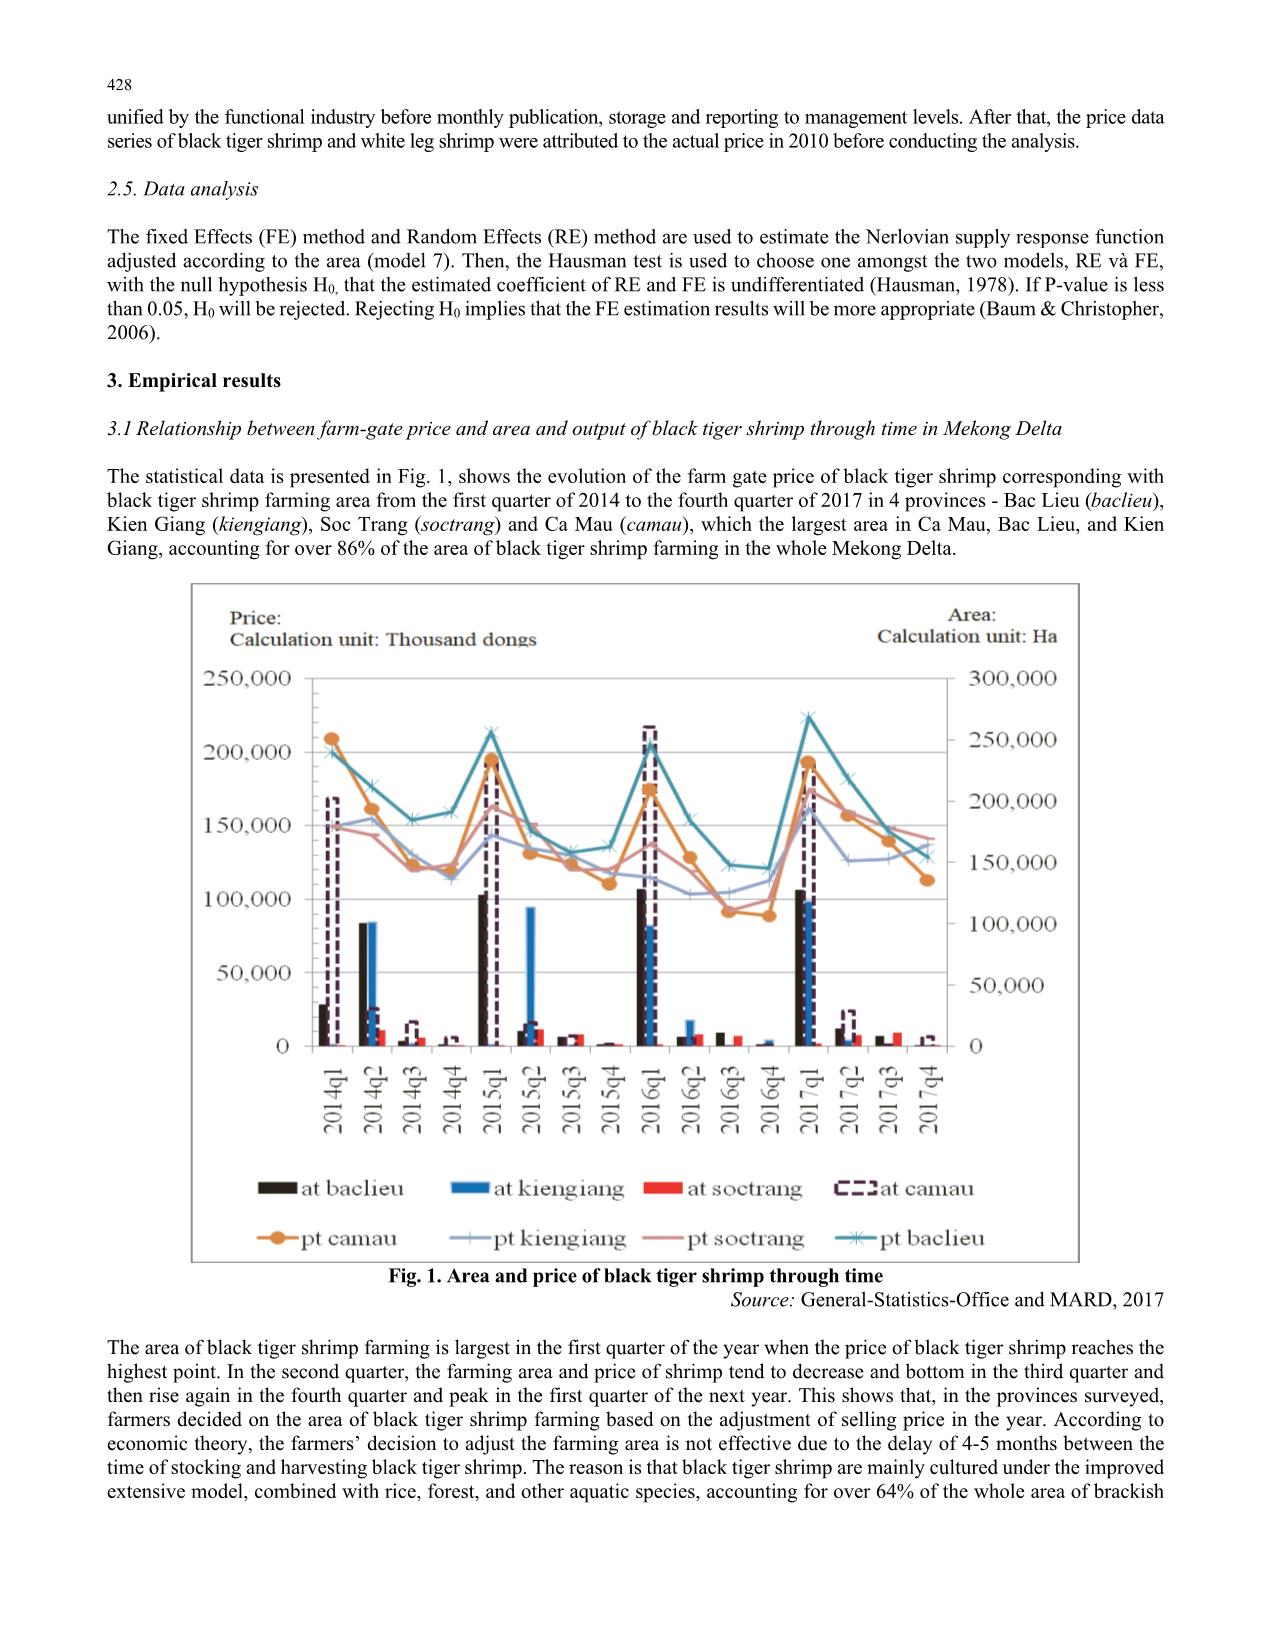
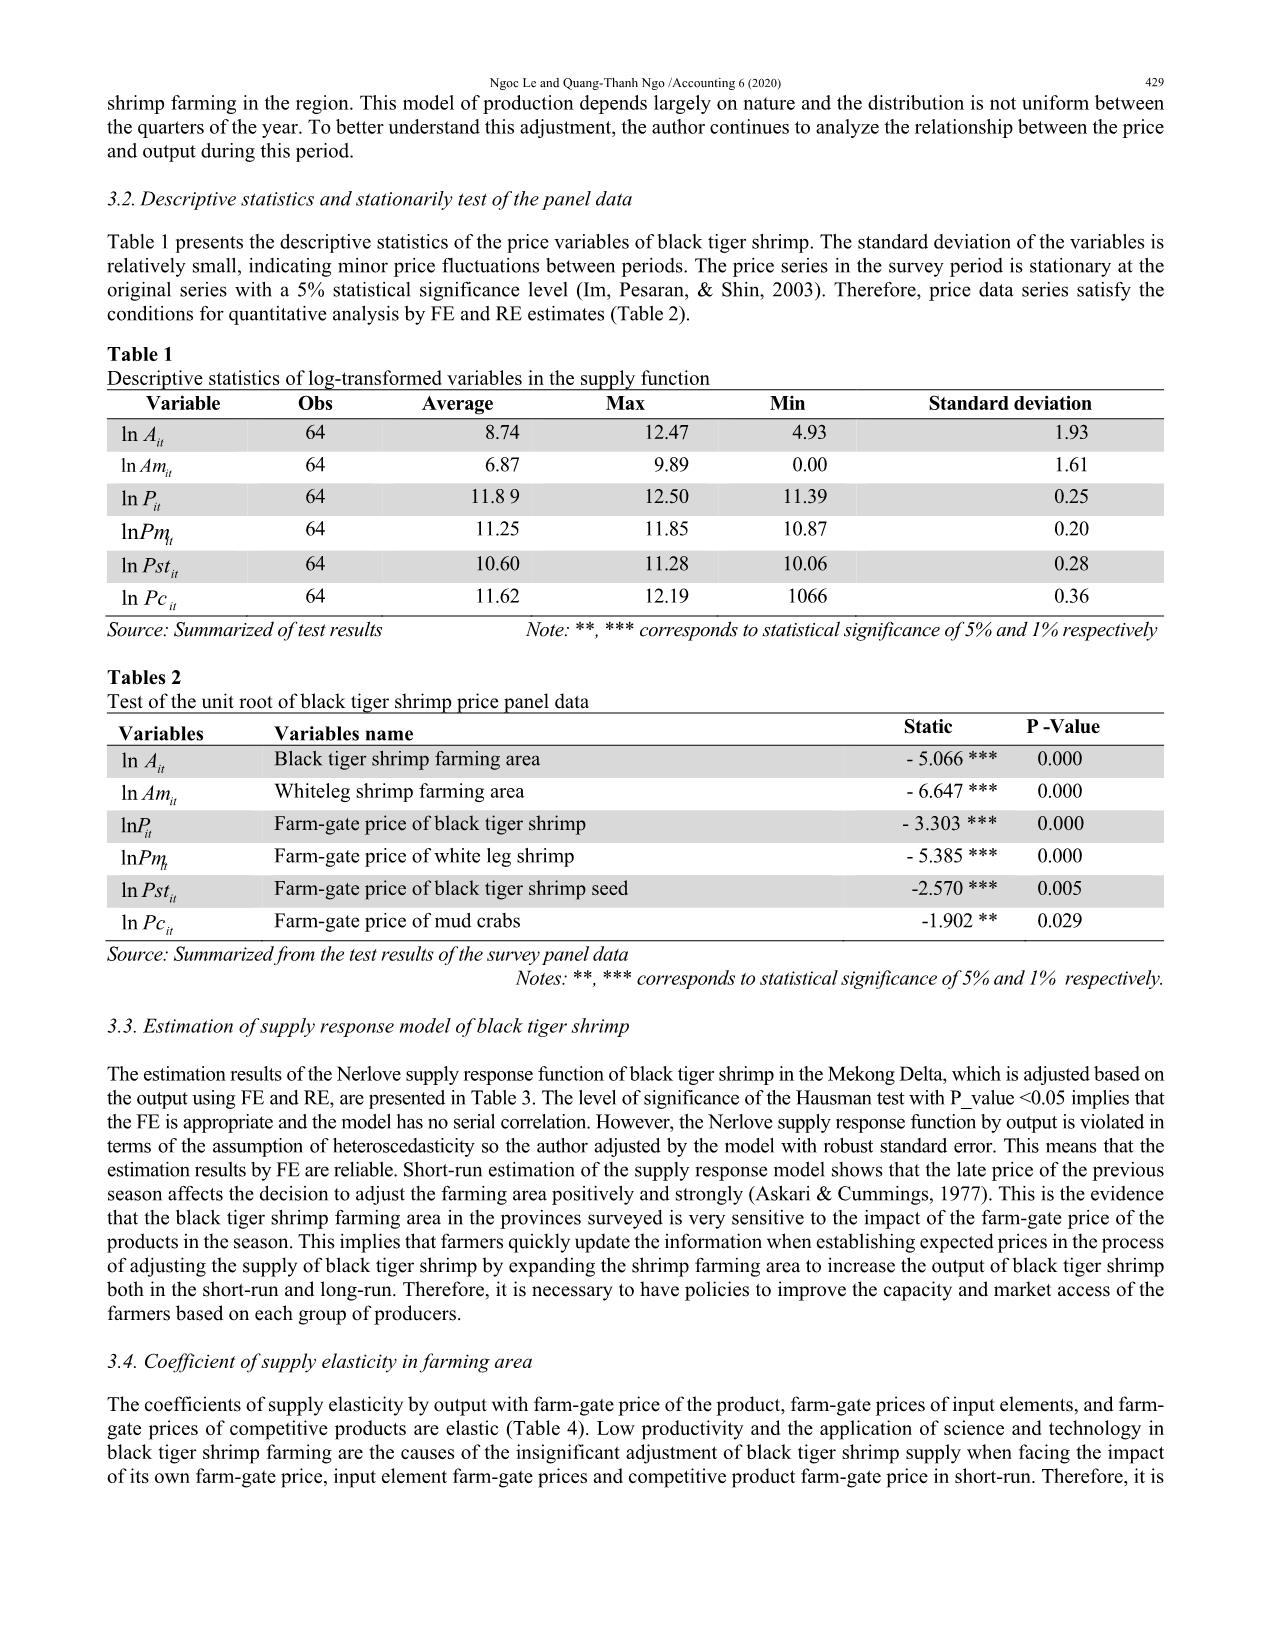
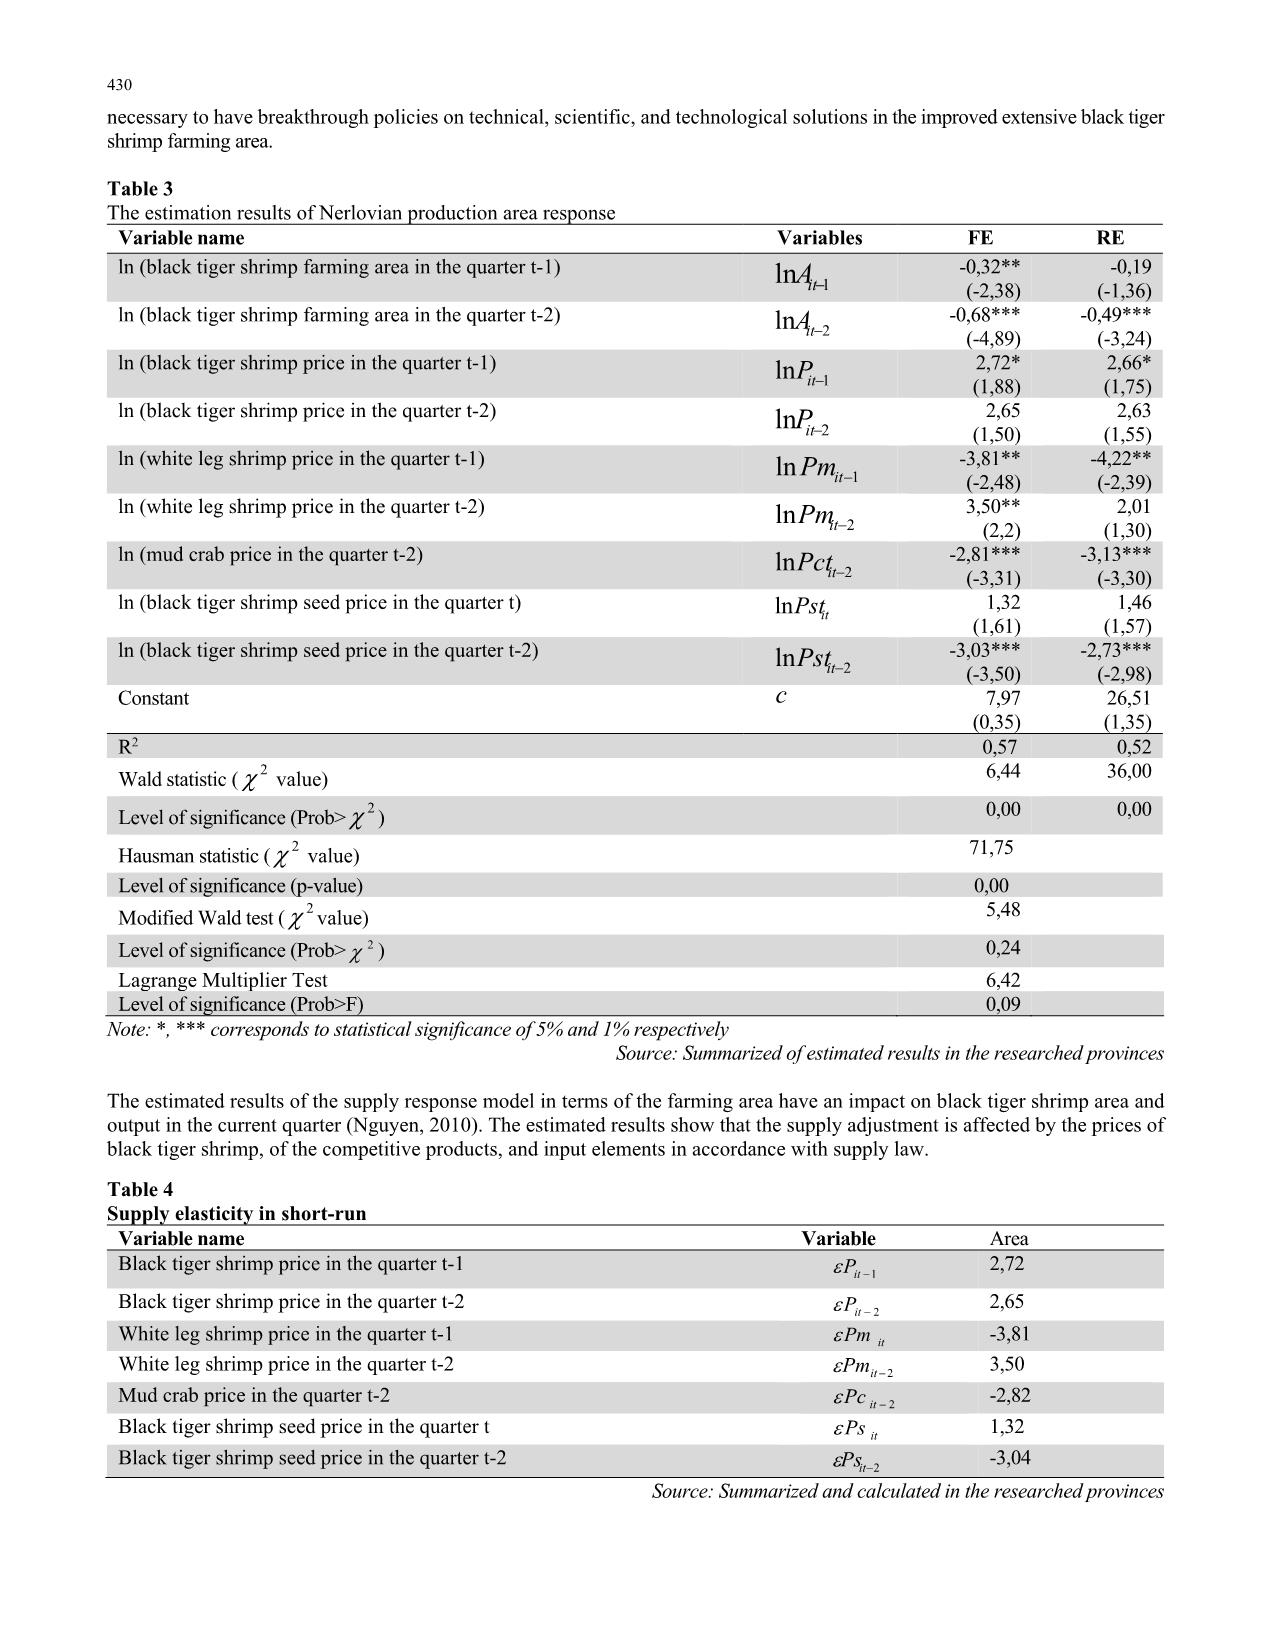
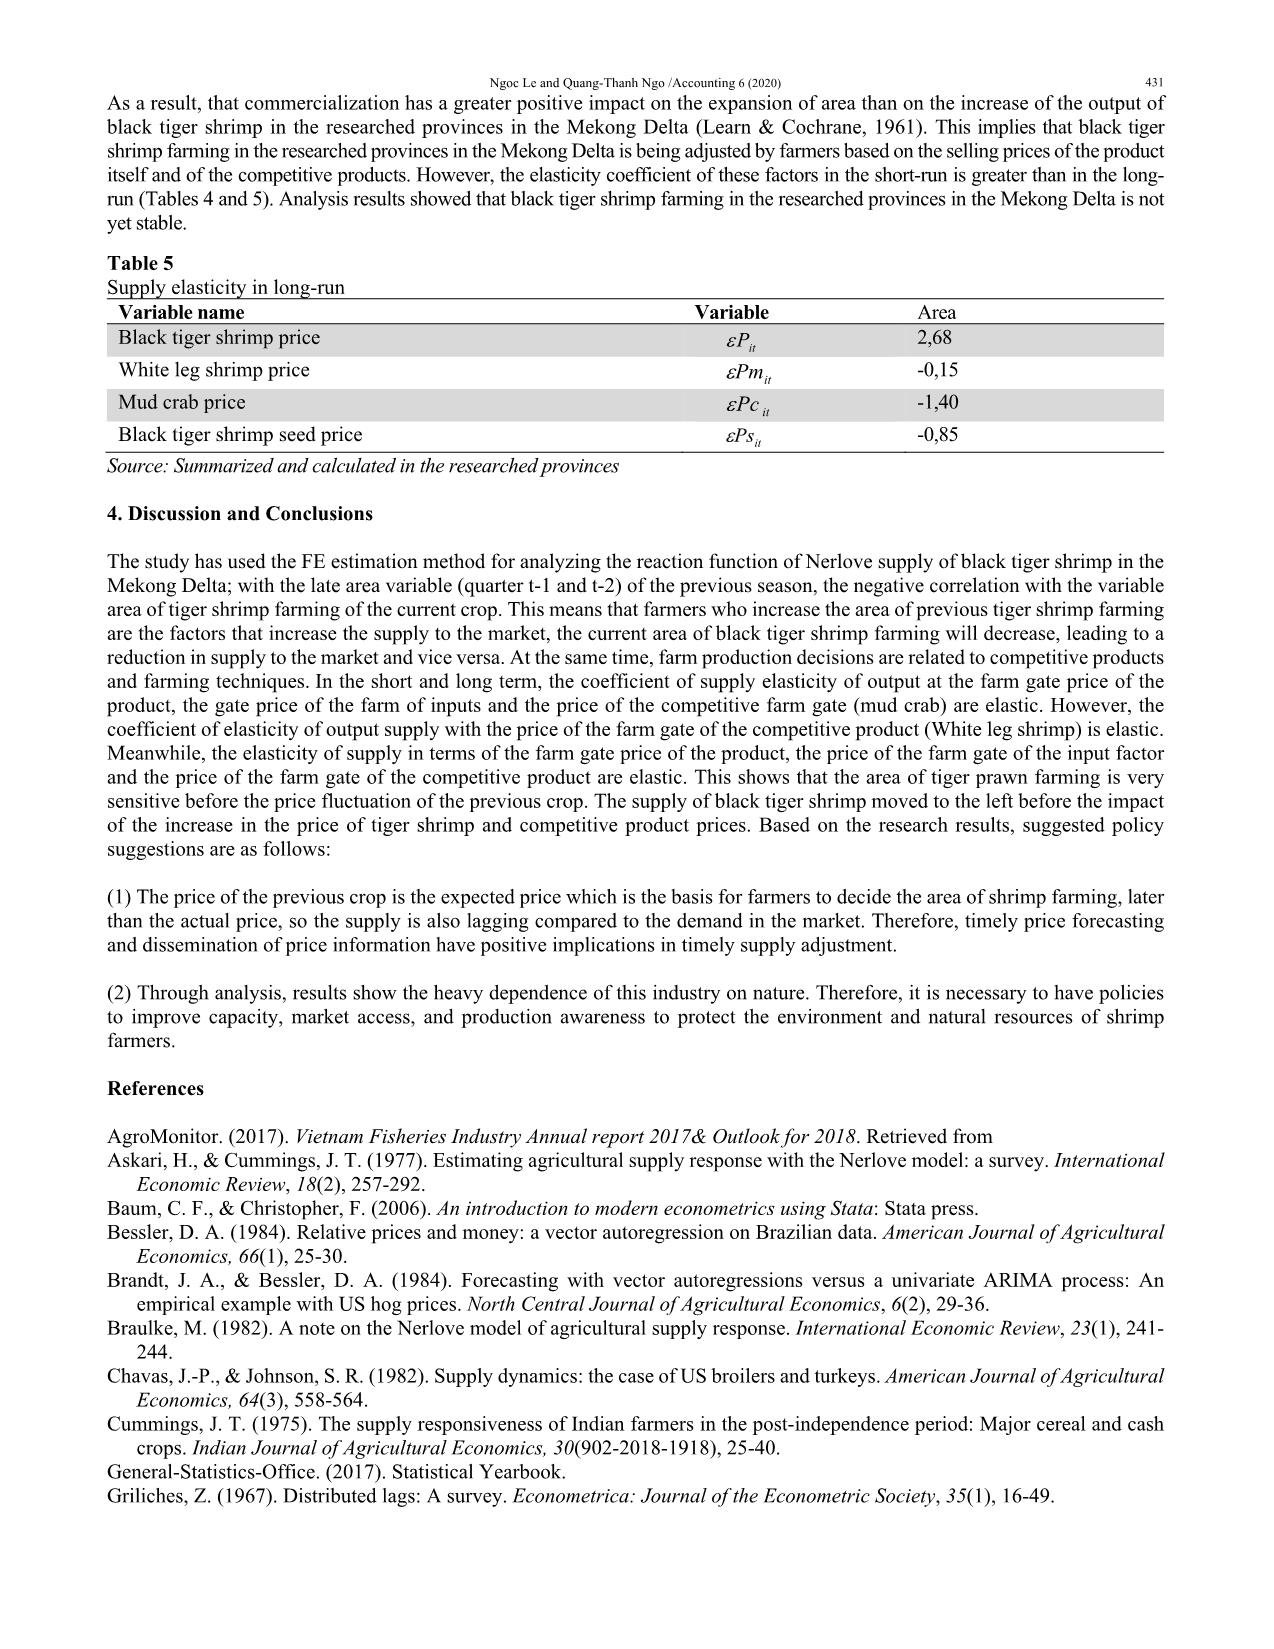
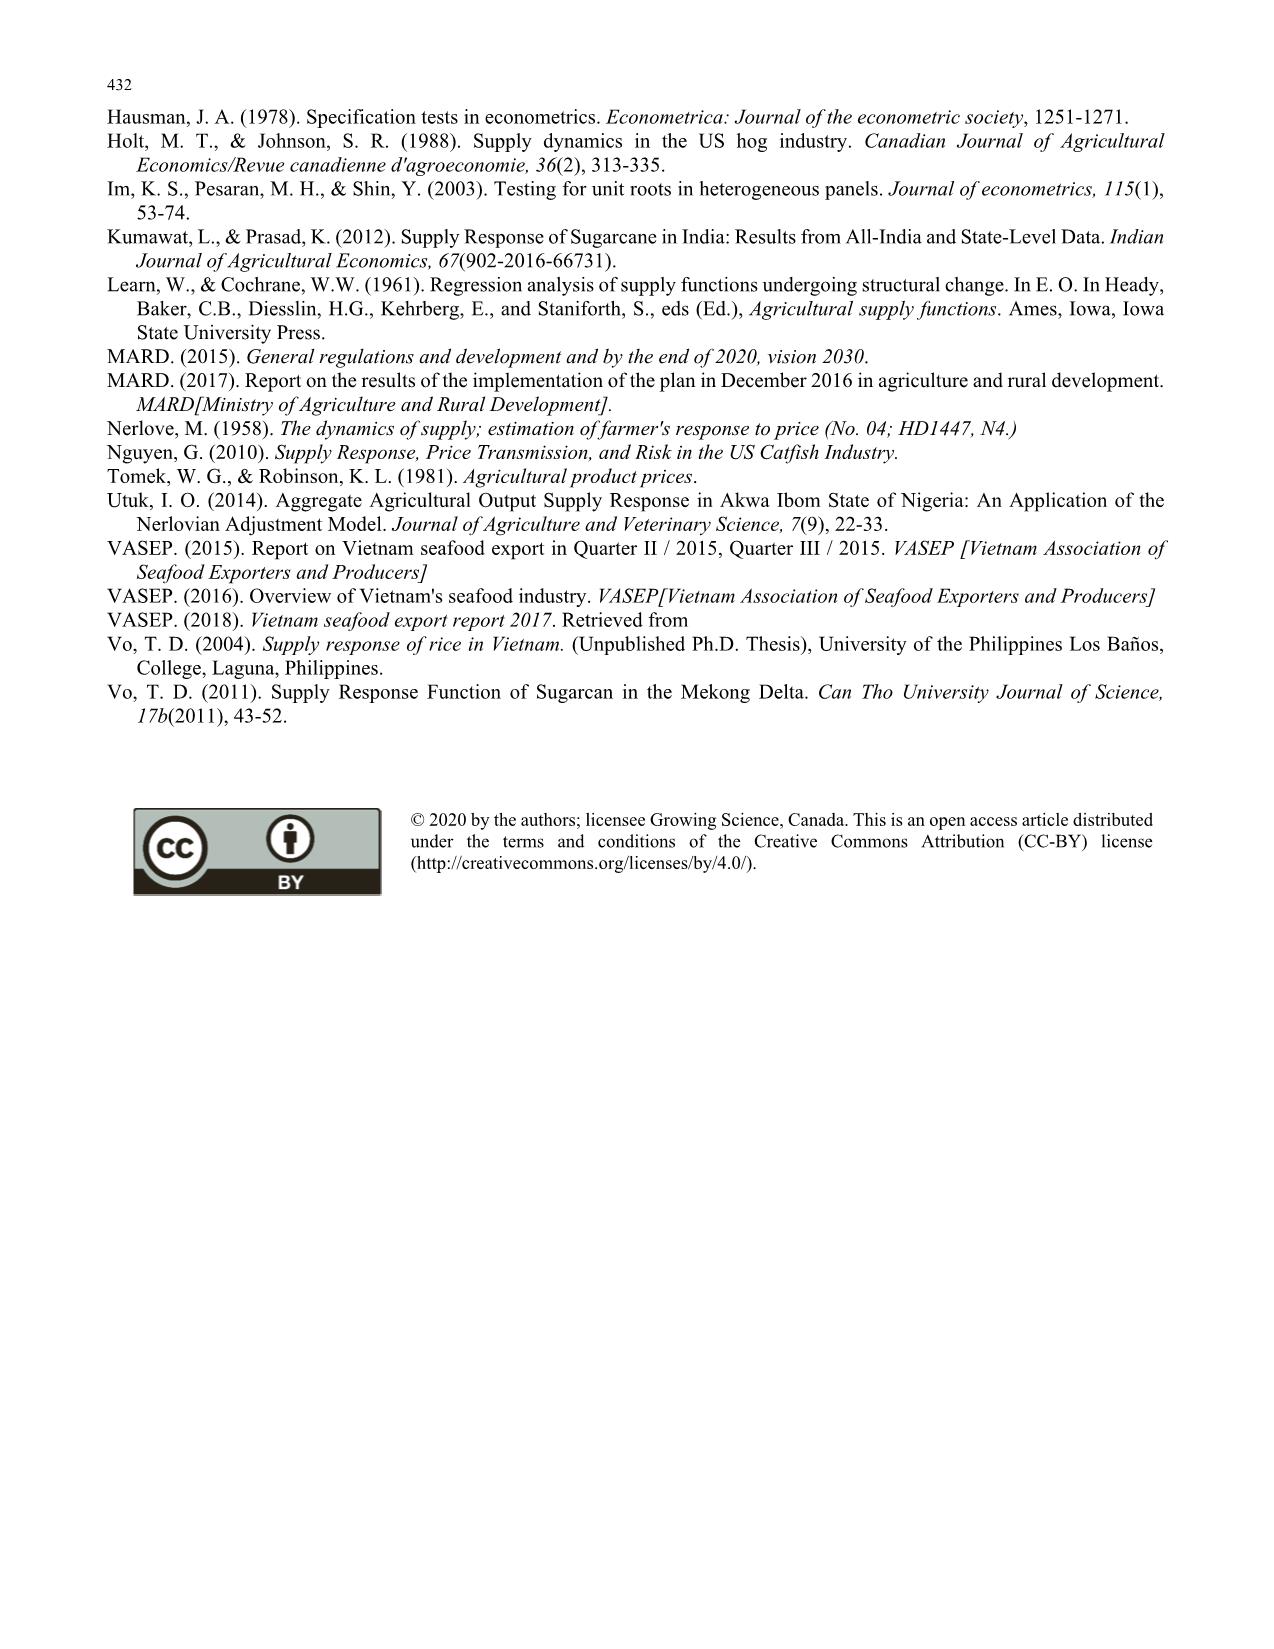
, Kien Giang (kiengiang), Soc Trang (soctrang) and Ca Mau (camau), which the largest area in Ca Mau, Bac Lieu, and Kien Giang, accounting for over 86% of the area of black tiger shrimp farming in the whole Mekong Delta. Fig. 1. Area and price of black tiger shrimp through time Source: General-Statistics-Office and MARD, 2017 The area of black tiger shrimp farming is largest in the first quarter of the year when the price of black tiger shrimp reaches the highest point. In the second quarter, the farming area and price of shrimp tend to decrease and bottom in the third quarter and then rise again in the fourth quarter and peak in the first quarter of the next year. This shows that, in the provinces surveyed, farmers decided on the area of black tiger shrimp farming based on the adjustment of selling price in the year. According to economic theory, the farmers’ decision to adjust the farming area is not effective due to the delay of 4-5 months between the time of stocking and harvesting black tiger shrimp. The reason is that black tiger shrimp are mainly cultured under the improved extensive model, combined with rice, forest, and other aquatic species, accounting for over 64% of the whole area of brackish Ngoc Le and Quang-Thanh Ngo /Accounting 6 (2020) 429 shrimp farming in the region. This model of production depends largely on nature and the distribution is not uniform between the quarters of the year. To better understand this adjustment, the author continues to analyze the relationship between the price and output during this period. 3.2. Descriptive statistics and stationarily test of the panel data Table 1 presents the descriptive statistics of the price variables of black tiger shrimp. The standard deviation of the variables is relatively small, indicating minor price fluctuations between periods. The price series in the survey period is stationary at the original series with a 5% statistical significance level (Im, Pesaran, & Shin, 2003). Therefore, price data series satisfy the conditions for quantitative analysis by FE and RE estimates (Table 2). Table 1 Descriptive statistics of log-transformed variables in the supply function Variable Obs Average Max Min Standard deviation itAln 64 8.74 12.47 4.93 1.93 itAmln 64 6.87 9.89 0.00 1.61 itPln 64 11.8 9 12.50 11.39 0.25 itPmln 64 11.25 11.85 10.87 0.20 itPstln 64 10.60 11.28 10.06 0.28 itPcln 64 11.62 12.19 1066 0.36 Source: Summarized of test results Note: **, *** corresponds to statistical significance of 5% and 1% respectively Tables 2 Test of the unit root of black tiger shrimp price panel data Variables Variables name Static P -Value itAln Black tiger shrimp farming area - 5.066 *** 0.000 itAmln Whiteleg shrimp farming area - 6.647 *** 0.000 itPln Farm-gate price of black tiger shrimp - 3.303 *** 0.000 itPmln Farm-gate price of white leg shrimp - 5.385 *** 0.000 itPstln Farm-gate price of black tiger shrimp seed -2.570 *** 0.005 itPcln Farm-gate price of mud crabs -1.902 ** 0.029 Source: Summarized from the test results of the survey panel data Notes: **, *** corresponds to statistical significance of 5% and 1% respectively. 3.3. Estimation of supply response model of black tiger shrimp The estimation results of the Nerlove supply response function of black tiger shrimp in the Mekong Delta, which is adjusted based on the output using FE and RE, are presented in Table 3. The level of significance of the Hausman test with P_value <0.05 implies that the FE is appropriate and the model has no serial correlation. However, the Nerlove supply response function by output is violated in terms of the assumption of heteroscedasticity so the author adjusted by the model with robust standard error. This means that the estimation results by FE are reliable. Short-run estimation of the supply response model shows that the late price of the previous season affects the decision to adjust the farming area positively and strongly (Askari & Cummings, 1977). This is the evidence that the black tiger shrimp farming area in the provinces surveyed is very sensitive to the impact of the farm-gate price of the products in the season. This implies that farmers quickly update the information when establishing expected prices in the process of adjusting the supply of black tiger shrimp by expanding the shrimp farming area to increase the output of black tiger shrimp both in the short-run and long-run. Therefore, it is necessary to have policies to improve the capacity and market access of the farmers based on each group of producers. 3.4. Coefficient of supply elasticity in farming area The coefficients of supply elasticity by output with farm-gate price of the product, farm-gate prices of input elements, and farm- gate prices of competitive products are elastic (Table 4). Low productivity and the application of science and technology in black tiger shrimp farming are the causes of the insignificant adjustment of black tiger shrimp supply when facing the impact of its own farm-gate price, input element farm-gate prices and competitive product farm-gate price in short-run. Therefore, it is 430 necessary to have breakthrough policies on technical, scientific, and technological solutions in the improved extensive black tiger shrimp farming area. Table 3 The estimation results of Nerlovian production area response Variable name Variables FE RE ln (black tiger shrimp farming area in the quarter t-1) 1ln itA -0,32** (-2,38) -0,19 (-1,36) ln (black tiger shrimp farming area in the quarter t-2) 2ln itA -0,68*** (-4,89) -0,49*** (-3,24) ln (black tiger shrimp price in the quarter t-1) 1ln itP 2,72* (1,88) 2,66* (1,75) ln (black tiger shrimp price in the quarter t-2) 2ln itP 2,65 (1,50) 2,63 (1,55) ln (white leg shrimp price in the quarter t-1) 1ln itPm -3,81** (-2,48) -4,22** (-2,39) ln (white leg shrimp price in the quarter t-2) 2ln itPm 3,50** (2,2) 2,01 (1,30) ln (mud crab price in the quarter t-2) 2ln itPct -2,81*** (-3,31) -3,13*** (-3,30) ln (black tiger shrimp seed price in the quarter t) itPstln 1,32 (1,61) 1,46 (1,57) ln (black tiger shrimp seed price in the quarter t-2) 2ln itPst -3,03*** (-3,50) -2,73*** (-2,98) Constant c 7,97 (0,35) 26,51 (1,35) R2 0,57 0,52 Wald statistic ( 2 value) 6,44 36,00 Level of significance (Prob> 2 ) 0,00 0,00 Hausman statistic ( 2 value) 71,75 Level of significance (p-value) 0,00 Modified Wald test ( 2 value) 5,48 Level of significance (Prob> 2 ) 0,24 Lagrange Multiplier Test 6,42 Level of significance (Prob>F) 0,09 Note: *, *** corresponds to statistical significance of 5% and 1% respectively Source: Summarized of estimated results in the researched provinces The estimated results of the supply response model in terms of the farming area have an impact on black tiger shrimp area and output in the current quarter (Nguyen, 2010). The estimated results show that the supply adjustment is affected by the prices of black tiger shrimp, of the competitive products, and input elements in accordance with supply law. Table 4 Supply elasticity in short-run Variable name Variable Area Black tiger shrimp price in the quarter t-1 1 itP 2,72 Black tiger shrimp price in the quarter t-2 2 itP 2,65 White leg shrimp price in the quarter t-1 itPm -3,81 White leg shrimp price in the quarter t-2 2 itPm 3,50 Mud crab price in the quarter t-2 2 itPc -2,82 Black tiger shrimp seed price in the quarter t itPs 1,32 Black tiger shrimp seed price in the quarter t-2 2 itPs -3,04 Source: Summarized and calculated in the researched provinces Ngoc Le and Quang-Thanh Ngo /Accounting 6 (2020) 431 As a result, that commercialization has a greater positive impact on the expansion of area than on the increase of the output of black tiger shrimp in the researched provinces in the Mekong Delta (Learn & Cochrane, 1961). This implies that black tiger shrimp farming in the researched provinces in the Mekong Delta is being adjusted by farmers based on the selling prices of the product itself and of the competitive products. However, the elasticity coefficient of these factors in the short-run is greater than in the long- run (Tables 4 and 5). Analysis results showed that black tiger shrimp farming in the researched provinces in the Mekong Delta is not yet stable. Table 5 Supply elasticity in long-run Variable name Variable Area Black tiger shrimp price itP 2,68 White leg shrimp price itPm -0,15 Mud crab price itPc -1,40 Black tiger shrimp seed price itPs -0,85 Source: Summarized and calculated in the researched provinces 4. Discussion and Conclusions The study has used the FE estimation method for analyzing the reaction function of Nerlove supply of black tiger shrimp in the Mekong Delta; with the late area variable (quarter t-1 and t-2) of the previous season, the negative correlation with the variable area of tiger shrimp farming of the current crop. This means that farmers who increase the area of previous tiger shrimp farming are the factors that increase the supply to the market, the current area of black tiger shrimp farming will decrease, leading to a reduction in supply to the market and vice versa. At the same time, farm production decisions are related to competitive products and farming techniques. In the short and long term, the coefficient of supply elasticity of output at the farm gate price of the product, the gate price of the farm of inputs and the price of the competitive farm gate (mud crab) are elastic. However, the coefficient of elasticity of output supply with the price of the farm gate of the competitive product (White leg shrimp) is elastic. Meanwhile, the elasticity of supply in terms of the farm gate price of the product, the price of the farm gate of the input factor and the price of the farm gate of the competitive product are elastic. This shows that the area of tiger prawn farming is very sensitive before the price fluctuation of the previous crop. The supply of black tiger shrimp moved to the left before the impact of the increase in the price of tiger shrimp and competitive product prices. Based on the research results, suggested policy suggestions are as follows: (1) The price of the previous crop is the expected price which is the basis for farmers to decide the area of shrimp farming, later than the actual price, so the supply is also lagging compared to the demand in the market. Therefore, timely price forecasting and dissemination of price information have positive implications in timely supply adjustment. (2) Through analysis, results show the heavy dependence of this industry on nature. Therefore, it is necessary to have policies to improve capacity, market access, and production awareness to protect the environment and natural resources of shrimp farmers. References AgroMonitor. (2017). Vietnam Fisheries Industry Annual report 2017& Outlook for 2018. Retrieved from Askari, H., & Cummings, J. T. (1977). Estimating agricultural supply response with the Nerlove model: a survey. International Economic Review, 18(2), 257-292. Baum, C. F., & Christopher, F. (2006). An introduction to modern econometrics using Stata: Stata press. Bessler, D. A. (1984). Relative prices and money: a vector autoregression on Brazilian data. American Journal of Agricultural Economics, 66(1), 25-30. Brandt, J. A., & Bessler, D. A. (1984). Forecasting with vector autoregressions versus a univariate ARIMA process: An empirical example with US hog prices. North Central Journal of Agricultural Economics, 6(2), 29-36. Braulke, M. (1982). A note on the Nerlove model of agricultural supply response. International Economic Review, 23(1), 241- 244. Chavas, J.-P., & Johnson, S. R. (1982). Supply dynamics: the case of US broilers and turkeys. American Journal of Agricultural Economics, 64(3), 558-564. Cummings, J. T. (1975). The supply responsiveness of Indian farmers in the post-independence period: Major cereal and cash crops. Indian Journal of Agricultural Economics, 30(902-2018-1918), 25-40. General-Statistics-Office. (2017). Statistical Yearbook. Griliches, Z. (1967). Distributed lags: A survey. Econometrica: Journal of the Econometric Society, 35(1), 16-49. 432 Hausman, J. A. (1978). Specification tests in econometrics. Econometrica: Journal of the econometric society, 1251-1271. Holt, M. T., & Johnson, S. R. (1988). Supply dynamics in the US hog industry. Canadian Journal of Agricultural Economics/Revue canadienne d'agroeconomie, 36(2), 313-335. Im, K. S., Pesaran, M. H., & Shin, Y. (2003). Testing for unit roots in heterogeneous panels. Journal of econometrics, 115(1), 53-74. Kumawat, L., & Prasad, K. (2012). Supply Response of Sugarcane in India: Results from All-India and State-Level Data. Indian Journal of Agricultural Economics, 67(902-2016-66731). Learn, W., & Cochrane, W.W. (1961). Regression analysis of supply functions undergoing structural change. In E. O. In Heady, Baker, C.B., Diesslin, H.G., Kehrberg, E., and Staniforth, S., eds (Ed.), Agricultural supply functions. Ames, Iowa, Iowa State University Press. MARD. (2015). General regulations and development and by the end of 2020, vision 2030. MARD. (2017). Report on the results of the implementation of the plan in December 2016 in agriculture and rural development. MARD[Ministry of Agriculture and Rural Development]. Nerlove, M. (1958). The dynamics of supply; estimation of farmer's response to price (No. 04; HD1447, N4.) Nguyen, G. (2010). Supply Response, Price Transmission, and Risk in the US Catfish Industry. Tomek, W. G., & Robinson, K. L. (1981). Agricultural product prices. Utuk, I. O. (2014). Aggregate Agricultural Output Supply Response in Akwa Ibom State of Nigeria: An Application of the Nerlovian Adjustment Model. Journal of Agriculture and Veterinary Science, 7(9), 22-33. VASEP. (2015). Report on Vietnam seafood export in Quarter II / 2015, Quarter III / 2015. VASEP [Vietnam Association of Seafood Exporters and Producers] VASEP. (2016). Overview of Vietnam's seafood industry. VASEP[Vietnam Association of Seafood Exporters and Producers] VASEP. (2018). Vietnam seafood export report 2017. Retrieved from Vo, T. D. (2004). Supply response of rice in Vietnam. (Unpublished Ph.D. Thesis), University of the Philippines Los Baños, College, Laguna, Philippines. Vo, T. D. (2011). Supply Response Function of Sugarcan in the Mekong Delta. Can Tho University Journal of Science, 17b(2011), 43-52. © 2020 by the authors; licensee Growing Science, Canada. This is an open access article distributed under the terms and conditions of the Creative Commons Attribution (CC-BY) license (
File đính kèm:
 analysis_of_supply_response_of_black_tiger_shrimp_production.pdf

