The linkages between growth, poverty and inequality in Vietnam: An empirical analysis
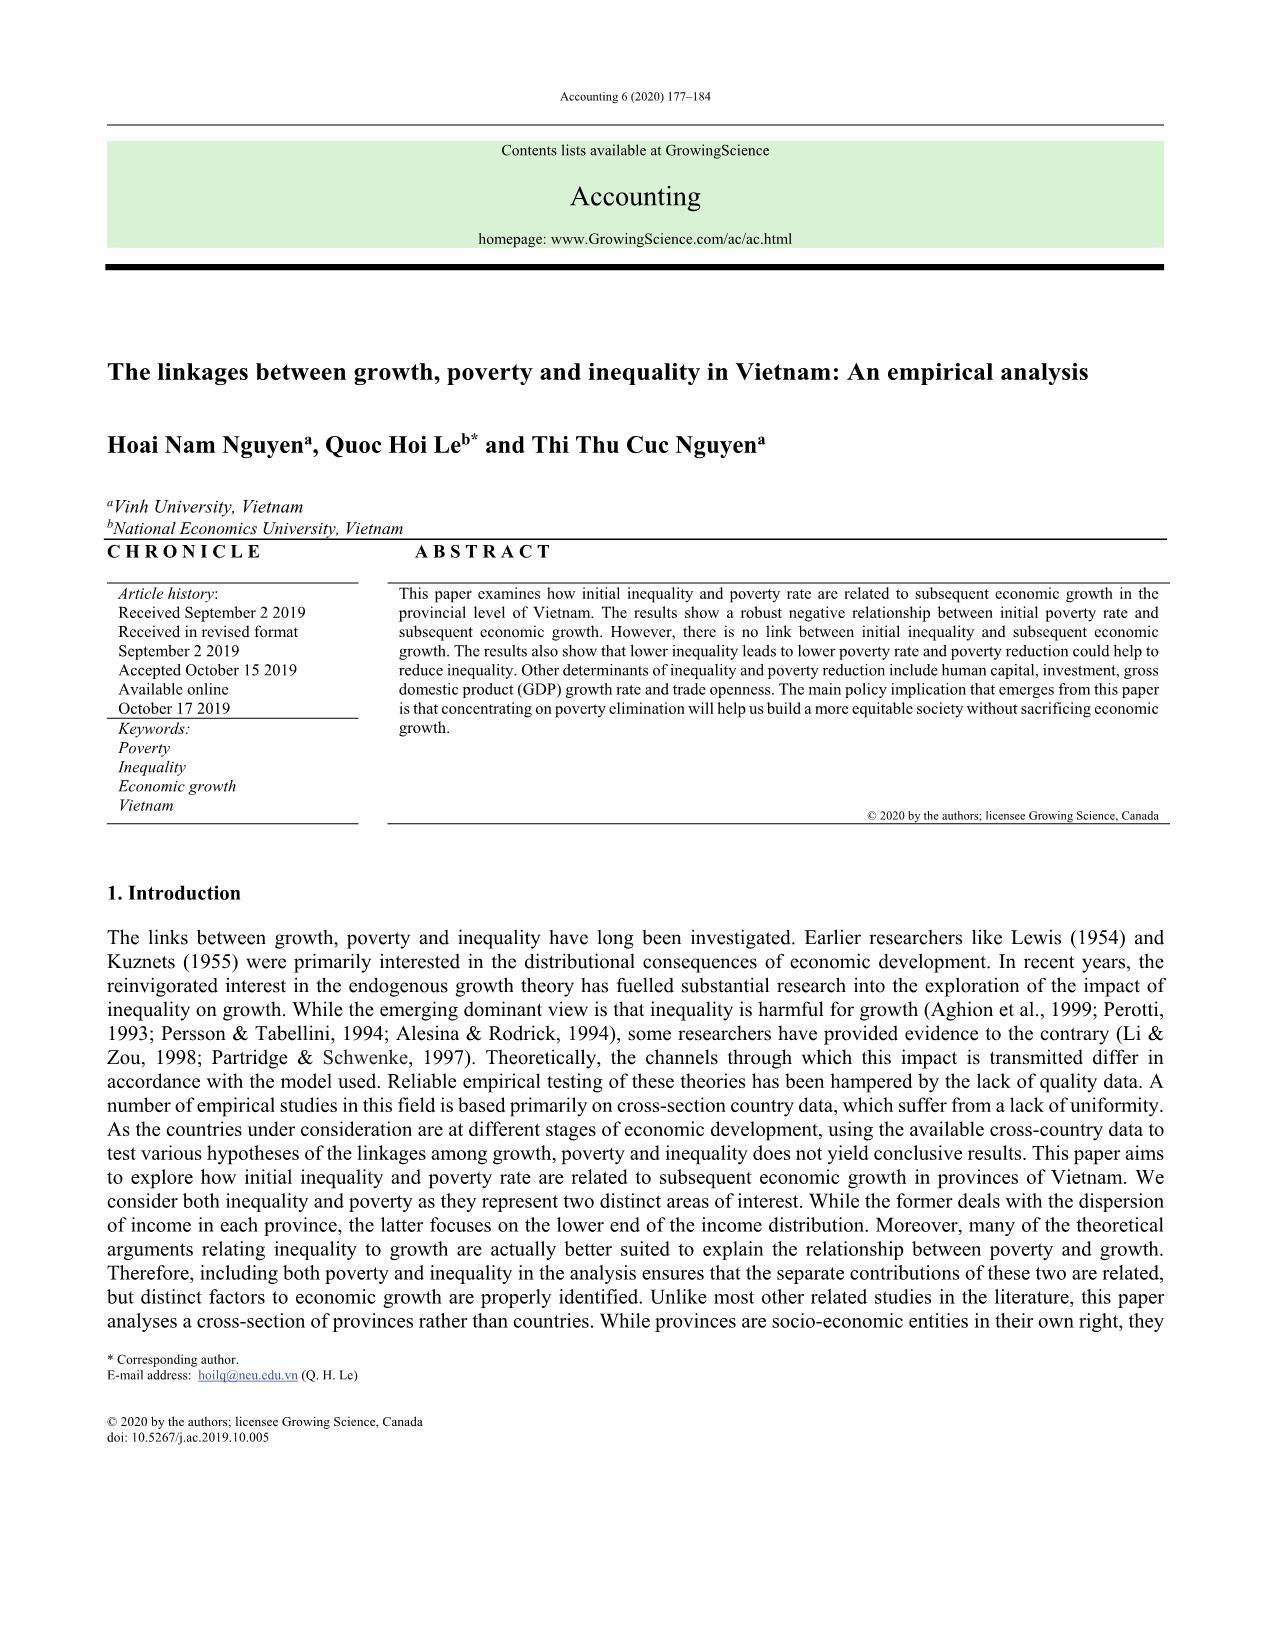
This paper examines how initial inequality and poverty rate are related to subsequent economic growth in the provincial level of Vietnam. The results show a robust negative relationship between initial poverty rate and subsequent economic growth. However, there is no link between initial inequality and subsequent economic growth. The results also show that lower inequality leads to lower poverty rate and poverty reduction could help to reduce inequality. Other determinants of inequality and poverty reduction include human capital, investment, gross domestic product (GDP) growth rate and trade openness. The main policy implication that emerges from this paper is that concentrating on poverty elimination will help us build a more equitable society without sacrificing economic growth
Trang 1
Trang 2
Trang 3
Trang 4
Trang 5
Trang 6
Trang 7
Trang 8
Tóm tắt nội dung tài liệu: The linkages between growth, poverty and inequality in Vietnam: An empirical analysis
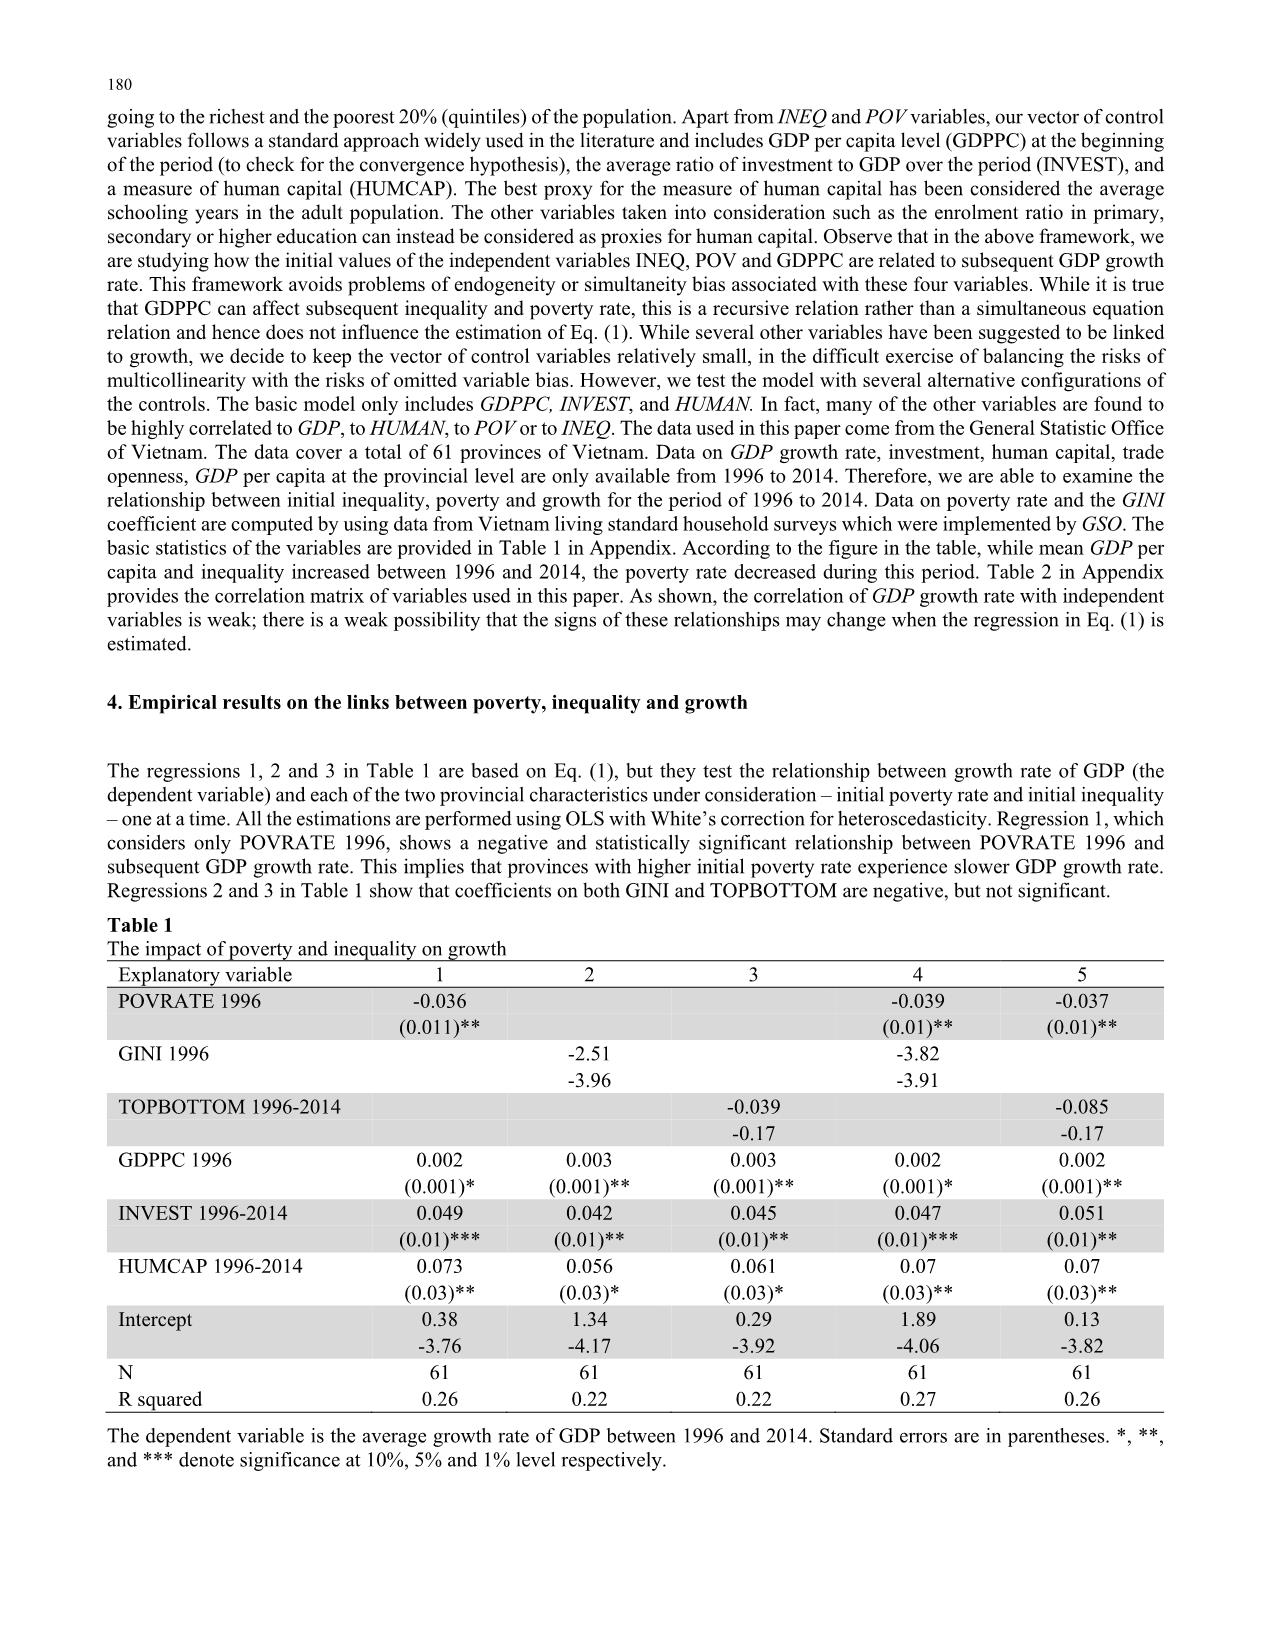
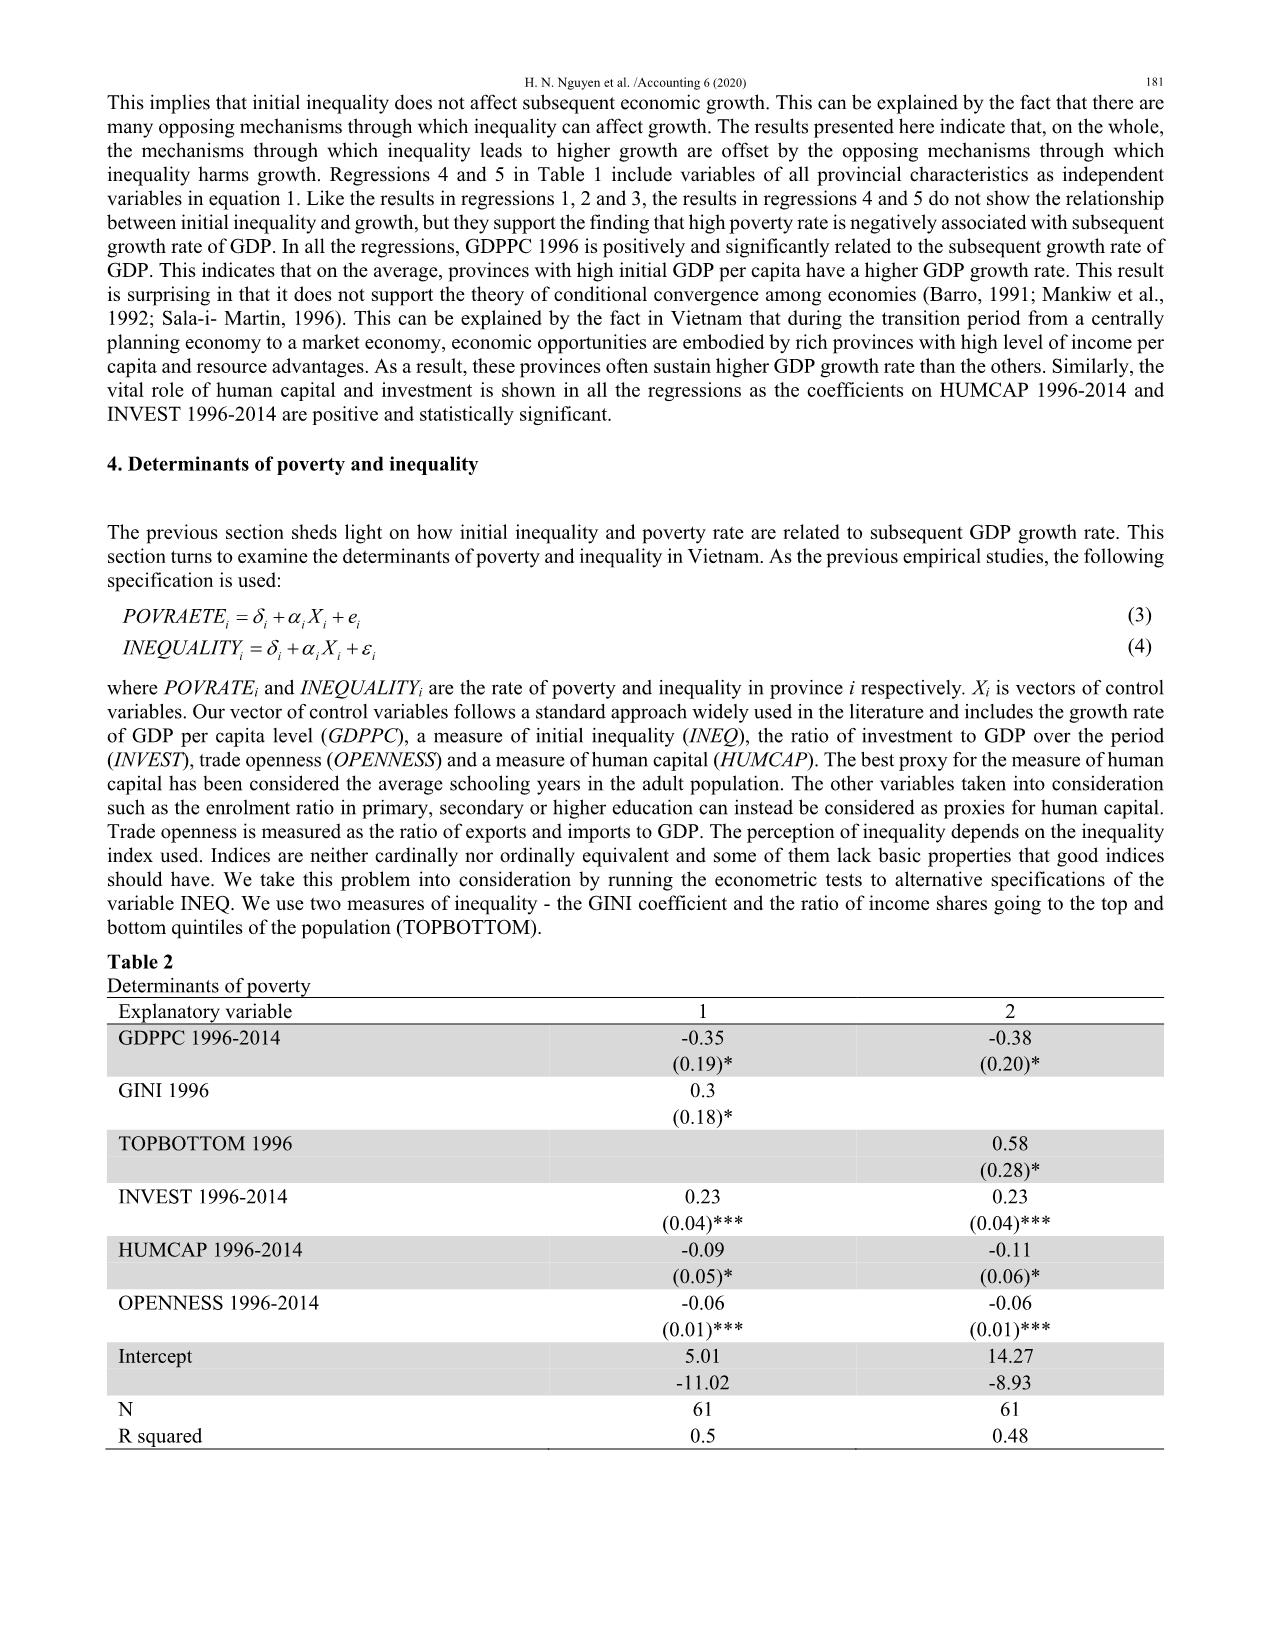
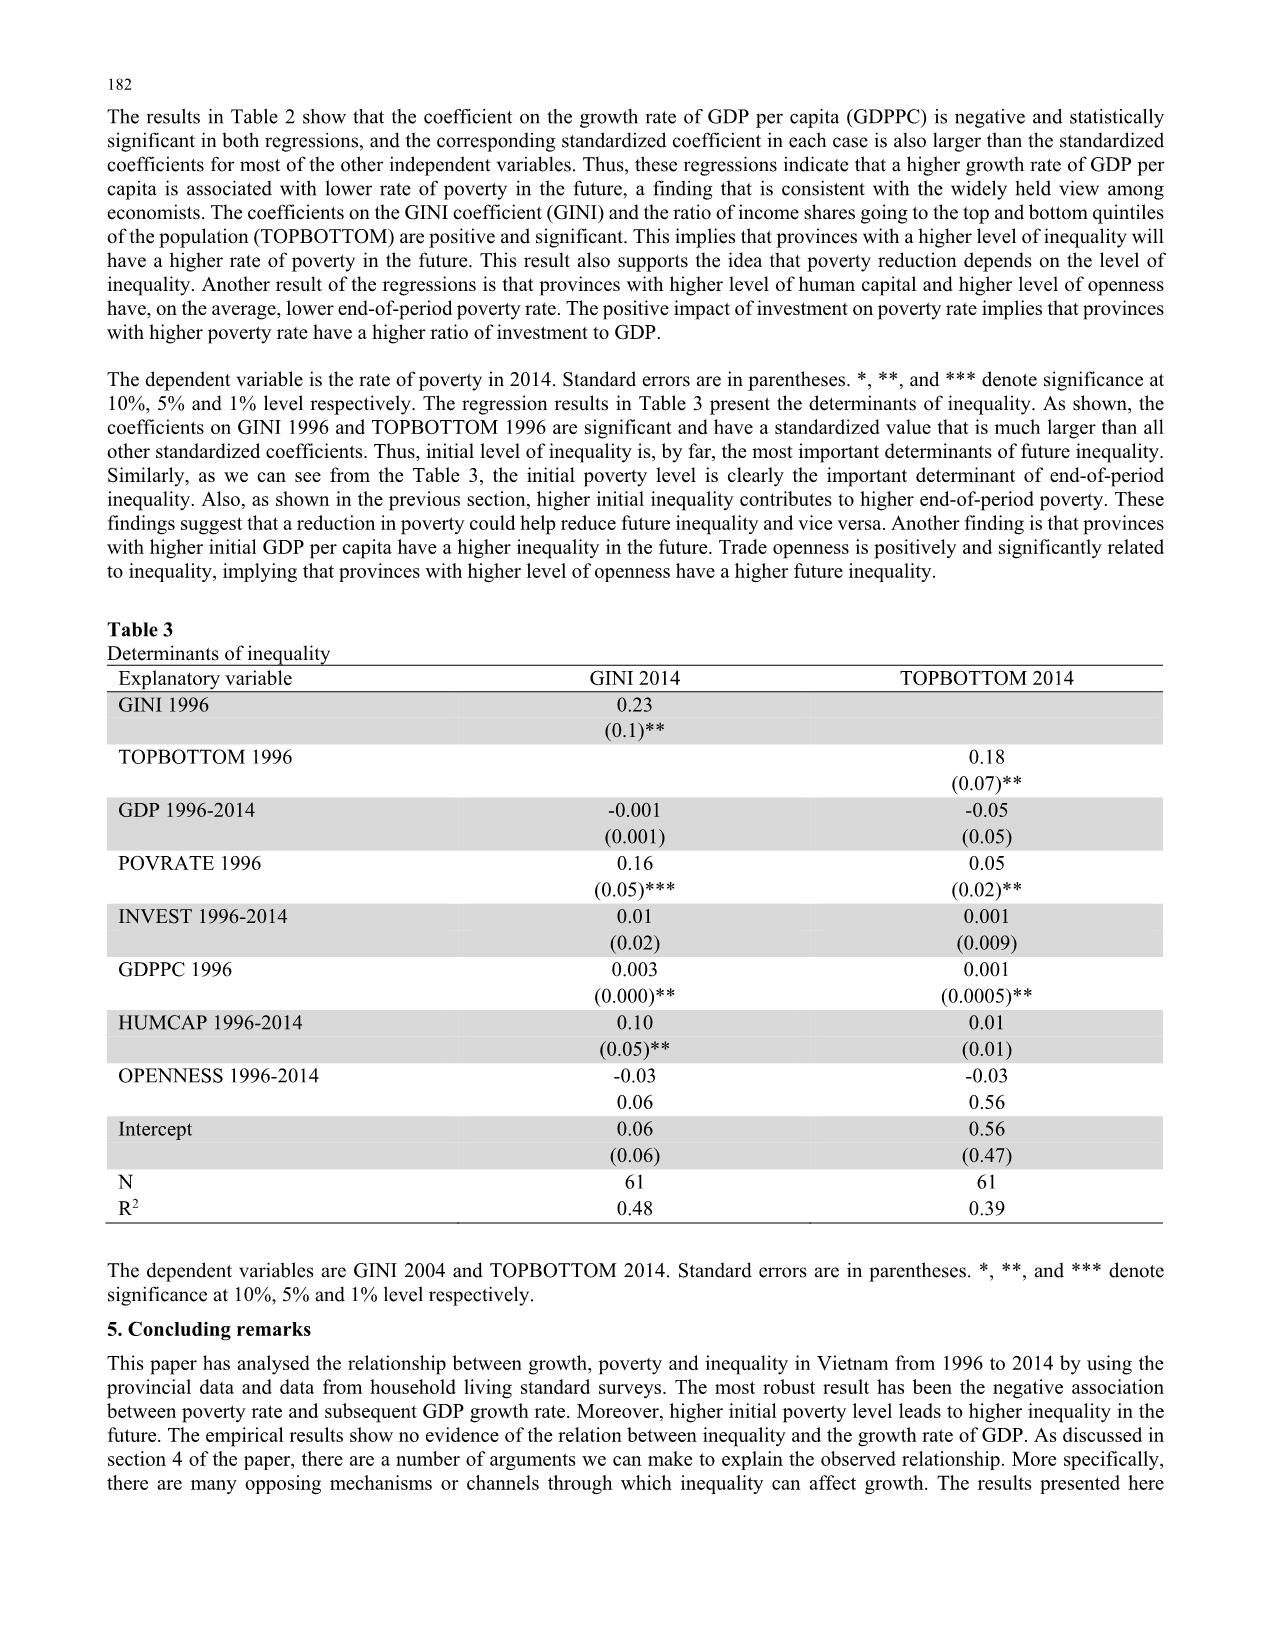
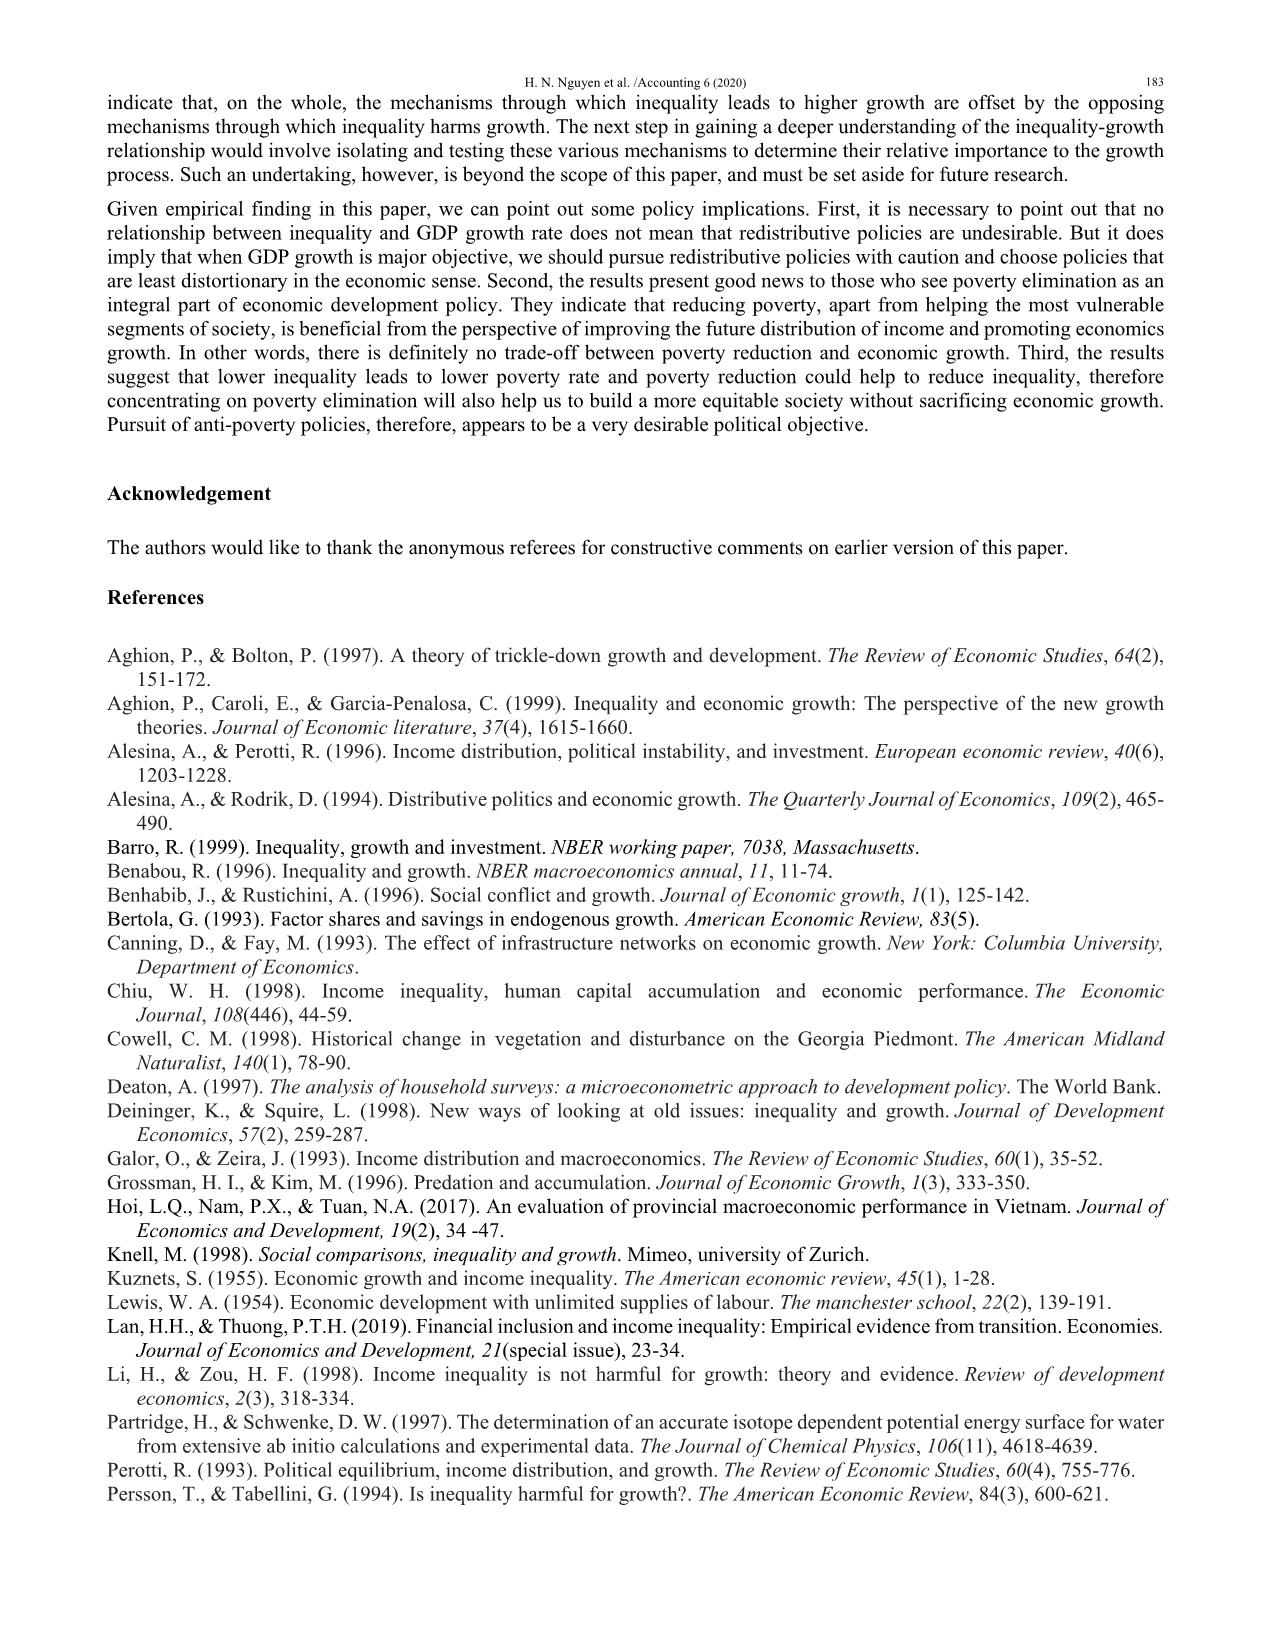
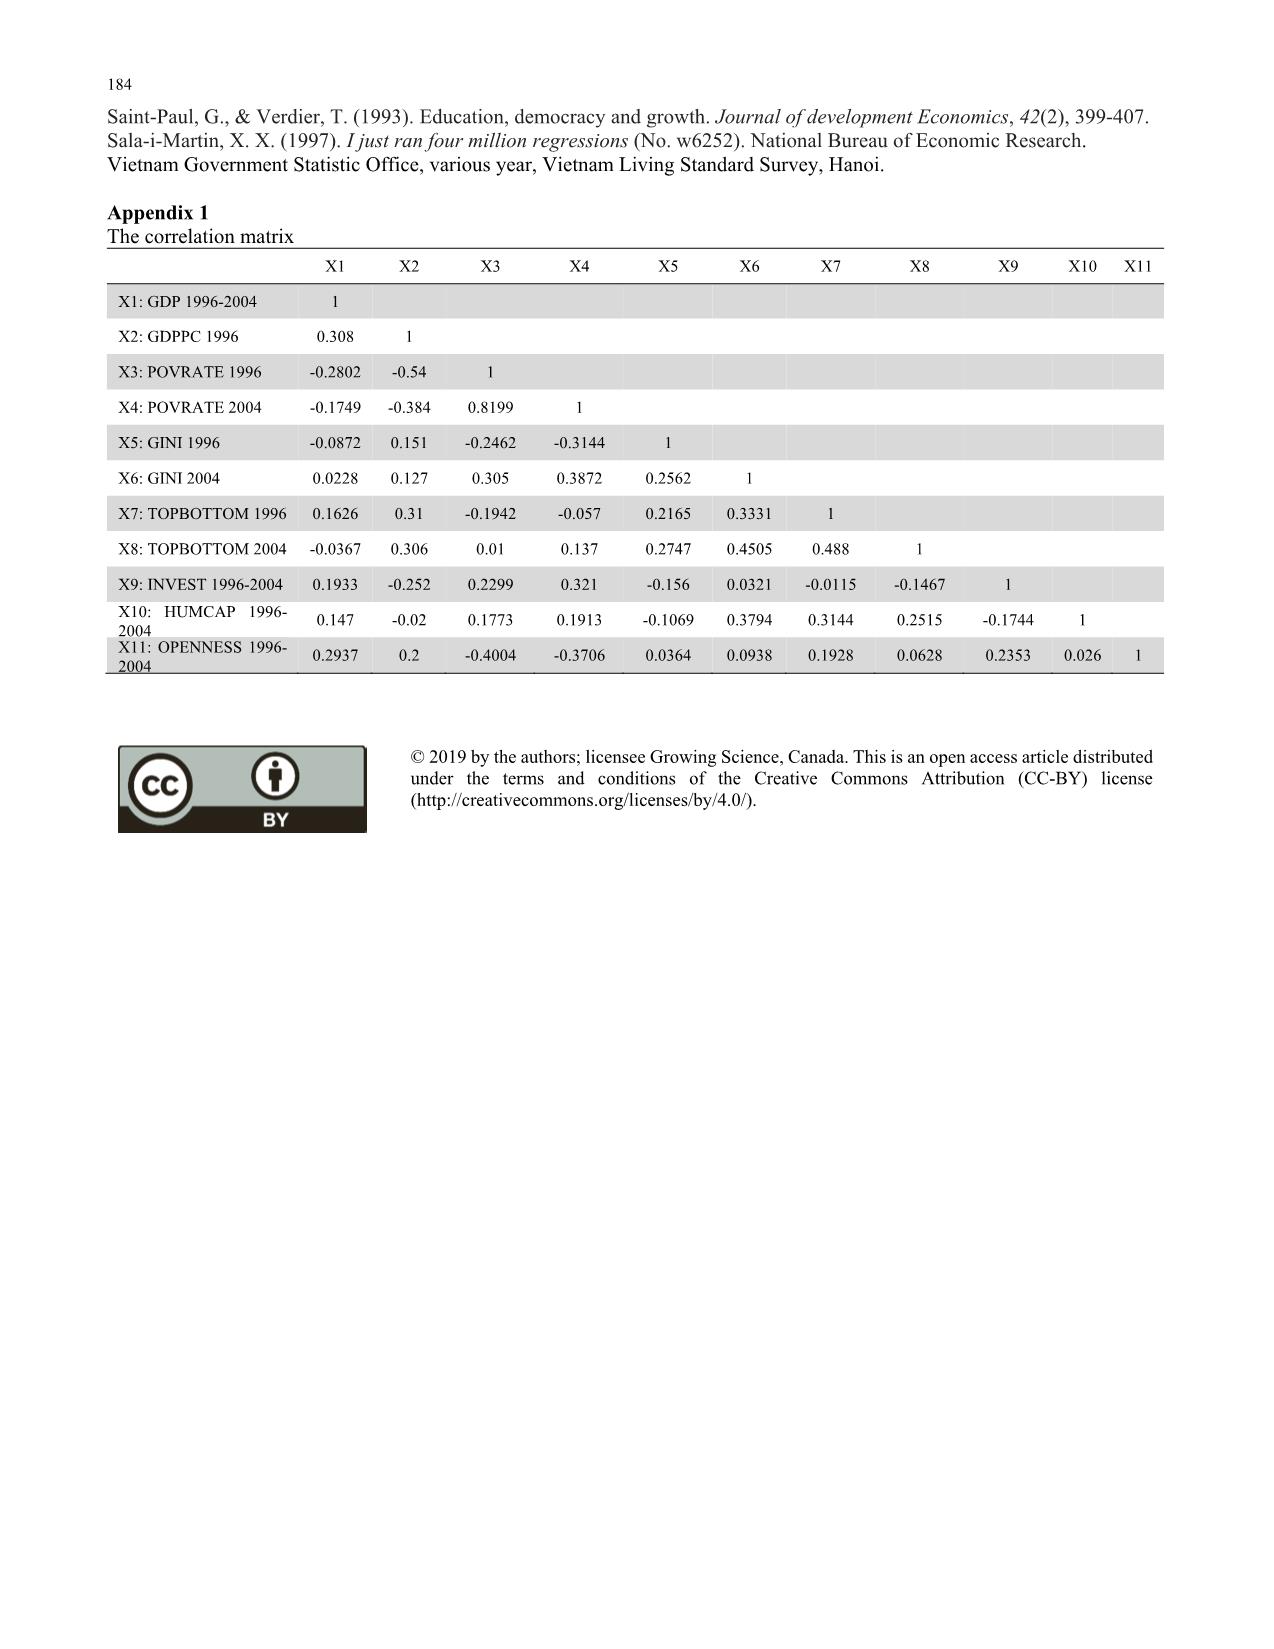
both GINI and TOPBOTTOM are negative, but not significant. Table 1 The impact of poverty and inequality on growth Explanatory variable 1 2 3 4 5 POVRATE 1996 -0.036 -0.039 -0.037 (0.011)** (0.01)** (0.01)** GINI 1996 -2.51 -3.82 -3.96 -3.91 TOPBOTTOM 1996-2014 -0.039 -0.085 -0.17 -0.17 GDPPC 1996 0.002 0.003 0.003 0.002 0.002 (0.001)* (0.001)** (0.001)** (0.001)* (0.001)** INVEST 1996-2014 0.049 0.042 0.045 0.047 0.051 (0.01)*** (0.01)** (0.01)** (0.01)*** (0.01)** HUMCAP 1996-2014 0.073 0.056 0.061 0.07 0.07 (0.03)** (0.03)* (0.03)* (0.03)** (0.03)** Intercept 0.38 1.34 0.29 1.89 0.13 -3.76 -4.17 -3.92 -4.06 -3.82 N 61 61 61 61 61 R squared 0.26 0.22 0.22 0.27 0.26 The dependent variable is the average growth rate of GDP between 1996 and 2014. Standard errors are in parentheses. *, **, and *** denote significance at 10%, 5% and 1% level respectively. H. N. Nguyen et al. /Accounting 6 (2020) 181 This implies that initial inequality does not affect subsequent economic growth. This can be explained by the fact that there are many opposing mechanisms through which inequality can affect growth. The results presented here indicate that, on the whole, the mechanisms through which inequality leads to higher growth are offset by the opposing mechanisms through which inequality harms growth. Regressions 4 and 5 in Table 1 include variables of all provincial characteristics as independent variables in equation 1. Like the results in regressions 1, 2 and 3, the results in regressions 4 and 5 do not show the relationship between initial inequality and growth, but they support the finding that high poverty rate is negatively associated with subsequent growth rate of GDP. In all the regressions, GDPPC 1996 is positively and significantly related to the subsequent growth rate of GDP. This indicates that on the average, provinces with high initial GDP per capita have a higher GDP growth rate. This result is surprising in that it does not support the theory of conditional convergence among economies (Barro, 1991; Mankiw et al., 1992; Sala-i- Martin, 1996). This can be explained by the fact in Vietnam that during the transition period from a centrally planning economy to a market economy, economic opportunities are embodied by rich provinces with high level of income per capita and resource advantages. As a result, these provinces often sustain higher GDP growth rate than the others. Similarly, the vital role of human capital and investment is shown in all the regressions as the coefficients on HUMCAP 1996-2014 and INVEST 1996-2014 are positive and statistically significant. 4. Determinants of poverty and inequality The previous section sheds light on how initial inequality and poverty rate are related to subsequent GDP growth rate. This section turns to examine the determinants of poverty and inequality in Vietnam. As the previous empirical studies, the following specification is used: i i i i iPOVRAETE X e (3) i i i i iINEQUALITY X (4) where POVRATEi and INEQUALITYi are the rate of poverty and inequality in province i respectively. Xi is vectors of control variables. Our vector of control variables follows a standard approach widely used in the literature and includes the growth rate of GDP per capita level (GDPPC), a measure of initial inequality (INEQ), the ratio of investment to GDP over the period (INVEST), trade openness (OPENNESS) and a measure of human capital (HUMCAP). The best proxy for the measure of human capital has been considered the average schooling years in the adult population. The other variables taken into consideration such as the enrolment ratio in primary, secondary or higher education can instead be considered as proxies for human capital. Trade openness is measured as the ratio of exports and imports to GDP. The perception of inequality depends on the inequality index used. Indices are neither cardinally nor ordinally equivalent and some of them lack basic properties that good indices should have. We take this problem into consideration by running the econometric tests to alternative specifications of the variable INEQ. We use two measures of inequality - the GINI coefficient and the ratio of income shares going to the top and bottom quintiles of the population (TOPBOTTOM). Table 2 Determinants of poverty Explanatory variable 1 2 GDPPC 1996-2014 -0.35 -0.38 (0.19)* (0.20)* GINI 1996 0.3 (0.18)* TOPBOTTOM 1996 0.58 (0.28)* INVEST 1996-2014 0.23 0.23 (0.04)*** (0.04)*** HUMCAP 1996-2014 -0.09 -0.11 (0.05)* (0.06)* OPENNESS 1996-2014 -0.06 -0.06 (0.01)*** (0.01)*** Intercept 5.01 14.27 -11.02 -8.93 N 61 61 R squared 0.5 0.48 182 The results in Table 2 show that the coefficient on the growth rate of GDP per capita (GDPPC) is negative and statistically significant in both regressions, and the corresponding standardized coefficient in each case is also larger than the standardized coefficients for most of the other independent variables. Thus, these regressions indicate that a higher growth rate of GDP per capita is associated with lower rate of poverty in the future, a finding that is consistent with the widely held view among economists. The coefficients on the GINI coefficient (GINI) and the ratio of income shares going to the top and bottom quintiles of the population (TOPBOTTOM) are positive and significant. This implies that provinces with a higher level of inequality will have a higher rate of poverty in the future. This result also supports the idea that poverty reduction depends on the level of inequality. Another result of the regressions is that provinces with higher level of human capital and higher level of openness have, on the average, lower end-of-period poverty rate. The positive impact of investment on poverty rate implies that provinces with higher poverty rate have a higher ratio of investment to GDP. The dependent variable is the rate of poverty in 2014. Standard errors are in parentheses. *, **, and *** denote significance at 10%, 5% and 1% level respectively. The regression results in Table 3 present the determinants of inequality. As shown, the coefficients on GINI 1996 and TOPBOTTOM 1996 are significant and have a standardized value that is much larger than all other standardized coefficients. Thus, initial level of inequality is, by far, the most important determinants of future inequality. Similarly, as we can see from the Table 3, the initial poverty level is clearly the important determinant of end-of-period inequality. Also, as shown in the previous section, higher initial inequality contributes to higher end-of-period poverty. These findings suggest that a reduction in poverty could help reduce future inequality and vice versa. Another finding is that provinces with higher initial GDP per capita have a higher inequality in the future. Trade openness is positively and significantly related to inequality, implying that provinces with higher level of openness have a higher future inequality. Table 3 Determinants of inequality Explanatory variable GINI 2014 TOPBOTTOM 2014 GINI 1996 0.23 (0.1)** TOPBOTTOM 1996 0.18 (0.07)** GDP 1996-2014 -0.001 -0.05 (0.001) (0.05) POVRATE 1996 0.16 0.05 (0.05)*** (0.02)** INVEST 1996-2014 0.01 0.001 (0.02) (0.009) GDPPC 1996 0.003 0.001 (0.000)** (0.0005)** HUMCAP 1996-2014 0.10 0.01 (0.05)** (0.01) OPENNESS 1996-2014 -0.03 -0.03 0.06 0.56 Intercept 0.06 0.56 (0.06) (0.47) N 61 61 R2 0.48 0.39 The dependent variables are GINI 2004 and TOPBOTTOM 2014. Standard errors are in parentheses. *, **, and *** denote significance at 10%, 5% and 1% level respectively. 5. Concluding remarks This paper has analysed the relationship between growth, poverty and inequality in Vietnam from 1996 to 2014 by using the provincial data and data from household living standard surveys. The most robust result has been the negative association between poverty rate and subsequent GDP growth rate. Moreover, higher initial poverty level leads to higher inequality in the future. The empirical results show no evidence of the relation between inequality and the growth rate of GDP. As discussed in section 4 of the paper, there are a number of arguments we can make to explain the observed relationship. More specifically, there are many opposing mechanisms or channels through which inequality can affect growth. The results presented here H. N. Nguyen et al. /Accounting 6 (2020) 183 indicate that, on the whole, the mechanisms through which inequality leads to higher growth are offset by the opposing mechanisms through which inequality harms growth. The next step in gaining a deeper understanding of the inequality-growth relationship would involve isolating and testing these various mechanisms to determine their relative importance to the growth process. Such an undertaking, however, is beyond the scope of this paper, and must be set aside for future research. Given empirical finding in this paper, we can point out some policy implications. First, it is necessary to point out that no relationship between inequality and GDP growth rate does not mean that redistributive policies are undesirable. But it does imply that when GDP growth is major objective, we should pursue redistributive policies with caution and choose policies that are least distortionary in the economic sense. Second, the results present good news to those who see poverty elimination as an integral part of economic development policy. They indicate that reducing poverty, apart from helping the most vulnerable segments of society, is beneficial from the perspective of improving the future distribution of income and promoting economics growth. In other words, there is definitely no trade-off between poverty reduction and economic growth. Third, the results suggest that lower inequality leads to lower poverty rate and poverty reduction could help to reduce inequality, therefore concentrating on poverty elimination will also help us to build a more equitable society without sacrificing economic growth. Pursuit of anti-poverty policies, therefore, appears to be a very desirable political objective. Acknowledgement The authors would like to thank the anonymous referees for constructive comments on earlier version of this paper. References Aghion, P., & Bolton, P. (1997). A theory of trickle-down growth and development. The Review of Economic Studies, 64(2), 151-172. Aghion, P., Caroli, E., & Garcia-Penalosa, C. (1999). Inequality and economic growth: The perspective of the new growth theories. Journal of Economic literature, 37(4), 1615-1660. Alesina, A., & Perotti, R. (1996). Income distribution, political instability, and investment. European economic review, 40(6), 1203-1228. Alesina, A., & Rodrik, D. (1994). Distributive politics and economic growth. The Quarterly Journal of Economics, 109(2), 465- 490. Barro, R. (1999). Inequality, growth and investment. NBER working paper, 7038, Massachusetts. Benabou, R. (1996). Inequality and growth. NBER macroeconomics annual, 11, 11-74. Benhabib, J., & Rustichini, A. (1996). Social conflict and growth. Journal of Economic growth, 1(1), 125-142. Bertola, G. (1993). Factor shares and savings in endogenous growth. American Economic Review, 83(5). Canning, D., & Fay, M. (1993). The effect of infrastructure networks on economic growth. New York: Columbia University, Department of Economics. Chiu, W. H. (1998). Income inequality, human capital accumulation and economic performance. The Economic Journal, 108(446), 44-59. Cowell, C. M. (1998). Historical change in vegetation and disturbance on the Georgia Piedmont. The American Midland Naturalist, 140(1), 78-90. Deaton, A. (1997). The analysis of household surveys: a microeconometric approach to development policy. The World Bank. Deininger, K., & Squire, L. (1998). New ways of looking at old issues: inequality and growth. Journal of Development Economics, 57(2), 259-287. Galor, O., & Zeira, J. (1993). Income distribution and macroeconomics. The Review of Economic Studies, 60(1), 35-52. Grossman, H. I., & Kim, M. (1996). Predation and accumulation. Journal of Economic Growth, 1(3), 333-350. Hoi, L.Q., Nam, P.X., & Tuan, N.A. (2017). An evaluation of provincial macroeconomic performance in Vietnam. Journal of Economics and Development, 19(2), 34 -47. Knell, M. (1998). Social comparisons, inequality and growth. Mimeo, university of Zurich. Kuznets, S. (1955). Economic growth and income inequality. The American economic review, 45(1), 1-28. Lewis, W. A. (1954). Economic development with unlimited supplies of labour. The manchester school, 22(2), 139-191. Lan, H.H., & Thuong, P.T.H. (2019). Financial inclusion and income inequality: Empirical evidence from transition. Economies. Journal of Economics and Development, 21(special issue), 23-34. Li, H., & Zou, H. F. (1998). Income inequality is not harmful for growth: theory and evidence. Review of development economics, 2(3), 318-334. Partridge, H., & Schwenke, D. W. (1997). The determination of an accurate isotope dependent potential energy surface for water from extensive ab initio calculations and experimental data. The Journal of Chemical Physics, 106(11), 4618-4639. Perotti, R. (1993). Political equilibrium, income distribution, and growth. The Review of Economic Studies, 60(4), 755-776. Persson, T., & Tabellini, G. (1994). Is inequality harmful for growth?. The American Economic Review, 84(3), 600-621. 184 Saint-Paul, G., & Verdier, T. (1993). Education, democracy and growth. Journal of development Economics, 42(2), 399-407. Sala-i-Martin, X. X. (1997). I just ran four million regressions (No. w6252). National Bureau of Economic Research. Vietnam Government Statistic Office, various year, Vietnam Living Standard Survey, Hanoi. Appendix 1 The correlation matrix X1 X2 X3 X4 X5 X6 X7 X8 X9 X10 X11 X1: GDP 1996-2004 1 X2: GDPPC 1996 0.308 1 X3: POVRATE 1996 -0.2802 -0.54 1 X4: POVRATE 2004 -0.1749 -0.384 0.8199 1 X5: GINI 1996 -0.0872 0.151 -0.2462 -0.3144 1 X6: GINI 2004 0.0228 0.127 0.305 0.3872 0.2562 1 X7: TOPBOTTOM 1996 0.1626 0.31 -0.1942 -0.057 0.2165 0.3331 1 X8: TOPBOTTOM 2004 -0.0367 0.306 0.01 0.137 0.2747 0.4505 0.488 1 X9: INVEST 1996-2004 0.1933 -0.252 0.2299 0.321 -0.156 0.0321 -0.0115 -0.1467 1 X10: HUMCAP 1996- 2004 0.147 -0.02 0.1773 0.1913 -0.1069 0.3794 0.3144 0.2515 -0.1744 1 X11: OPENNESS 1996- 2004 0.2937 0.2 -0.4004 -0.3706 0.0364 0.0938 0.1928 0.0628 0.2353 0.026 1 © 2019 by the authors; licensee Growing Science, Canada. This is an open access article distributed under the terms and conditions of the Creative Commons Attribution (CC-BY) license (
File đính kèm:
 the_linkages_between_growth_poverty_and_inequality_in_vietna.pdf

