The impact of capital structure on the performance of construction companies: A study from Vietnam stock exchanges
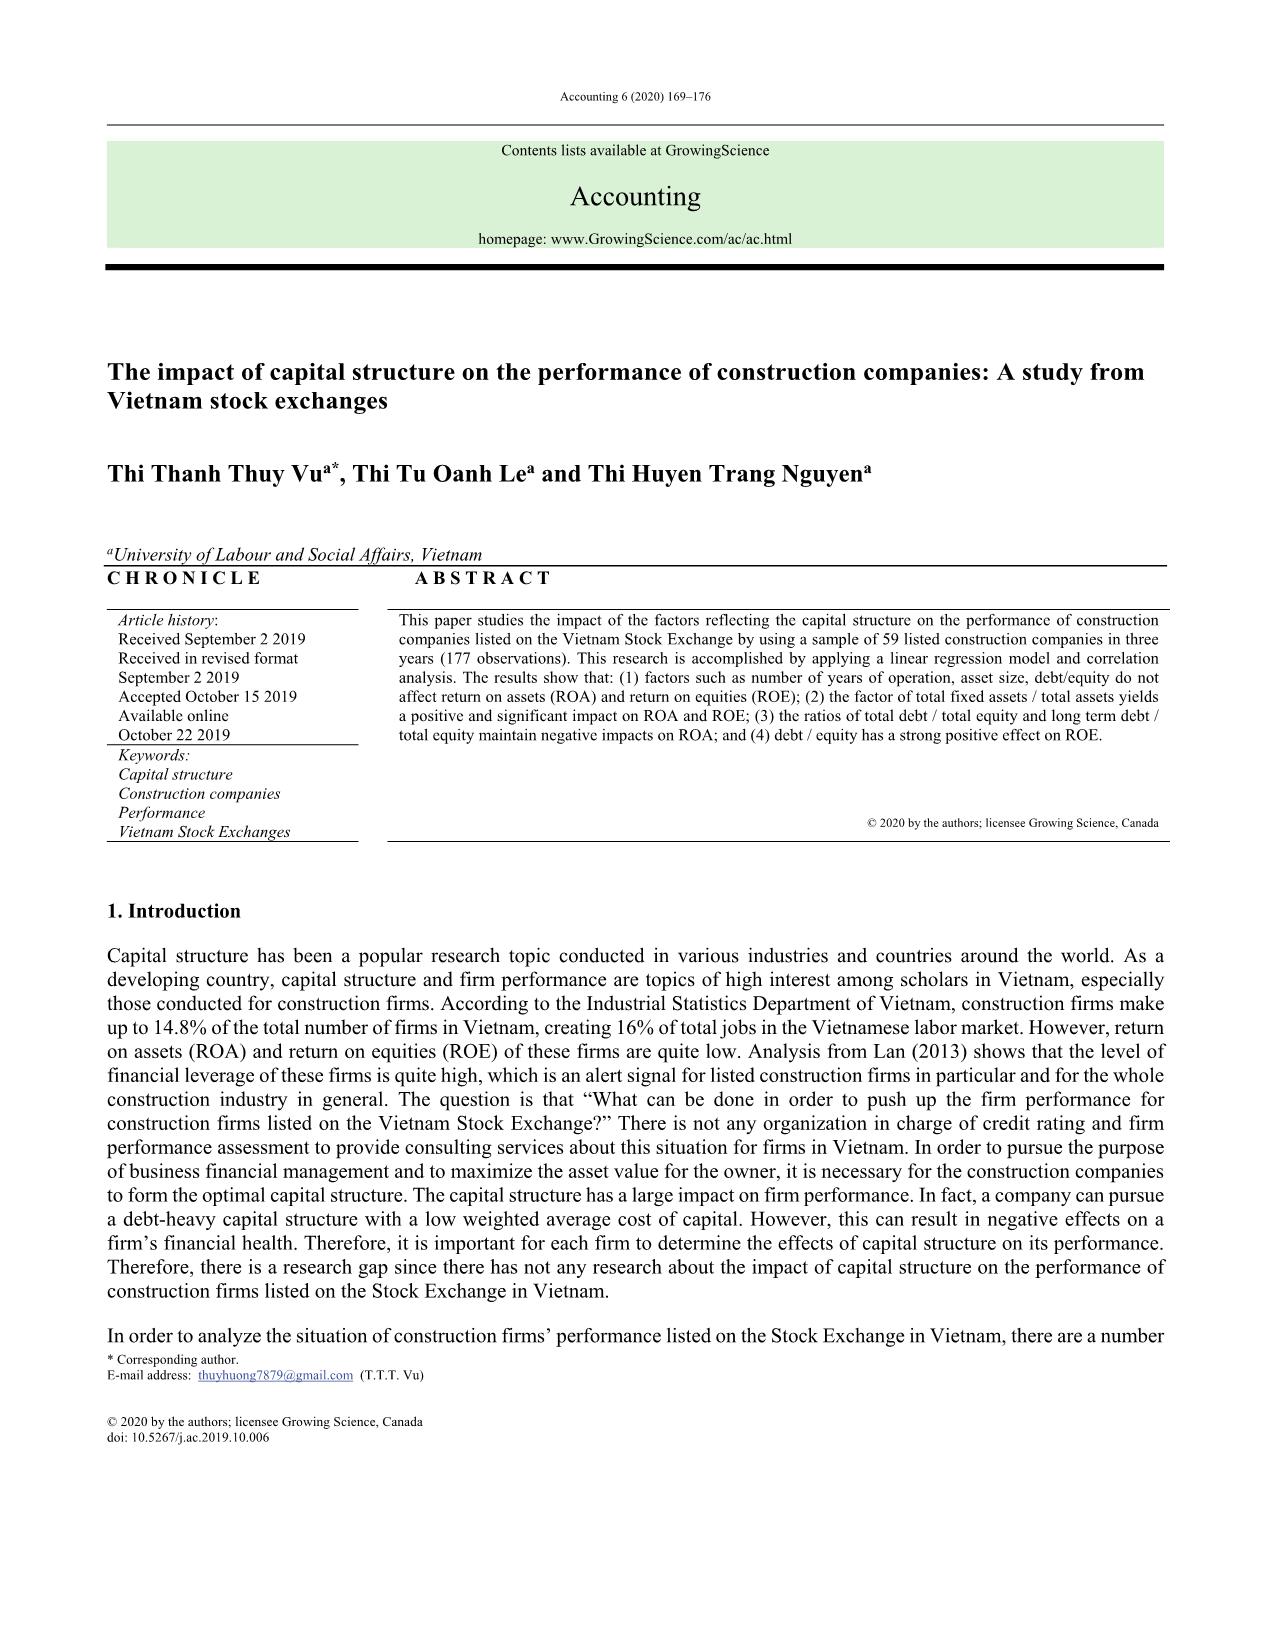
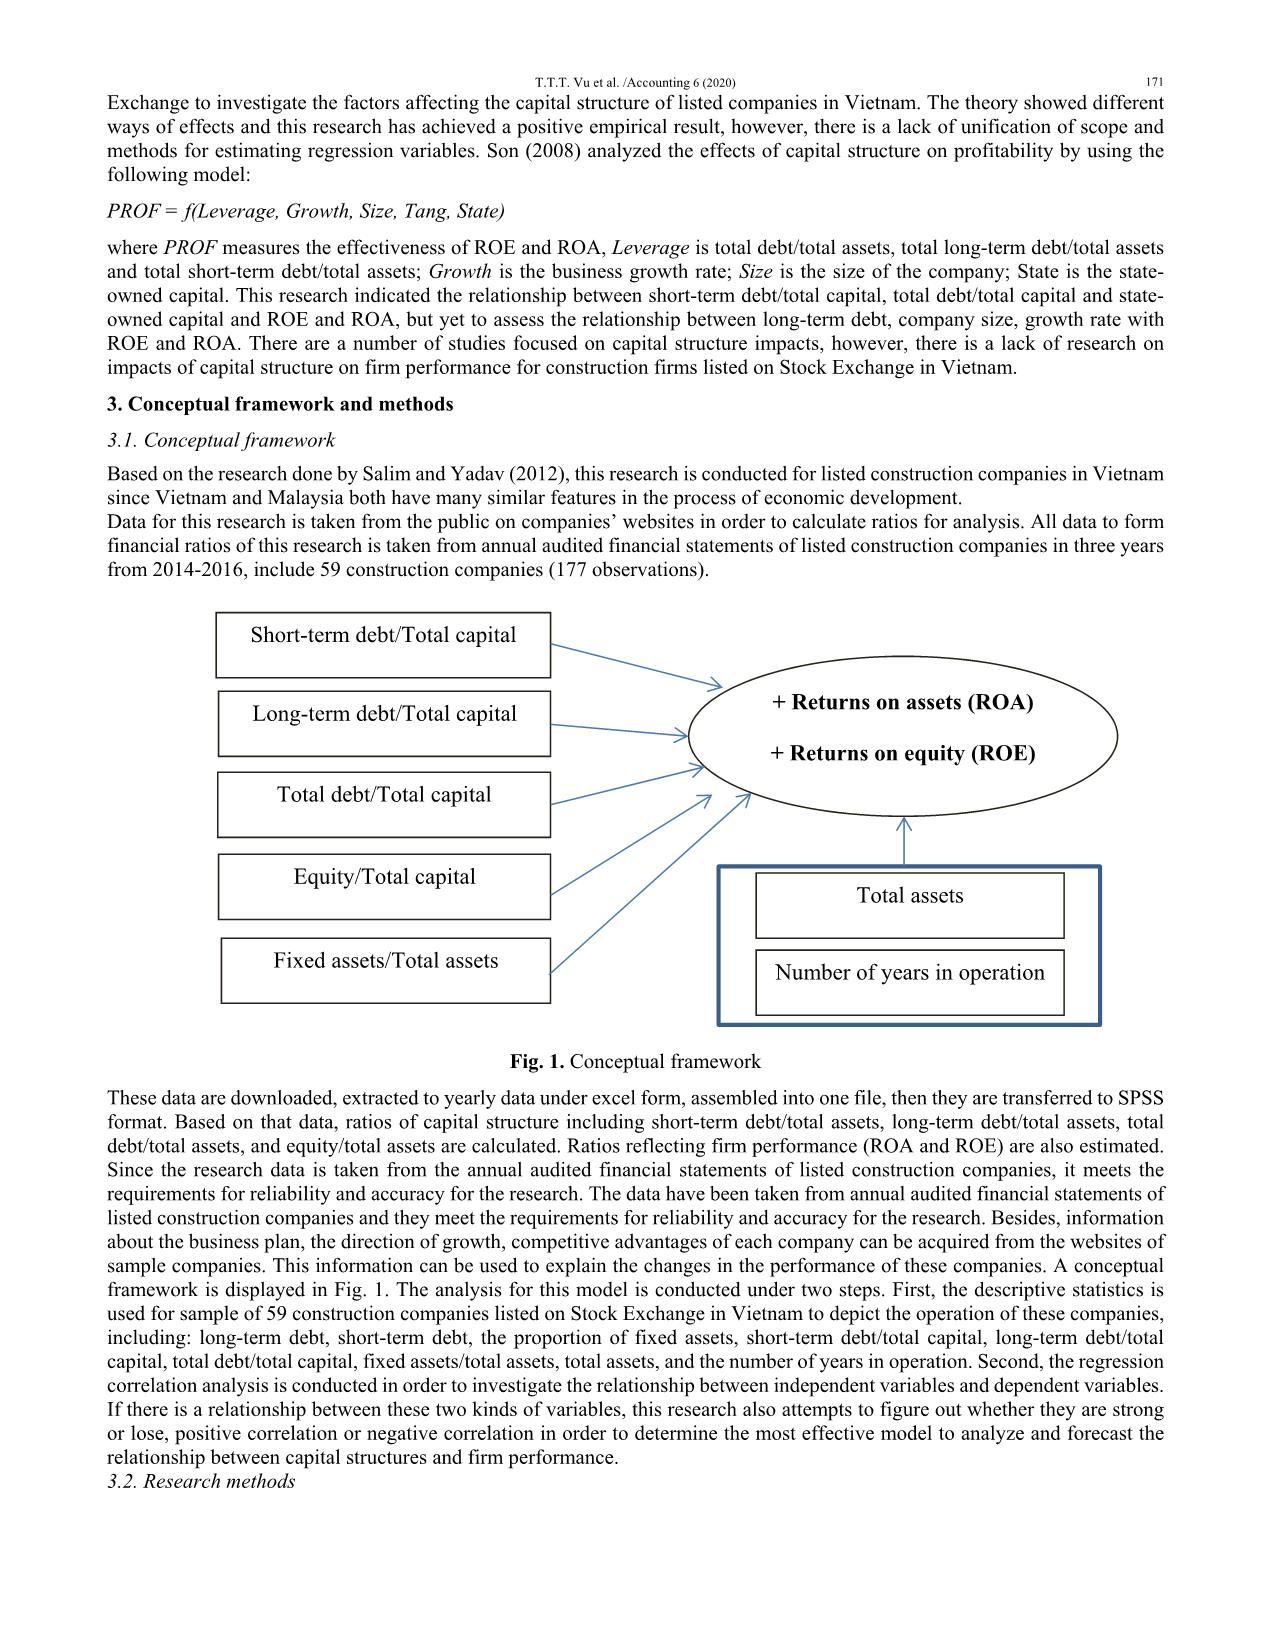
This paper studies the impact of the factors reflecting the capital structure on the performance of construction companies listed on the Vietnam Stock Exchange by using a sample of 59 listed construction companies in three years (177 observations). This research is accomplished by applying a linear regression model and correlation analysis. The results show that: (1) factors such as number of years of operation, asset size, debt/equity do not affect return on assets (ROA) and return on equities (ROE); (2) the factor of total fixed assets / total assets yields a positive and significant impact on ROA and ROE; (3) the ratios of total debt / total equity and long term debt / total equity maintain negative impacts on ROA; and (4) debt / equity has a strong positive effect on ROE
Trang 1
Trang 2
Trang 3
Trang 4
Trang 5
Trang 6
Trang 7
Trang 8
Tóm tắt nội dung tài liệu: The impact of capital structure on the performance of construction companies: A study from Vietnam stock exchanges
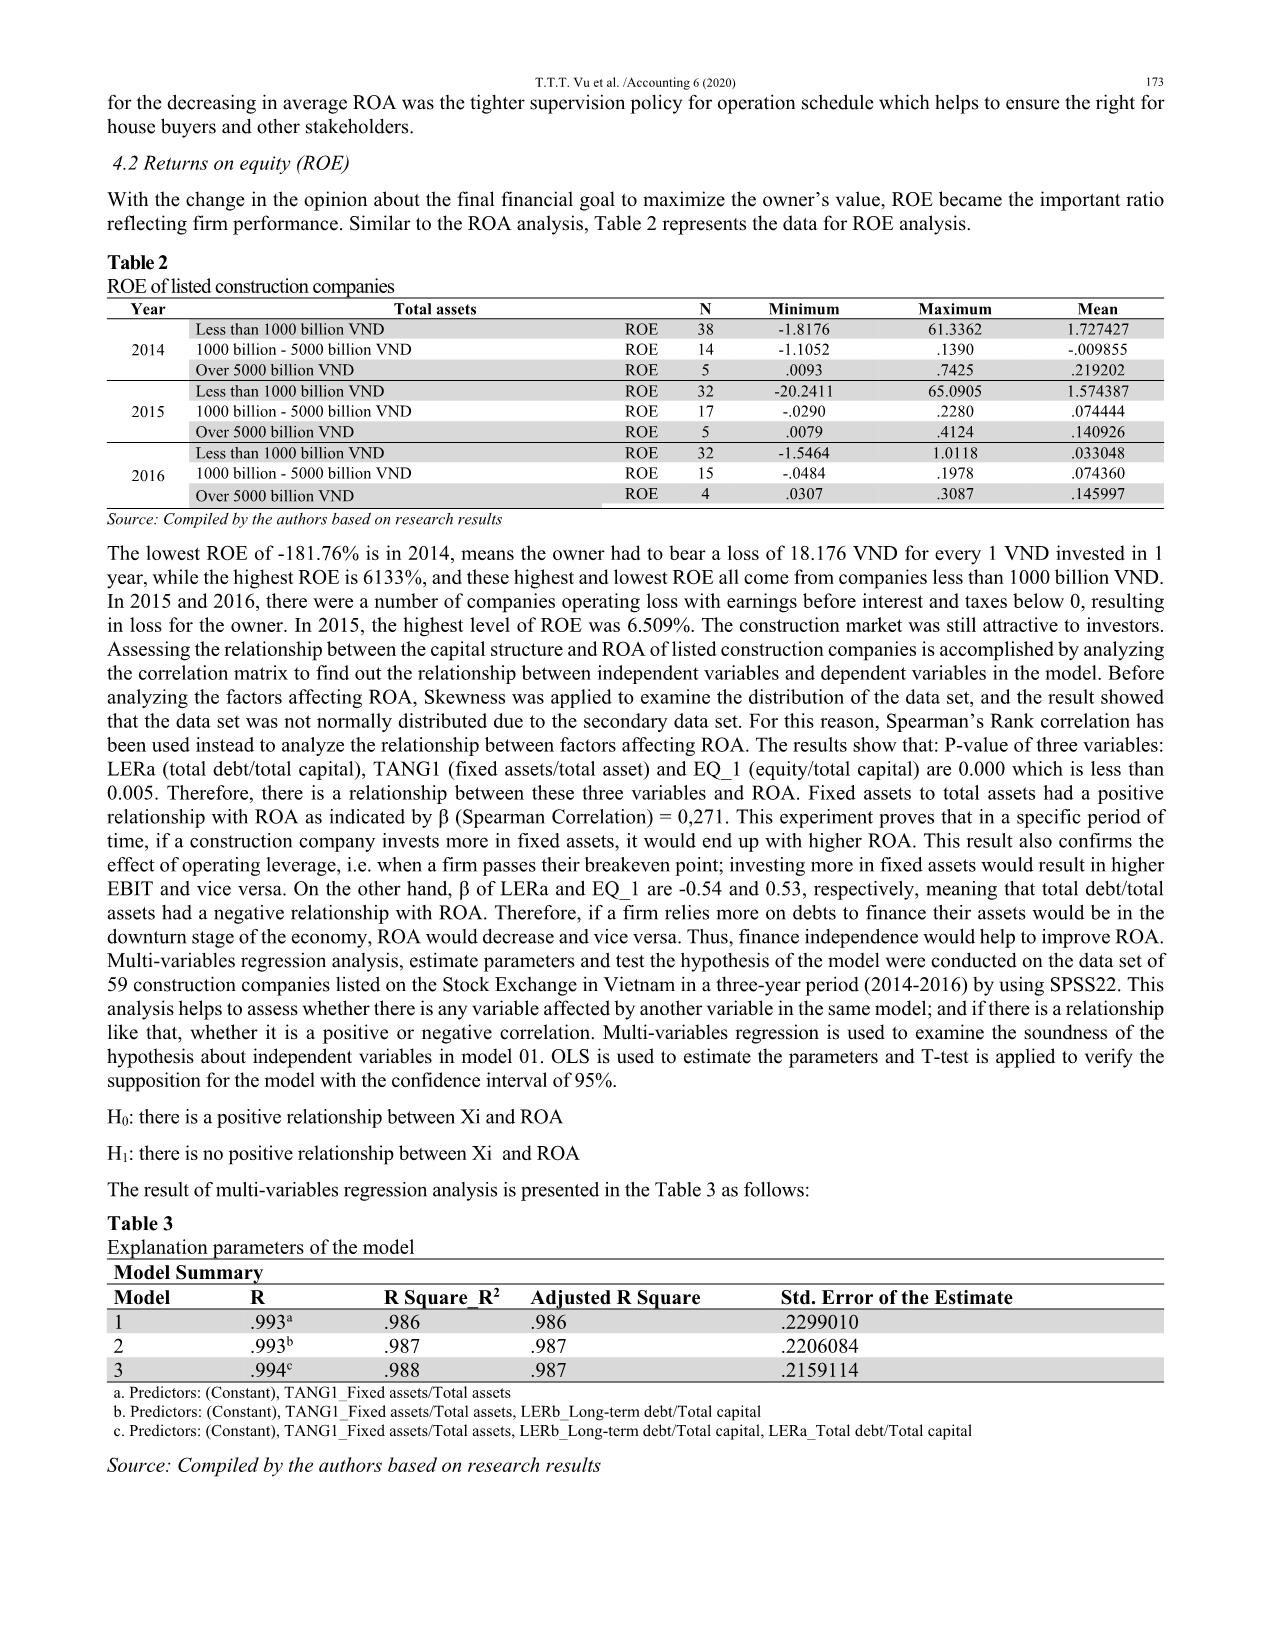
o examine the distribution of the data set, and the result showed
that the data set was not normally distributed due to the secondary data set. For this reason, Spearman’s Rank correlation has
been used instead to analyze the relationship between factors affecting ROA. The results show that: P-value of three variables:
LERa (total debt/total capital), TANG1 (fixed assets/total asset) and EQ_1 (equity/total capital) are 0.000 which is less than
0.005. Therefore, there is a relationship between these three variables and ROA. Fixed assets to total assets had a positive
relationship with ROA as indicated by β (Spearman Correlation) = 0,271. This experiment proves that in a specific period of
time, if a construction company invests more in fixed assets, it would end up with higher ROA. This result also confirms the
effect of operating leverage, i.e. when a firm passes their breakeven point; investing more in fixed assets would result in higher
EBIT and vice versa. On the other hand, β of LERa and EQ_1 are -0.54 and 0.53, respectively, meaning that total debt/total
assets had a negative relationship with ROA. Therefore, if a firm relies more on debts to finance their assets would be in the
downturn stage of the economy, ROA would decrease and vice versa. Thus, finance independence would help to improve ROA.
Multi-variables regression analysis, estimate parameters and test the hypothesis of the model were conducted on the data set of
59 construction companies listed on the Stock Exchange in Vietnam in a three-year period (2014-2016) by using SPSS22. This
analysis helps to assess whether there is any variable affected by another variable in the same model; and if there is a relationship
like that, whether it is a positive or negative correlation. Multi-variables regression is used to examine the soundness of the
hypothesis about independent variables in model 01. OLS is used to estimate the parameters and T-test is applied to verify the
supposition for the model with the confidence interval of 95%.
H0: there is a positive relationship between Xi and ROA
H1: there is no positive relationship between Xi and ROA
The result of multi-variables regression analysis is presented in the Table 3 as follows:
Table 3
Explanation parameters of the model
Model Summary
Model R R Square_R2 Adjusted R Square Std. Error of the Estimate
1 .993a .986 .986 .2299010
2 .993b .987 .987 .2206084
3 .994c .988 .987 .2159114
a. Predictors: (Constant), TANG1_Fixed assets/Total assets
b. Predictors: (Constant), TANG1_Fixed assets/Total assets, LERb_Long-term debt/Total capital
c. Predictors: (Constant), TANG1_Fixed assets/Total assets, LERb_Long-term debt/Total capital, LERa_Total debt/Total capital
Source: Compiled by the authors based on research results
 174
Correlation coefficient R of 0.993 in the model (1) shows the close relationship between fixed assets/total assets and ROA. R2 of
0.986 indicates that fixed assets/total assets can explain for 98.6% the change of ROA. After adding LERa_ total debt/total capital and
LERb_long-term debt/total capital (model 3), adjudged R2 is 0.987. This means that when three variables are added into the
model, it can explain for 98.7% the change of ROA (0.001% increase compared with the model (1)). In other words, 98.7% the
change of ROA can be explained by independent variables.
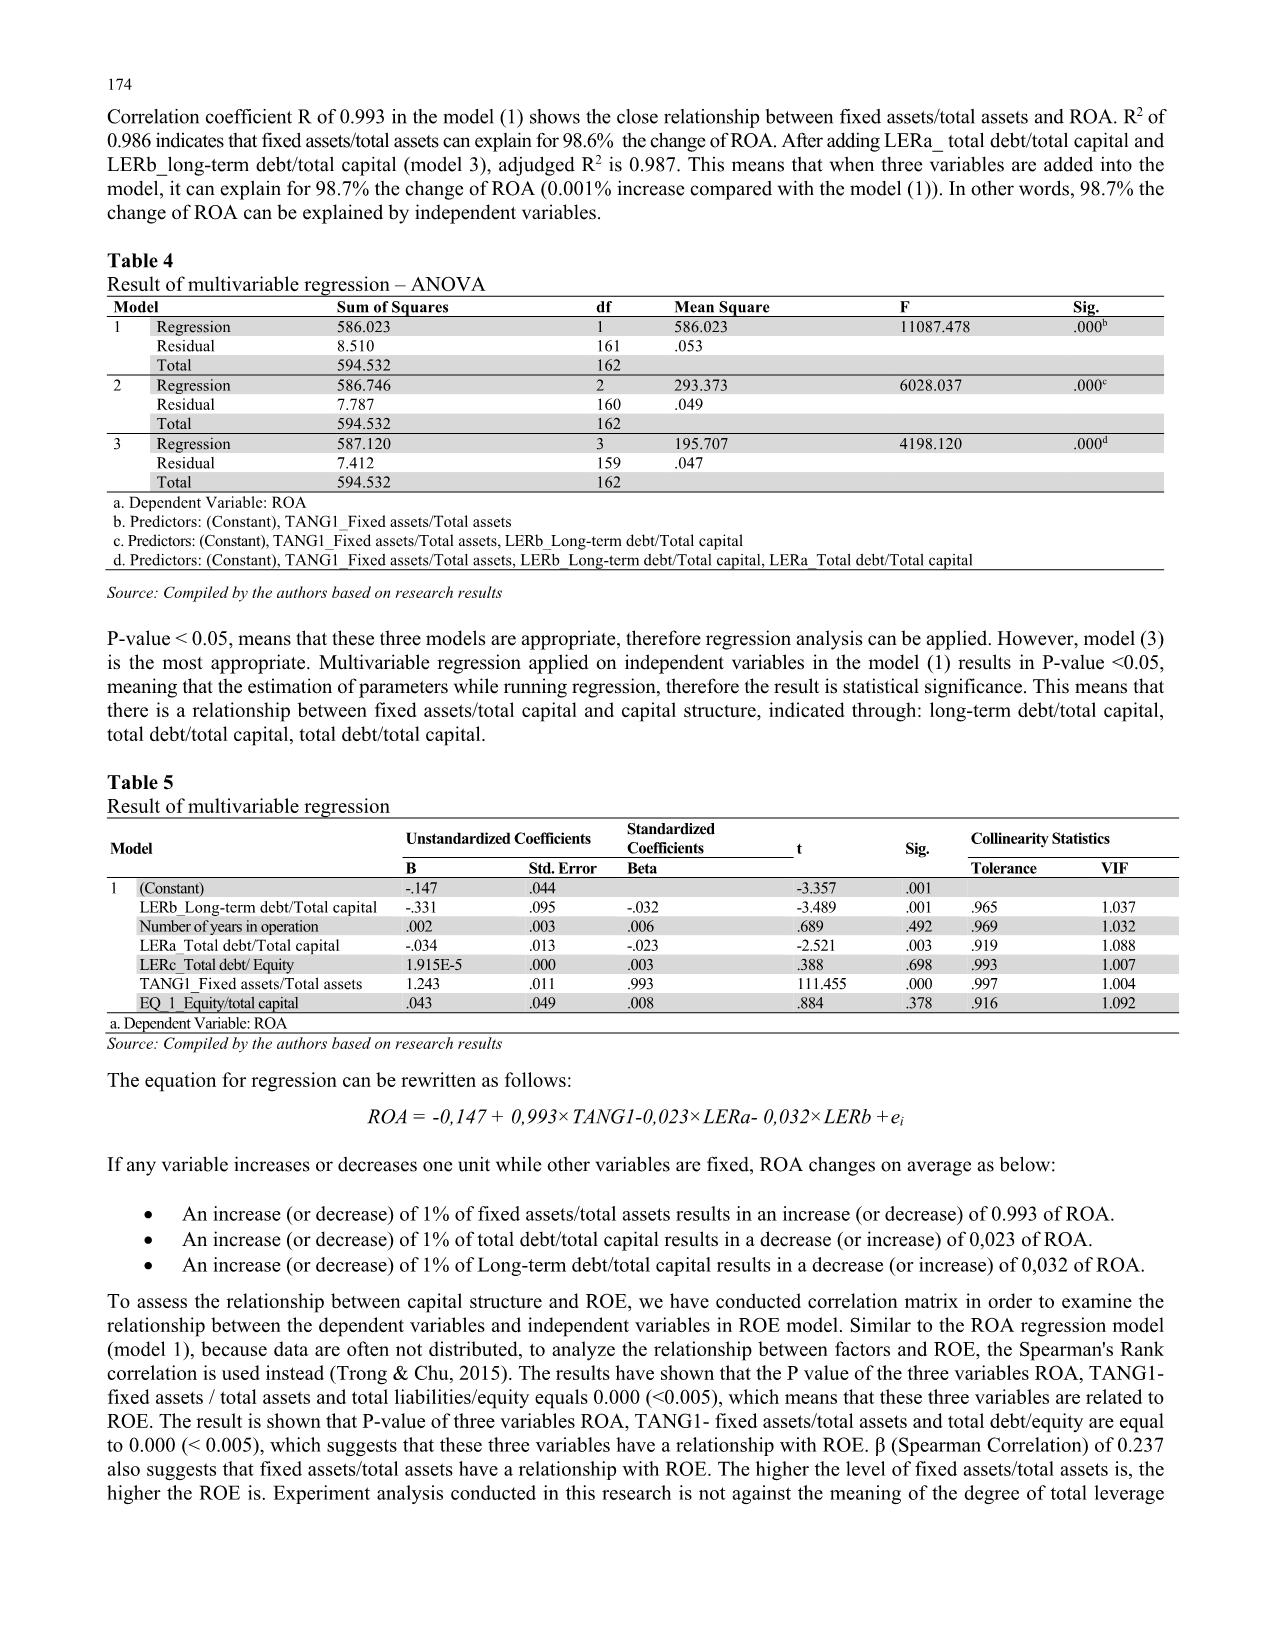
Table 4
Result of multivariable regression – ANOVA
Model Sum of Squares df Mean Square F Sig.
1 Regression 586.023 1 586.023 11087.478 .000b
Residual 8.510 161 .053
Total 594.532 162
2 Regression 586.746 2 293.373 6028.037 .000c
Residual 7.787 160 .049
Total 594.532 162
3 Regression 587.120 3 195.707 4198.120 .000d
Residual 7.412 159 .047
Total 594.532 162
a. Dependent Variable: ROA
b. Predictors: (Constant), TANG1_Fixed assets/Total assets
c. Predictors: (Constant), TANG1_Fixed assets/Total assets, LERb_Long-term debt/Total capital
d. Predictors: (Constant), TANG1_Fixed assets/Total assets, LERb_Long-term debt/Total capital, LERa_Total debt/Total capital
Source: Compiled by the authors based on research results
P-value < 0.05, means that these three models are appropriate, therefore regression analysis can be applied. However, model (3)
is the most appropriate. Multivariable regression applied on independent variables in the model (1) results in P-value <0.05,
meaning that the estimation of parameters while running regression, therefore the result is statistical significance. This means that
there is a relationship between fixed assets/total capital and capital structure, indicated through: long-term debt/total capital,
total debt/total capital, total debt/total capital.
Table 5
Result of multivariable regression
Model Unstandardized Coefficients
Standardized
Coefficients t Sig. Collinearity Statistics
B Std. Error Beta Tolerance VIF
1 (Constant) -.147 .044 -3.357 .001
LERb_Long-term debt/Total capital -.331 .095 -.032 -3.489 .001 .965 1.037
Number of years in operation .002 .003 .006 .689 .492 .969 1.032
LERa_Total debt/Total capital -.034 .013 -.023 -2.521 .003 .919 1.088
LERc_Total debt/ Equity 1.915E-5 .000 .003 .388 .698 .993 1.007
TANG1_Fixed assets/Total assets 1.243 .011 .993 111.455 .000 .997 1.004
EQ_1_Equity/total capital .043 .049 .008 .884 .378 .916 1.092
a. Dependent Variable: ROA
Source: Compiled by the authors based on research results
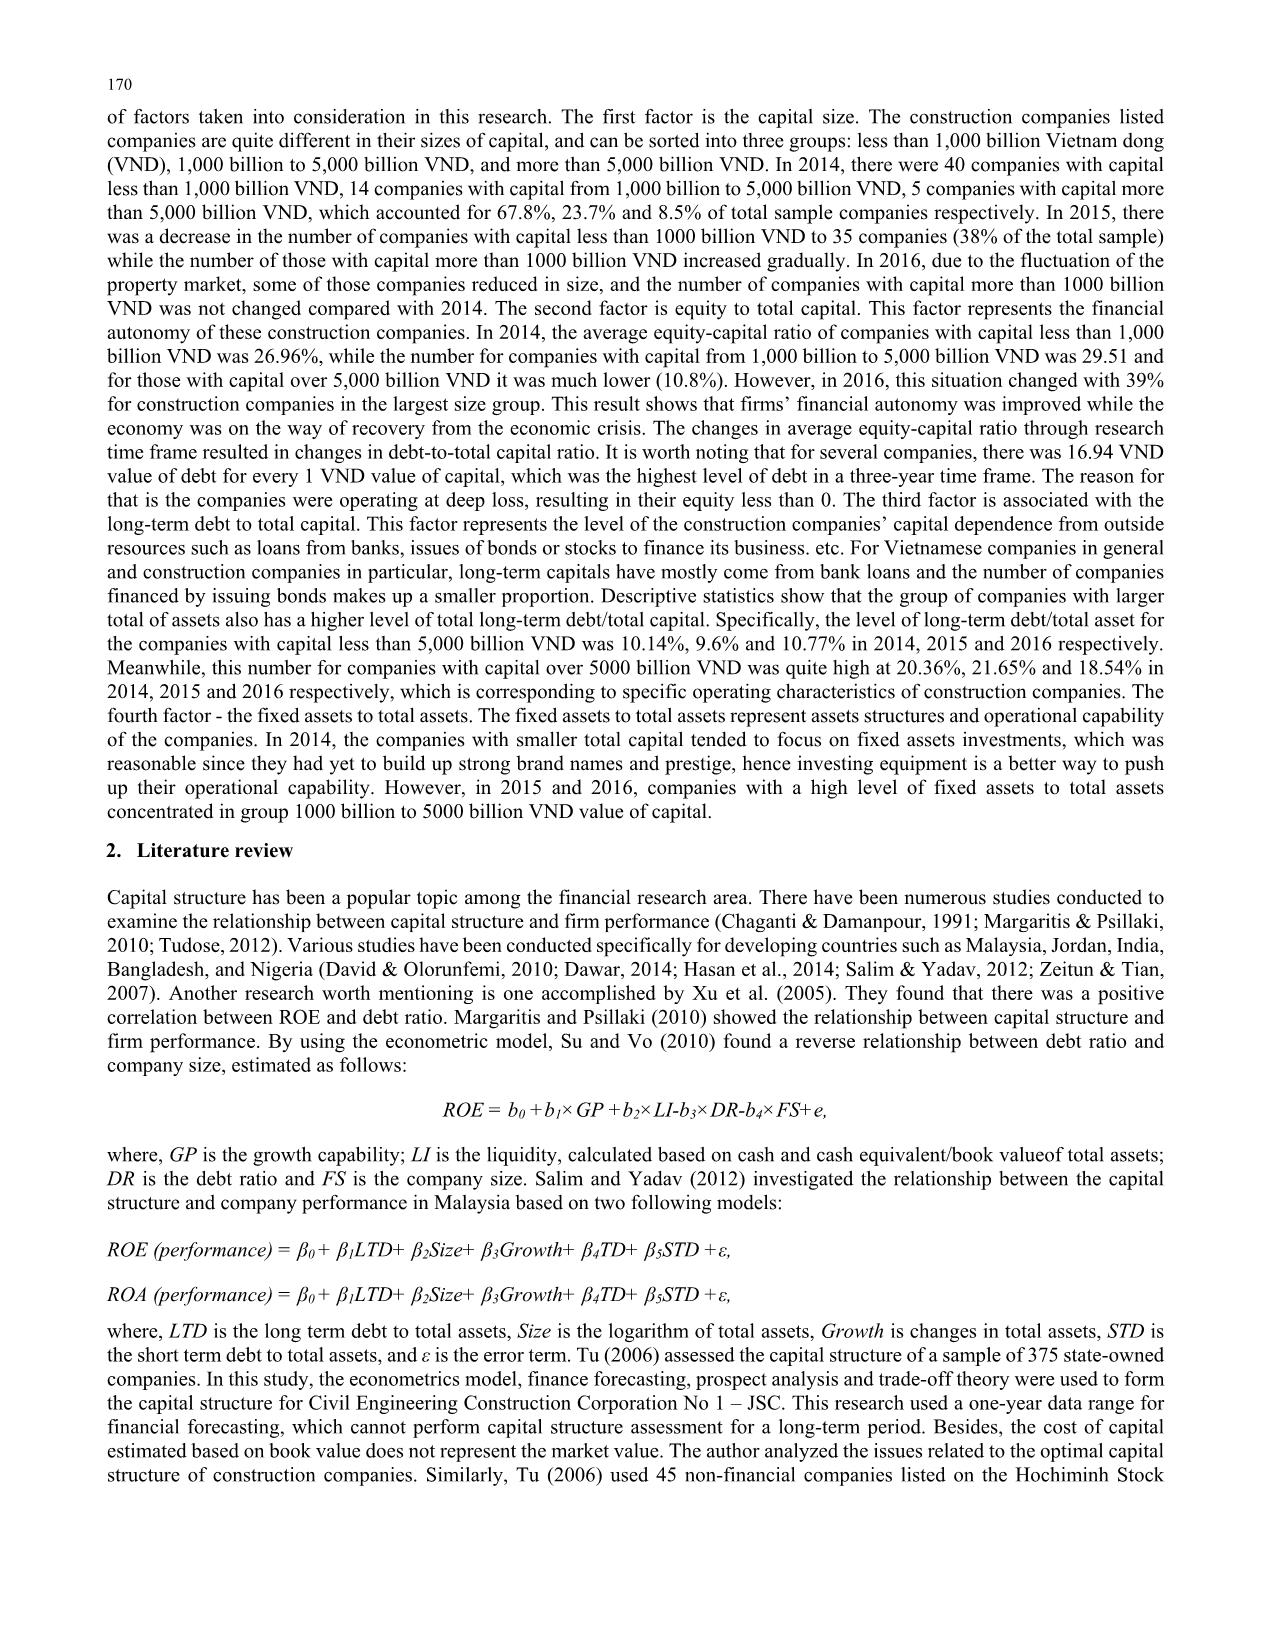
The equation for regression can be rewritten as follows:
ROA = -0,147 + 0,993×TANG1-0,023×LERa- 0,032×LERb +ei
If any variable increases or decreases one unit while other variables are fixed, ROA changes on average as below:
 An increase (or decrease) of 1% of fixed assets/total assets results in an increase (or decrease) of 0.993 of ROA.
 An increase (or decrease) of 1% of total debt/total capital results in a decrease (or increase) of 0,023 of ROA.
 An increase (or decrease) of 1% of Long-term debt/total capital results in a decrease (or increase) of 0,032 of ROA.
To assess the relationship between capital structure and ROE, we have conducted correlation matrix in order to examine the
relationship between the dependent variables and independent variables in ROE model. Similar to the ROA regression model
(model 1), because data are often not distributed, to analyze the relationship between factors and ROE, the Spearman's Rank
correlation is used instead (Trong & Chu, 2015). The results have shown that the P value of the three variables ROA, TANG1-
fixed assets / total assets and total liabilities/equity equals 0.000 (<0.005), which means that these three variables are related to
ROE. The result is shown that P-value of three variables ROA, TANG1- fixed assets/total assets and total debt/equity are equal
to 0.000 (< 0.005), which suggests that these three variables have a relationship with ROE. β (Spearman Correlation) of 0.237
also suggests that fixed assets/total assets have a relationship with ROE. The higher the level of fixed assets/total assets is, the
higher the ROE is. Experiment analysis conducted in this research is not against the meaning of the degree of total leverage
T.T.T. Vu et al. /Accounting 6 (2020) 175
which shows the relationship between the level of fixed assets and ROE in a firm. β of ROA and total debt/equity are 0.553 and
-0.233, respectively, suggesting the positive relationship between ROA and ROE, and a negative relationship between total
debt/equity and ROE. Multivariable regression analysis for ROE, estimation of parameters of the model and test the hypothesis
of the model for ROE is conducted similar to ROA. Multivariable regression analysis is applied in order to verify the supposition
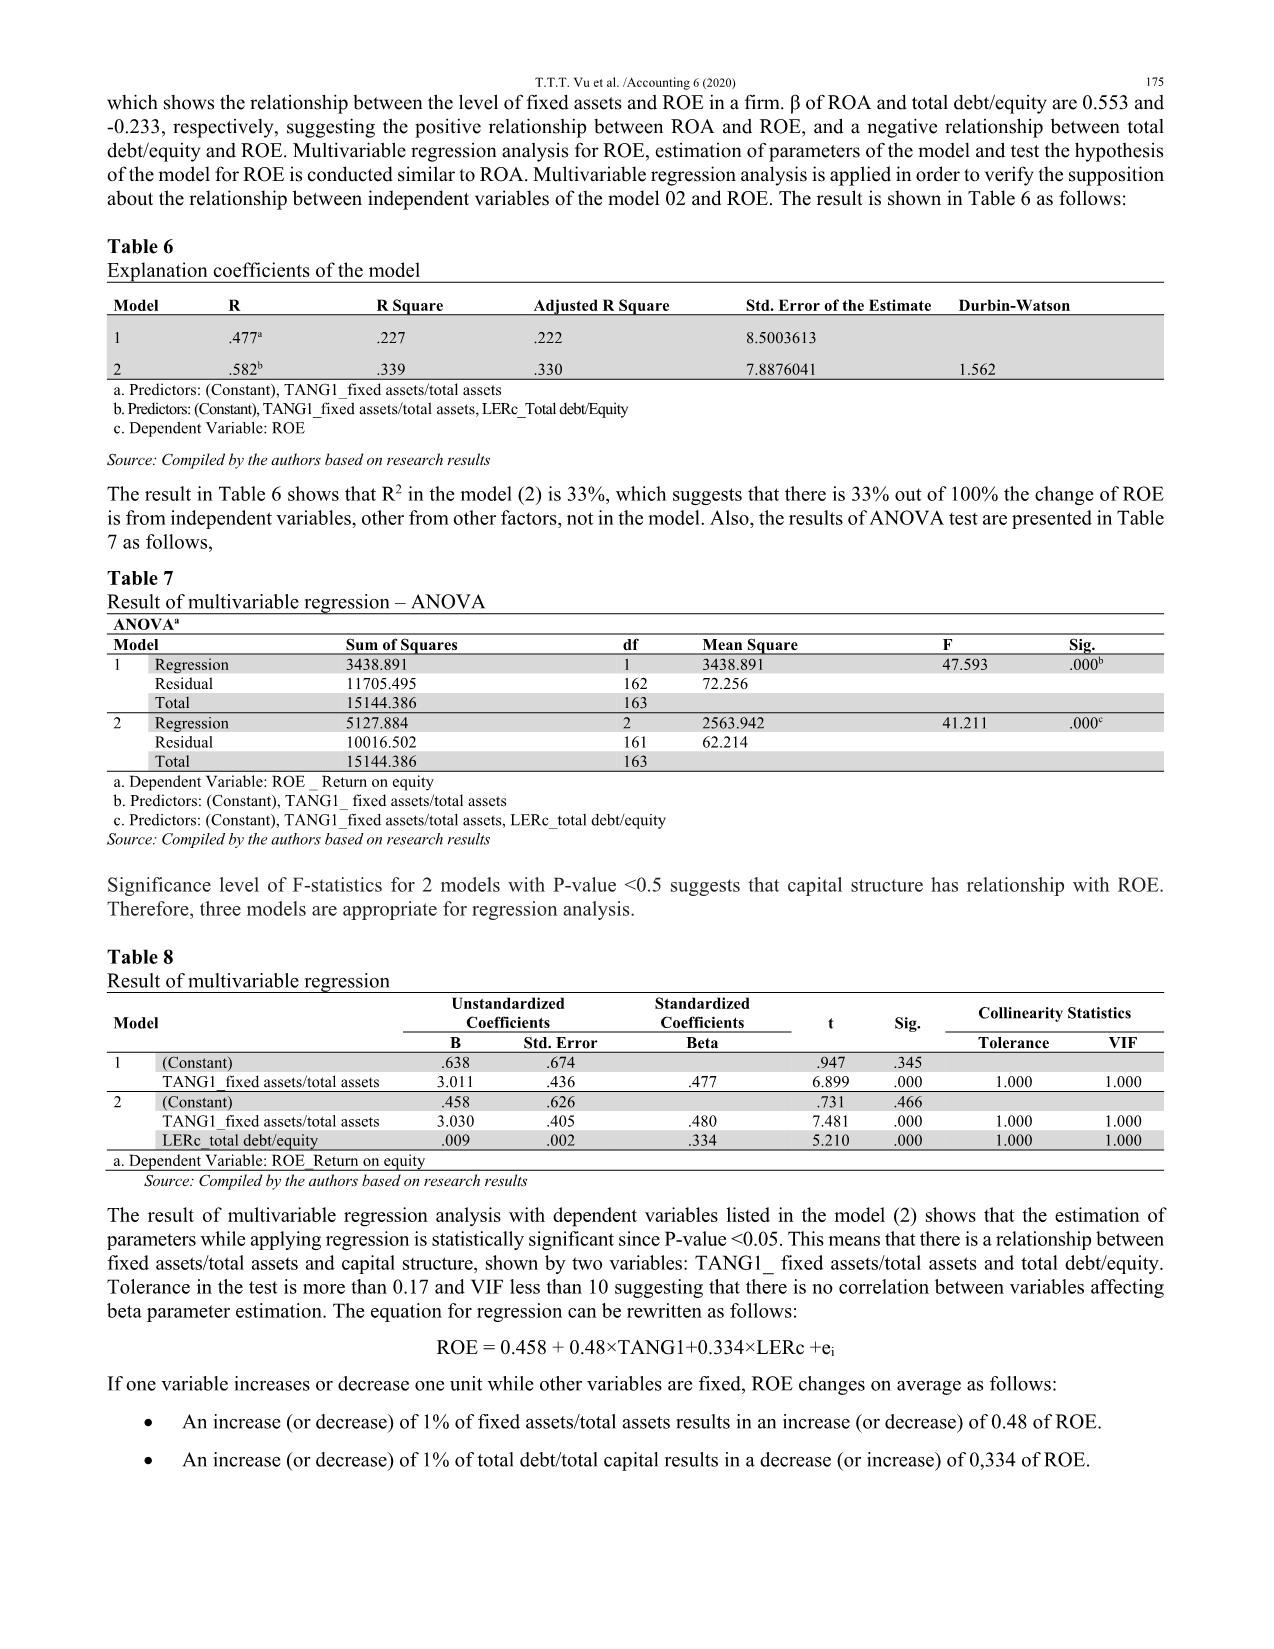
about the relationship between independent variables of the model 02 and ROE. The result is shown in Table 6 as follows:
Table 6
Explanation coefficients of the model
Model R R Square Adjusted R Square Std. Error of the Estimate Durbin-Watson
1 .477a .227 .222 8.5003613
2 .582b .339 .330 7.8876041 1.562
a. Predictors: (Constant), TANG1_fixed assets/total assets
b. Predictors: (Constant), TANG1_fixed assets/total assets, LERc_Total debt/Equity
c. Dependent Variable: ROE
Source: Compiled by the authors based on research results
The result in Table 6 shows that R2 in the model (2) is 33%, which suggests that there is 33% out of 100% the change of ROE
is from independent variables, other from other factors, not in the model. Also, the results of ANOVA test are presented in Table
7 as follows,
Table 7
Result of multivariable regression – ANOVA
ANOVAa
Model Sum of Squares df Mean Square F Sig.
1 Regression 3438.891 1 3438.891 47.593 .000b
Residual 11705.495 162 72.256
Total 15144.386 163
2 Regression 5127.884 2 2563.942 41.211 .000c
Residual 10016.502 161 62.214
Total 15144.386 163
a. Dependent Variable: ROE _ Return on equity
b. Predictors: (Constant), TANG1_ fixed assets/total assets
c. Predictors: (Constant), TANG1_fixed assets/total assets, LERc_total debt/equity
Source: Compiled by the authors based on research results
Significance level of F-statistics for 2 models with P-value <0.5 suggests that capital structure has relationship with ROE.
Therefore, three models are appropriate for regression analysis.
Table 8
Result of multivariable regression
Model
Unstandardized
Coefficients
Standardized
Coefficients t Sig. Collinearity Statistics
B Std. Error Beta Tolerance VIF
1 (Constant) .638 .674 .947 .345
TANG1_fixed assets/total assets 3.011 .436 .477 6.899 .000 1.000 1.000
2 (Constant) .458 .626 .731 .466
TANG1_fixed assets/total assets 3.030 .405 .480 7.481 .000 1.000 1.000
LERc_total debt/equity .009 .002 .334 5.210 .000 1.000 1.000
a. Dependent Variable: ROE_Return on equity
Source: Compiled by the authors based on research results
The result of multivariable regression analysis with dependent variables listed in the model (2) shows that the estimation of
parameters while applying regression is statistically significant since P-value <0.05. This means that there is a relationship between
fixed assets/total assets and capital structure, shown by two variables: TANG1_ fixed assets/total assets and total debt/equity.
Tolerance in the test is more than 0.17 and VIF less than 10 suggesting that there is no correlation between variables affecting
beta parameter estimation. The equation for regression can be rewritten as follows:
ROE = 0.458 + 0.48×TANG1+0.334×LERc +ei
If one variable increases or decrease one unit while other variables are fixed, ROE changes on average as follows:
 An increase (or decrease) of 1% of fixed assets/total assets results in an increase (or decrease) of 0.48 of ROE.
 An increase (or decrease) of 1% of total debt/total capital results in a decrease (or increase) of 0,334 of ROE.
 176
5. Conclusion
In summary, first, based on data set from 2014-2016, we have found no evidence for the relationship between the number of
years in operation, total assets, long-term debt/total capital, total debt/total capital and ROA, ROE, although several other studies
have found out this relationship. Secondly, the results have shown that there was a relationship between other factors and ROA,
ROE and these factors can explain for 96.8% the change of ROA and 33% the change of ROE in listed construction companies
on Stock Exchange in Vietnam. Third, regression result suggests the strongest positive relationship between fixed assets/total
assets and ROA, ROE among factors taken into this research, which reveals the need of increasing the effectiveness of fixed
assets in construction companies. Fourth, debt/equity has maintained a positive relationship with ROE, suggesting that the higher
the level of debt/equity is, the higher the ROE is. Fifth, debt/total capital and long-term debt/total capital maintained a negative
relationship with ROA and they both had similar effects on ROA, which implies that in the recession of the economy, with the
slow speed of development of the market, high level of debt could have negative effect on the profitability of total assets
However, in order to figure out if there are differences in the level of capital when examining the relationship between LERc
and ROE, and to find out the persuasive basis for solutions, correlation analysis between LERc (debt/equity) and ROE is
conducted by level of capital and by year.
References
Chaganti, R., & Damanpour, F. (1991). Institutional ownership, capital structure, and firm performance. Strategic management
journal, 12(7), 479-491.
David, D. F., & Olorunfemi, S. (2010) ‘Capital Structure and Corporate Performance in Nigeria Petroleum Industry : Panel Data
Analysis’ Journal of Mathematics and Statistics, 6(2), 168 - 173.
Dawar, V. (2014). Agency theory, capital structure and firm performance: some Indian evidence. Managerial Finance, 40(12),
1190 - 1206.
Hasan, M. B., Ahsan, A. F. M. M., Rahaman, M. A., & Alam, M. N. (2014). Influence of capital structure on firm performance:
Evidence from Bangladesh. International Journal of Business and Management, 9(5), 184 - 194.
Lan, T.T.P. (2013). Contruction and real estate companies, risks from the financial leverage. VNU Journal of Science,
Economics and Business, 29(3), 68 – 74.
Margaritis, D., & Psillaki, M. (2010). Capital structure, equity ownership and firm performance. Journal of Banking and
Finance, 34(3), 621 - 632.
Su, G. S., & Vo, H. T. (2010). The relationship between corporate strategy, capital structure and firm performance: An empirical
study of the listed companies in Vietnam. International Research Journal of Finance and Economics, 50, 62-71.
Salim, M., & Yadav, R. (2012). Capital structure and firm performance: Evidence from Malaysian listed companies. Procedia-
Social and Behavioral Sciences, 65, 156-166.
Son, T.H. (2008). Capital structure and firm performance. Banking Technology, 33, 31-35.
Tu, T.T.T. (2006). The renovation of capital structure of state-owned enterprises. PhD thesis, National Economic University,
Hanoi, Vietnam.
Trong, H., & Chu, N. M. N. (2015). Analyzing research data with SPSS. 2nd ed, Hong Duc, Hanoi.
Tudose, M. B. (2012). Capital Structure and Firm Performance. Economy Transdisciplinarity Cognition, 15(2), 76 - 82.
Xu, W., Xu, X., & Zhang, S. ( 2005). An empirical study on relationship between corporation performance and capital
structure. China – USA Business Review, 4(4), 49 – 53.
Zeitun, R., & Tian, G. G. (2007). Capital structure and corporate performance : evidence from Jordan. Australasian Accounting
Business and Finance Journal, 1(4), 40 - 61.
© 2019 by the authors; licensee Growing Science, Canada. This is an open access article distributed
under the terms and conditions of the Creative Commons Attribution (CC-BY) license
(
File đính kèm:
 the_impact_of_capital_structure_on_the_performance_of_constr.pdf

