The governance quality-growth nexus revisited: A new evidence from the Bayesian multilevel generalized linear model
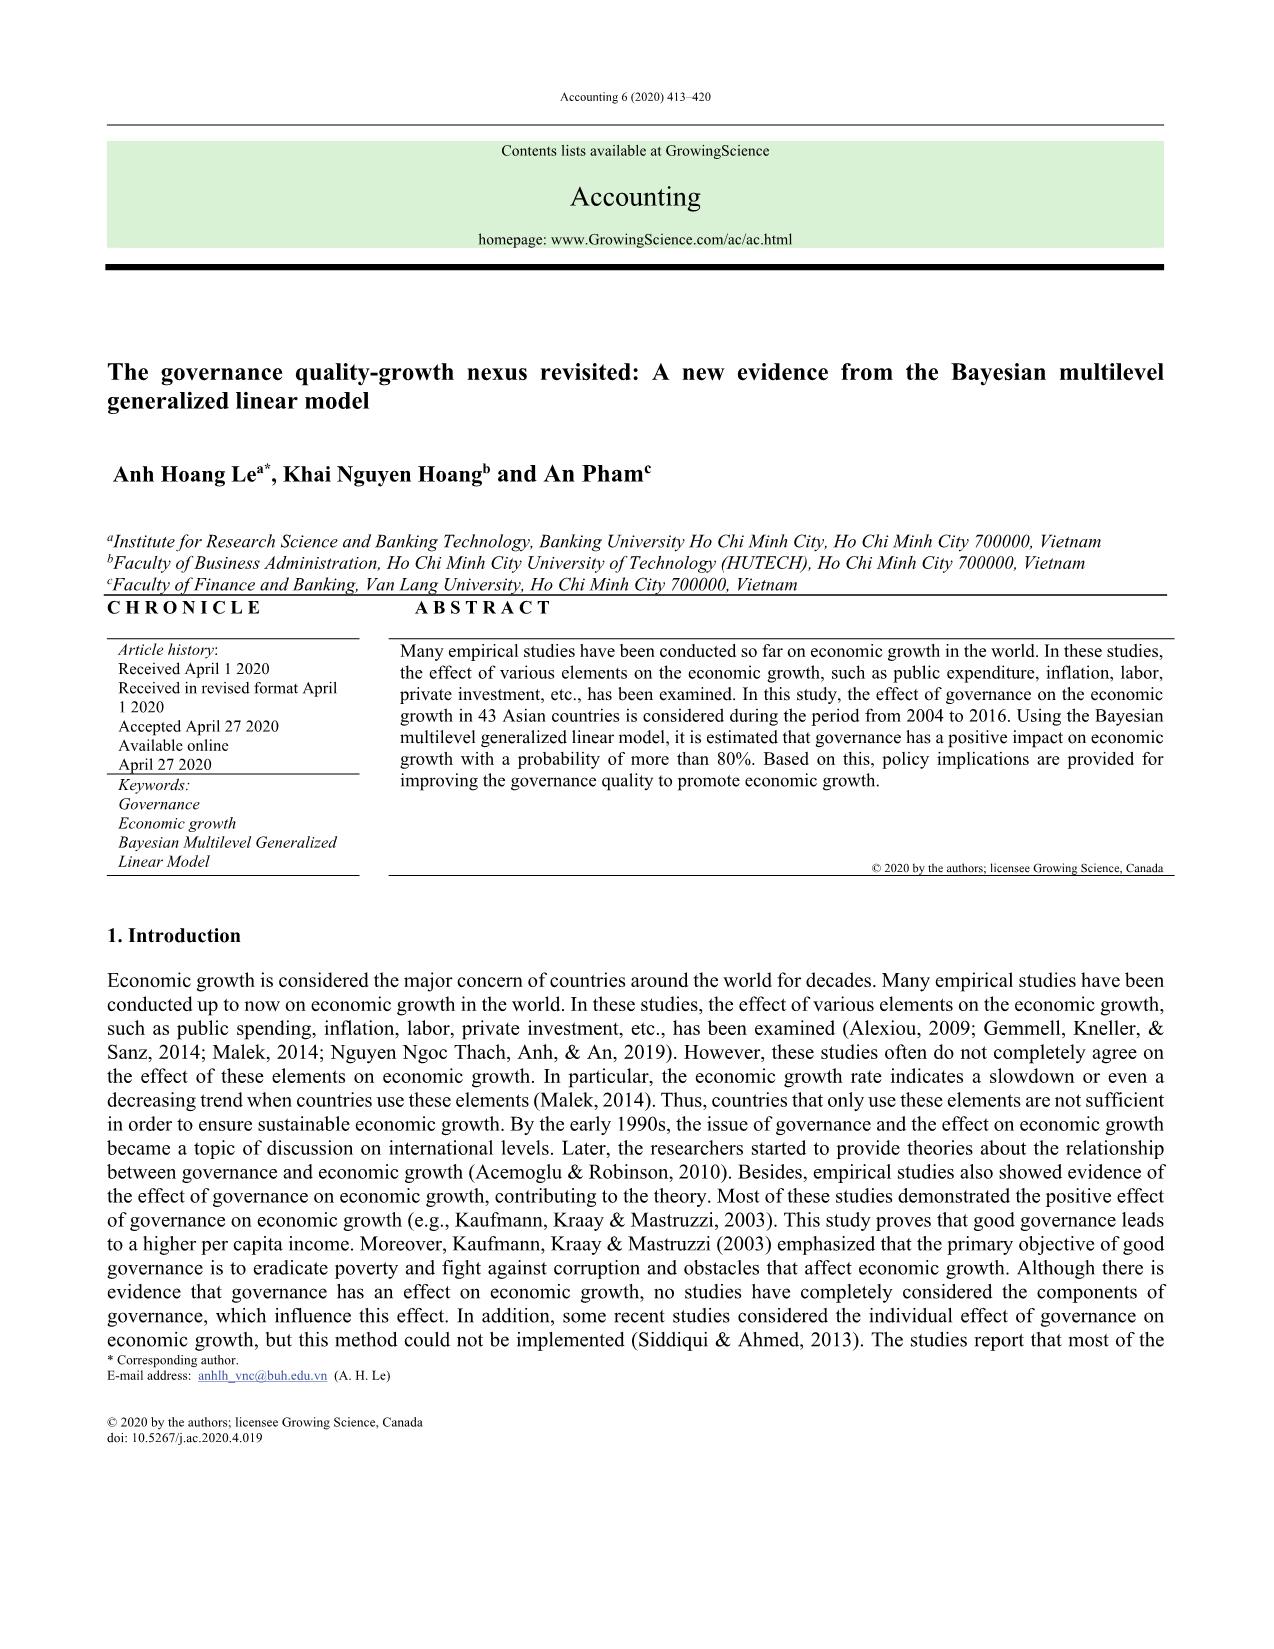
Many empirical studies have been conducted so far on economic growth in the world. In these studies,
the effect of various elements on the economic growth, such as public expenditure, inflation, labor,
private investment, etc., has been examined. In this study, the effect of governance on the economic
growth in 43 Asian countries is considered during the period from 2004 to 2016. Using the Bayesian
multilevel generalized linear model, it is estimated that governance has a positive impact on economic
growth with a probability of more than 80%. Based on this, policy implications are provided for
improving the governance quality to promote economic growth.
Trang 1
Trang 2
Trang 3
Trang 4
Trang 5
Trang 6
Trang 7
Trang 8
Bạn đang xem tài liệu "The governance quality-growth nexus revisited: A new evidence from the Bayesian multilevel generalized linear model", để tải tài liệu gốc về máy hãy click vào nút Download ở trên
Tóm tắt nội dung tài liệu: The governance quality-growth nexus revisited: A new evidence from the Bayesian multilevel generalized linear model
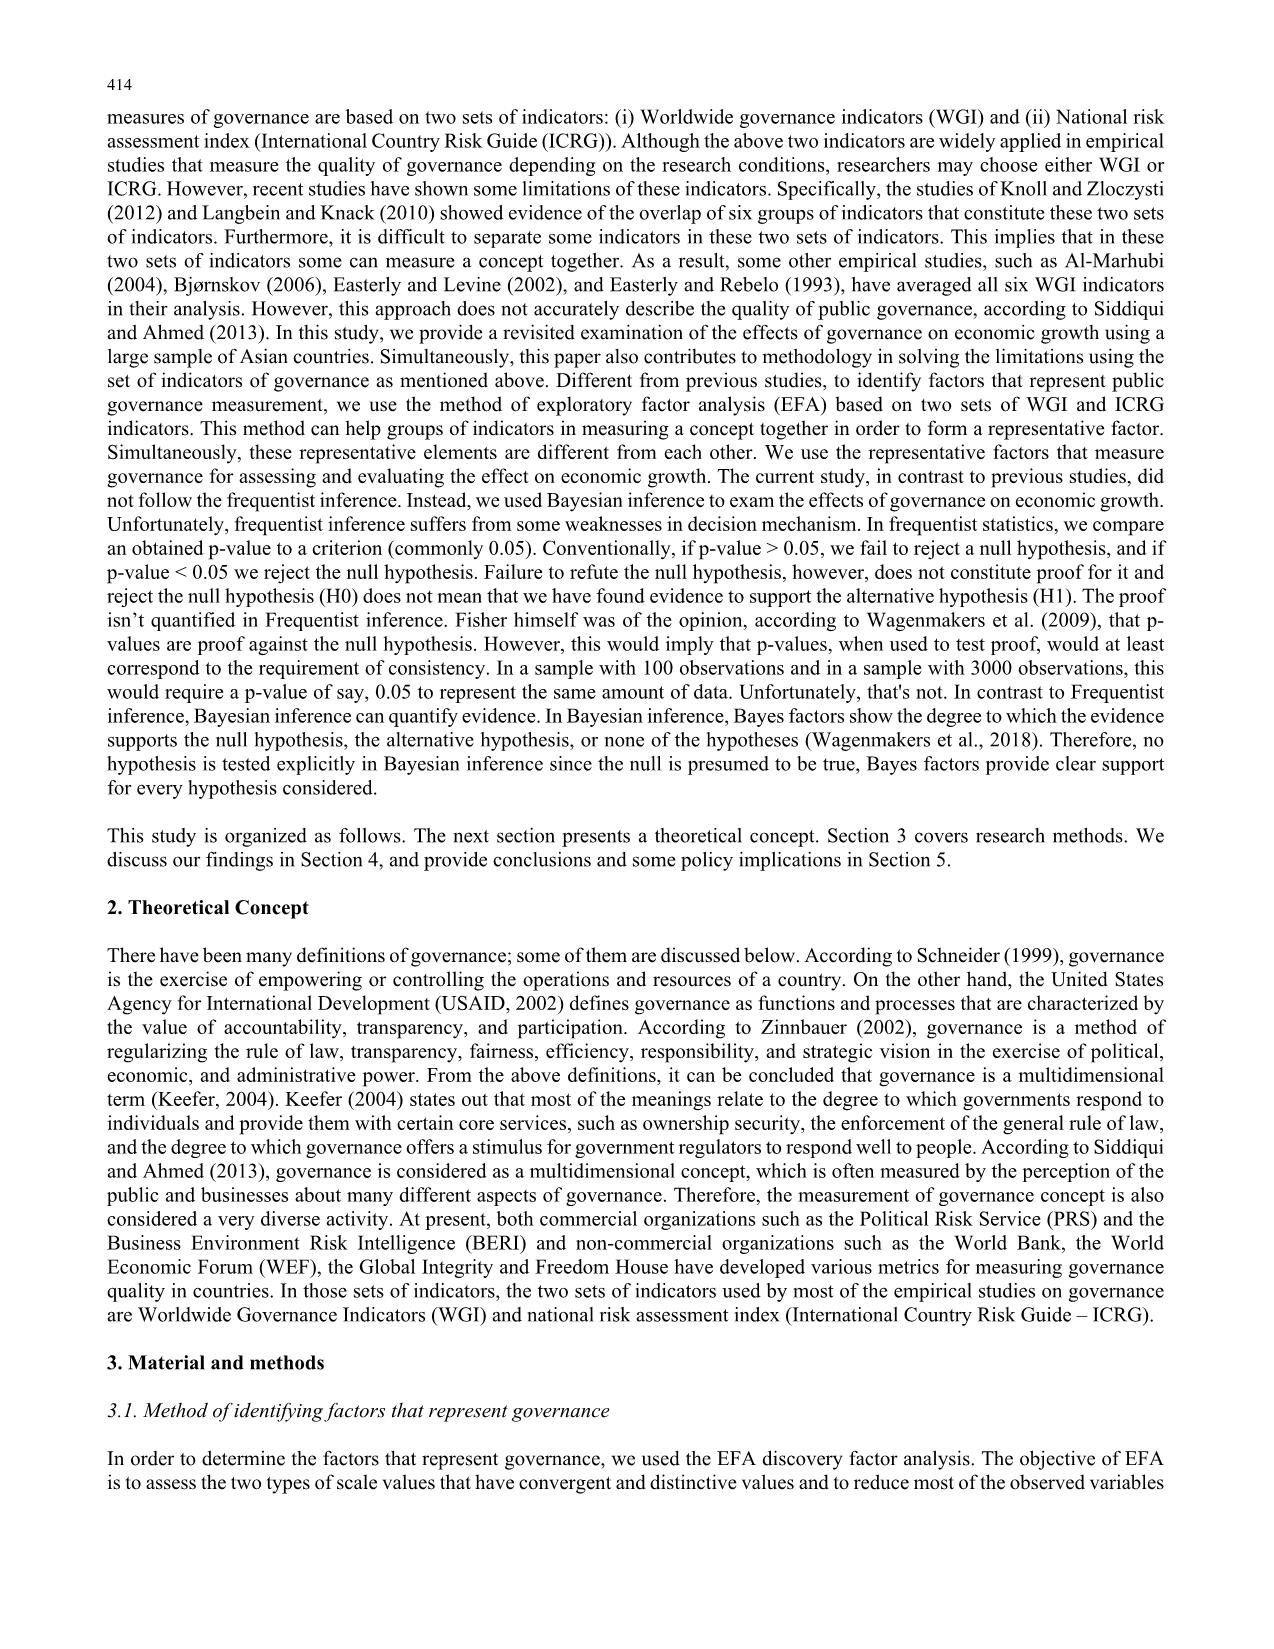
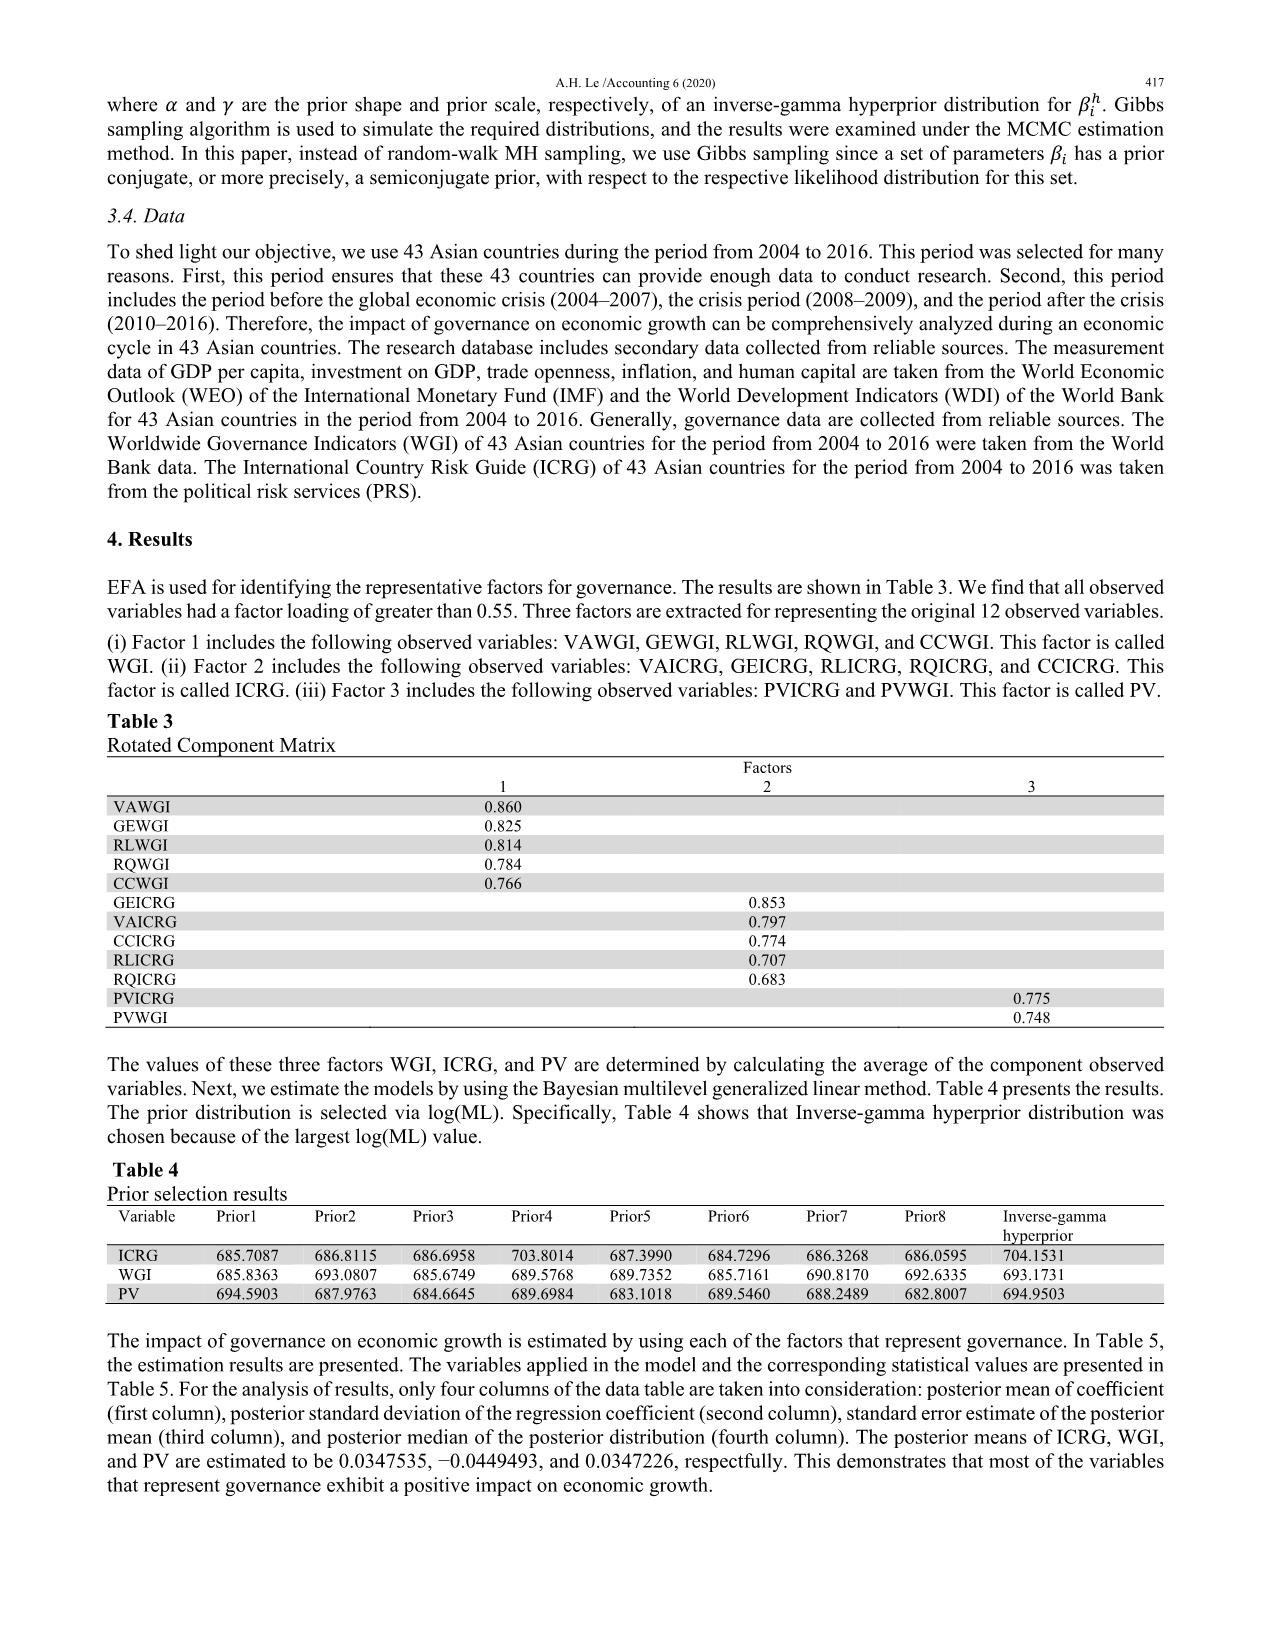
 representing the original 12 observed variables.
(i) Factor 1 includes the following observed variables: VAWGI, GEWGI, RLWGI, RQWGI, and CCWGI. This factor is called
WGI. (ii) Factor 2 includes the following observed variables: VAICRG, GEICRG, RLICRG, RQICRG, and CCICRG. This
factor is called ICRG. (iii) Factor 3 includes the following observed variables: PVICRG and PVWGI. This factor is called PV.
Table 3
Rotated Component Matrix
 Factors
1 2 3
VAWGI 0.860
GEWGI 0.825
RLWGI 0.814
RQWGI 0.784
CCWGI 0.766
GEICRG 0.853
VAICRG 0.797
CCICRG 0.774
RLICRG 0.707
RQICRG 0.683
PVICRG 0.775
PVWGI 0.748
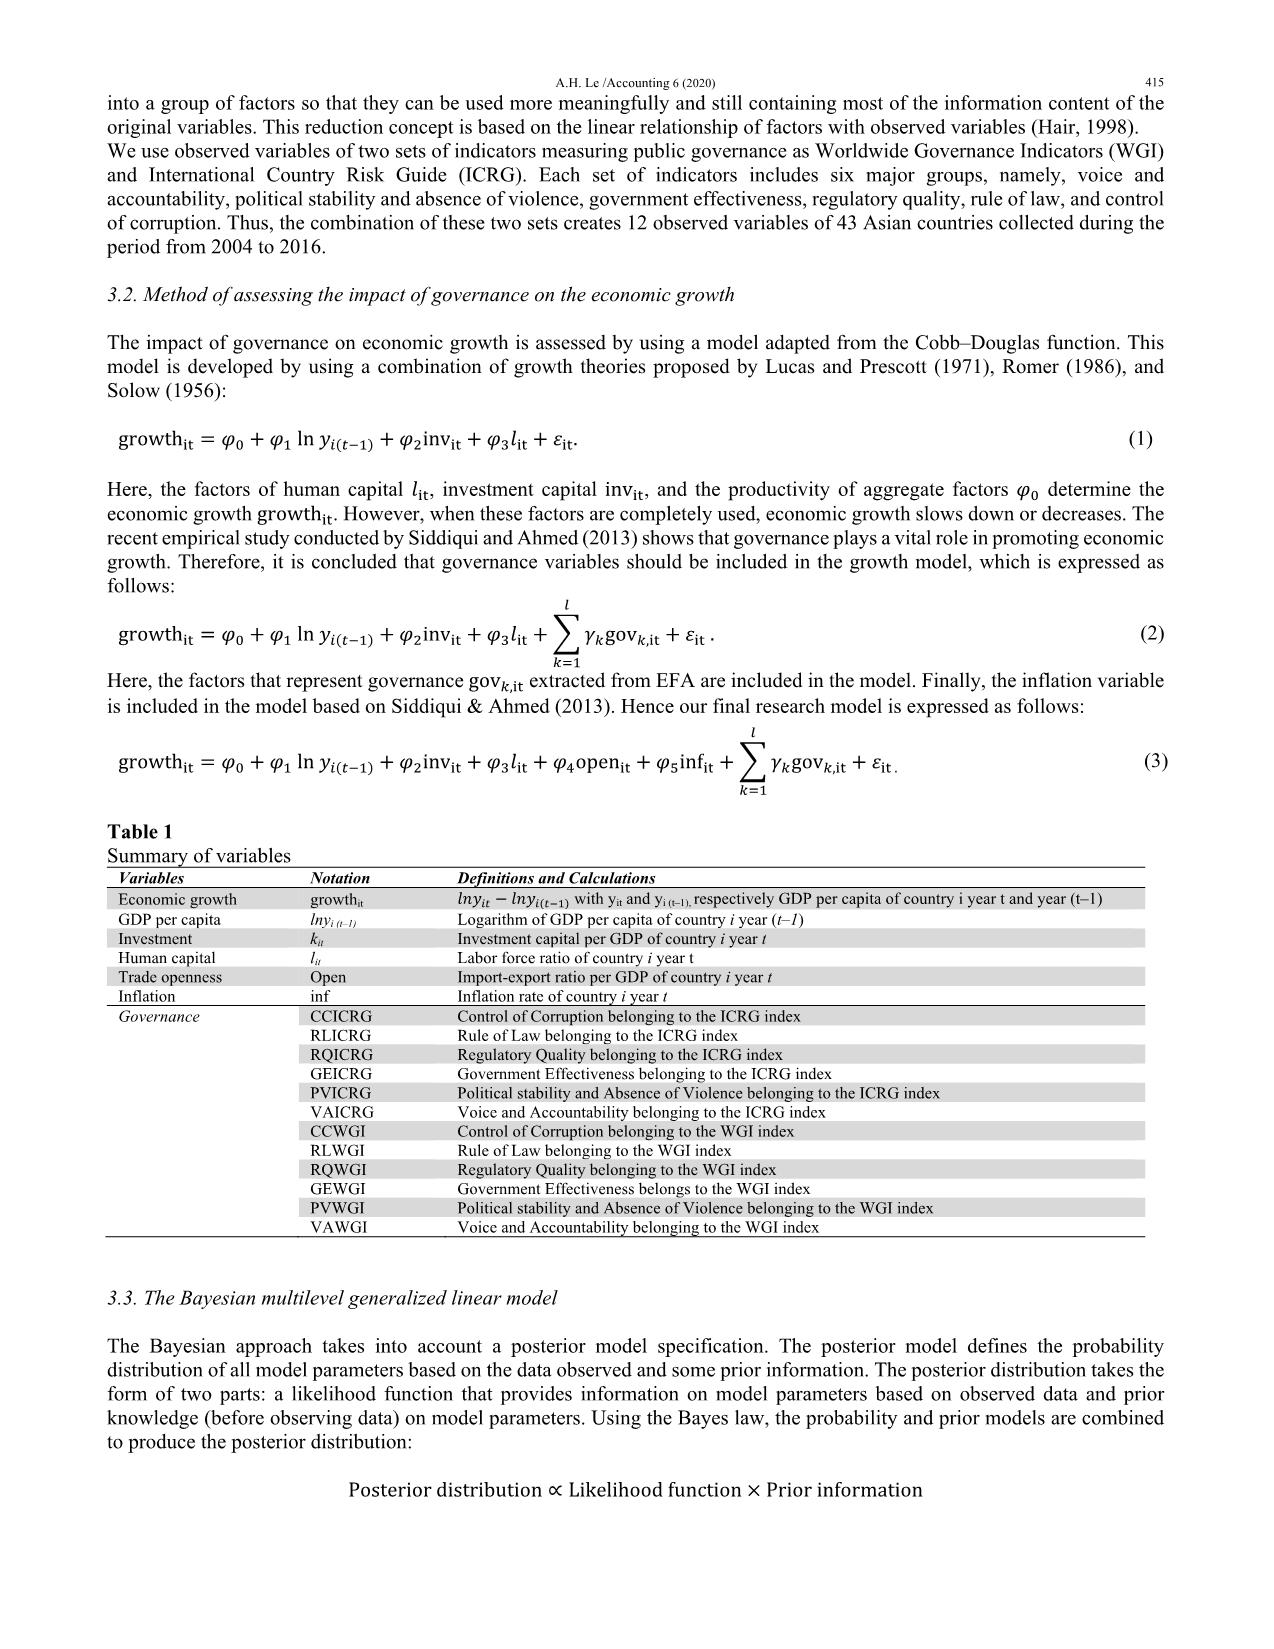
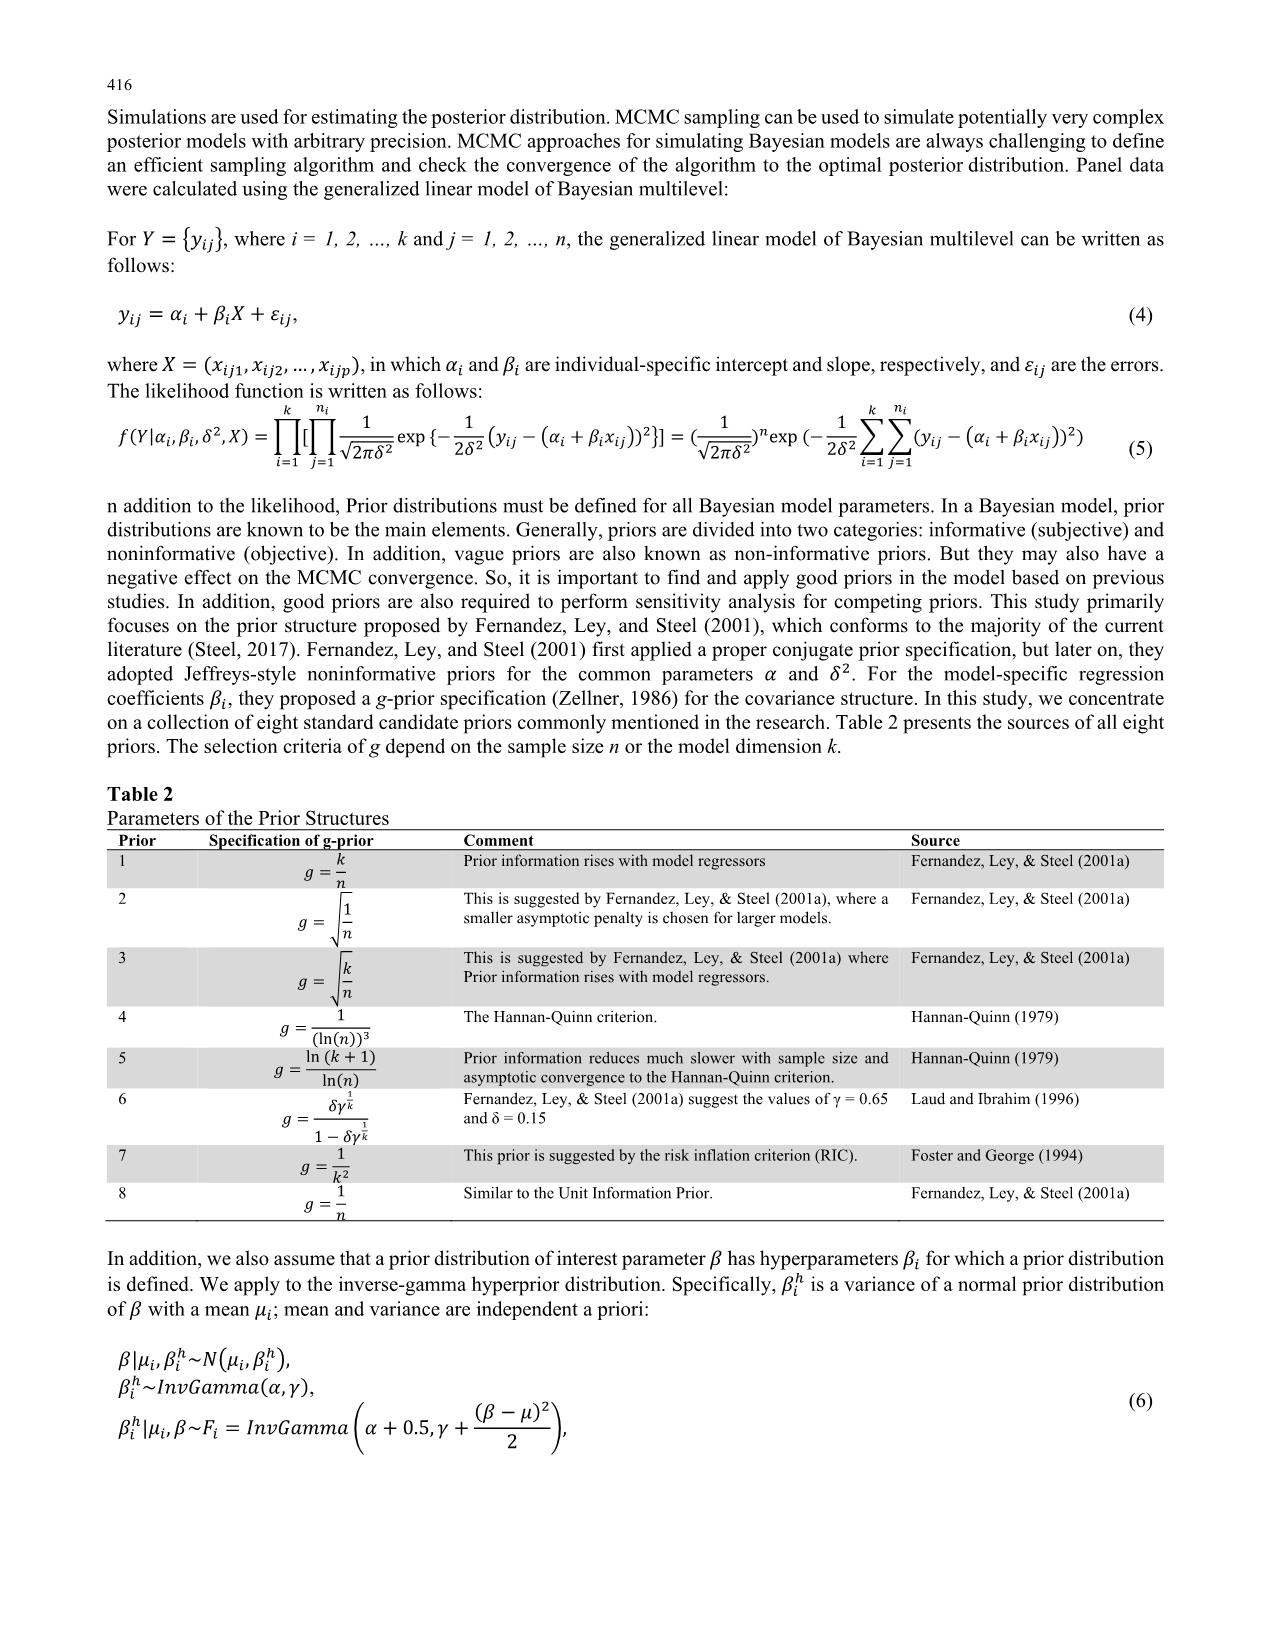
The values of these three factors WGI, ICRG, and PV are determined by calculating the average of the component observed
variables. Next, we estimate the models by using the Bayesian multilevel generalized linear method. Table 4 presents the results.
The prior distribution is selected via log(ML). Specifically, Table 4 shows that Inverse-gamma hyperprior distribution was
chosen because of the largest log(ML) value.
 Table 4
Prior selection results
Variable Prior1 Prior2 Prior3 Prior4 Prior5 Prior6 Prior7 Prior8 Inverse-gamma
hyperprior
ICRG 685.7087 686.8115 686.6958 703.8014 687.3990 684.7296 686.3268 686.0595 704.1531
WGI 685.8363 693.0807 685.6749 689.5768 689.7352 685.7161 690.8170 692.6335 693.1731
PV 694.5903 687.9763 684.6645 689.6984 683.1018 689.5460 688.2489 682.8007 694.9503
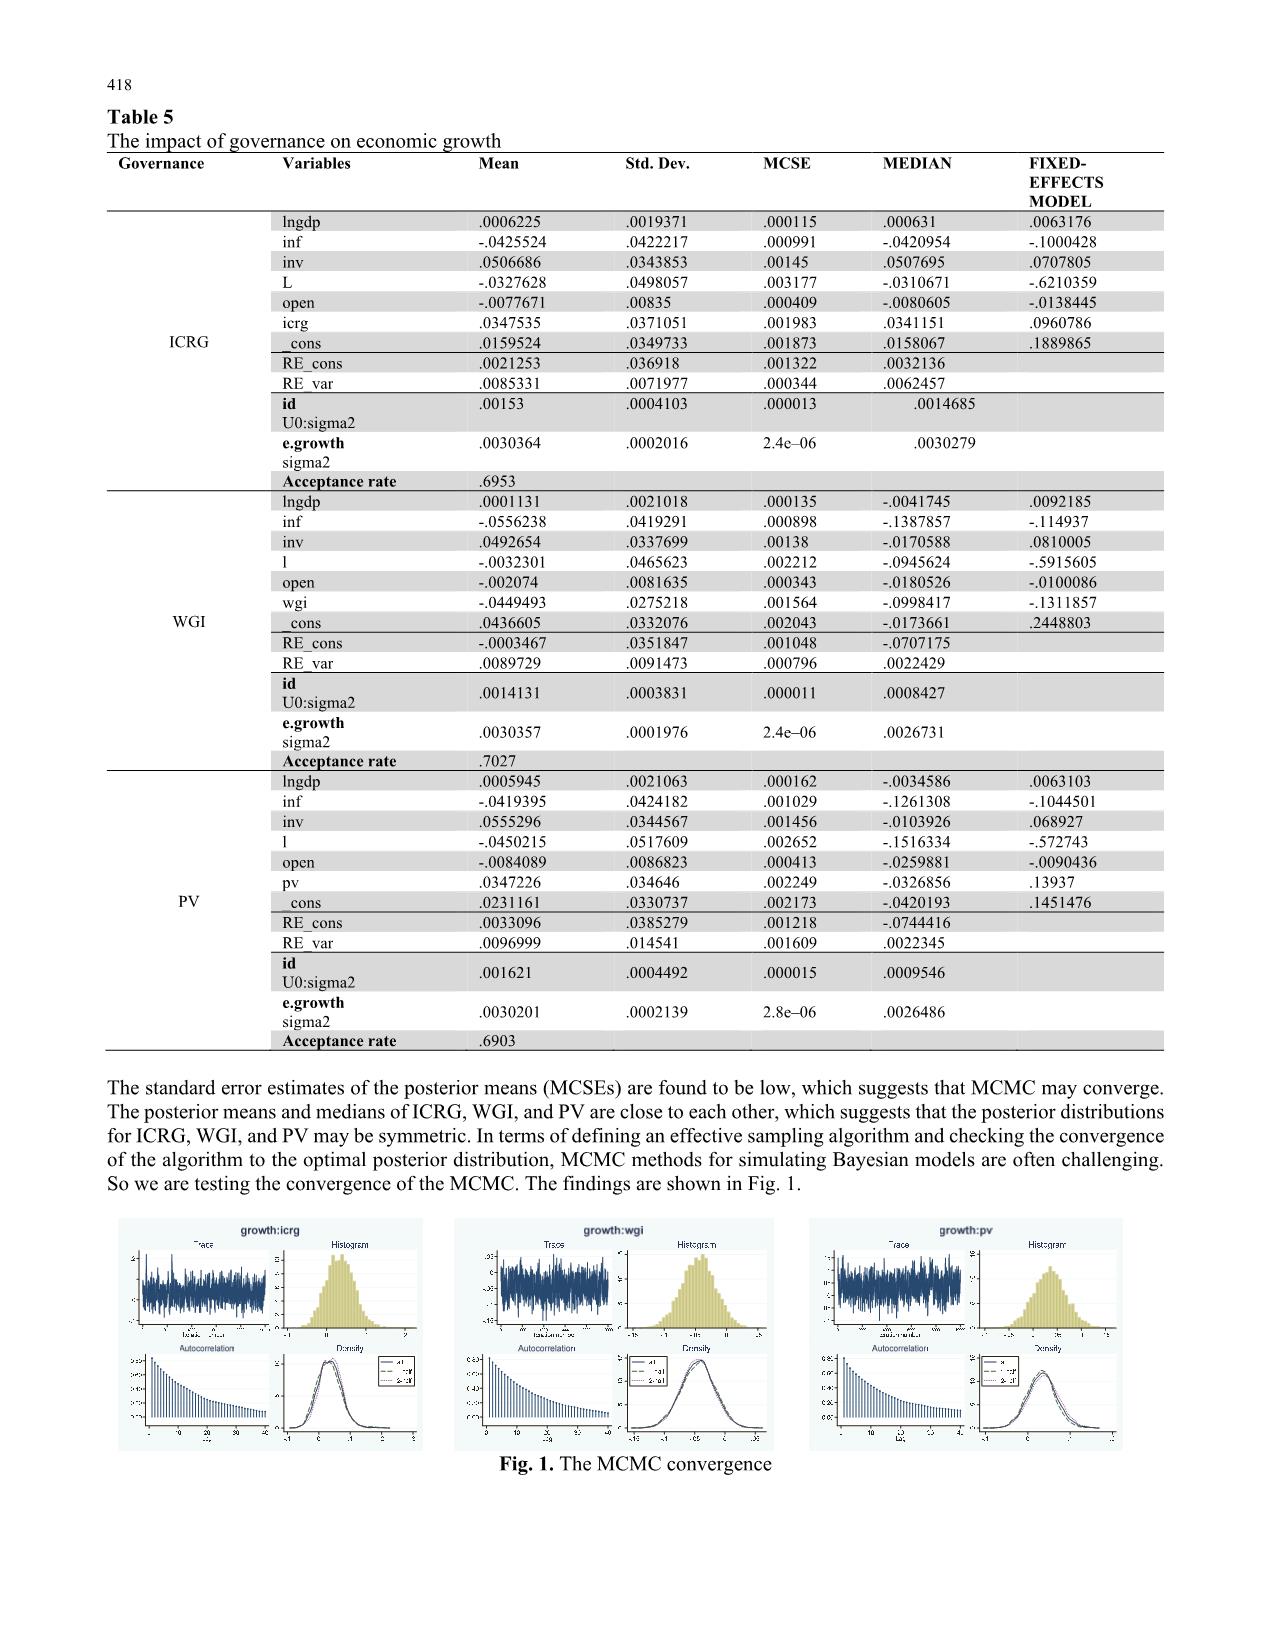
The impact of governance on economic growth is estimated by using each of the factors that represent governance. In Table 5,
the estimation results are presented. The variables applied in the model and the corresponding statistical values are presented in
Table 5. For the analysis of results, only four columns of the data table are taken into consideration: posterior mean of coefficient
(first column), posterior standard deviation of the regression coefficient (second column), standard error estimate of the posterior
mean (third column), and posterior median of the posterior distribution (fourth column). The posterior means of ICRG, WGI,
and PV are estimated to be 0.0347535, −0.0449493, and 0.0347226, respectfully. This demonstrates that most of the variables
that represent governance exhibit a positive impact on economic growth.
 418
Table 5
The impact of governance on economic growth
Governance Variables Mean Std. Dev. MCSE MEDIAN FIXED-
EFFECTS
MODEL
ICRG
lngdp .0006225 .0019371 .000115 .000631 .0063176
inf -.0425524 .0422217 .000991 -.0420954 -.1000428
inv .0506686 .0343853 .00145 .0507695 .0707805
L -.0327628 .0498057 .003177 -.0310671 -.6210359
open -.0077671 .00835 .000409 -.0080605 -.0138445
icrg .0347535 .0371051 .001983 .0341151 .0960786
_cons .0159524 .0349733 .001873 .0158067 .1889865
RE_cons .0021253 .036918 .001322 .0032136
RE_var .0085331 .0071977 .000344 .0062457
id
U0:sigma2
.00153 .0004103 .000013 .0014685
e.growth
sigma2
.0030364 .0002016 2.4e–06 .0030279
 Acceptance rate .6953
WGI
lngdp .0001131 .0021018 .000135 -.0041745 .0092185
inf -.0556238 .0419291 .000898 -.1387857 -.114937
inv .0492654 .0337699 .00138 -.0170588 .0810005
l -.0032301 .0465623 .002212 -.0945624 -.5915605
open -.002074 .0081635 .000343 -.0180526 -.0100086
wgi -.0449493 .0275218 .001564 -.0998417 -.1311857
_cons .0436605 .0332076 .002043 -.0173661 .2448803
RE_cons -.0003467 .0351847 .001048 -.0707175
RE_var .0089729 .0091473 .000796 .0022429
id
U0:sigma2 .0014131 .0003831 .000011 .0008427
e.growth
sigma2 .0030357 .0001976 2.4e–06 .0026731
 Acceptance rate .7027
PV
lngdp .0005945 .0021063 .000162 -.0034586 .0063103
inf -.0419395 .0424182 .001029 -.1261308 -.1044501
inv .0555296 .0344567 .001456 -.0103926 .068927
l -.0450215 .0517609 .002652 -.1516334 -.572743
open -.0084089 .0086823 .000413 -.0259881 -.0090436
pv .0347226 .034646 .002249 -.0326856 .13937
_cons .0231161 .0330737 .002173 -.0420193 .1451476
RE_cons .0033096 .0385279 .001218 -.0744416
RE_var .0096999 .014541 .001609 .0022345
id
U0:sigma2 .001621 .0004492 .000015 .0009546
e.growth
sigma2 .0030201 .0002139 2.8e–06 .0026486
 Acceptance rate .6903
The standard error estimates of the posterior means (MCSEs) are found to be low, which suggests that MCMC may converge.
The posterior means and medians of ICRG, WGI, and PV are close to each other, which suggests that the posterior distributions
for ICRG, WGI, and PV may be symmetric. In terms of defining an effective sampling algorithm and checking the convergence
of the algorithm to the optimal posterior distribution, MCMC methods for simulating Bayesian models are often challenging.
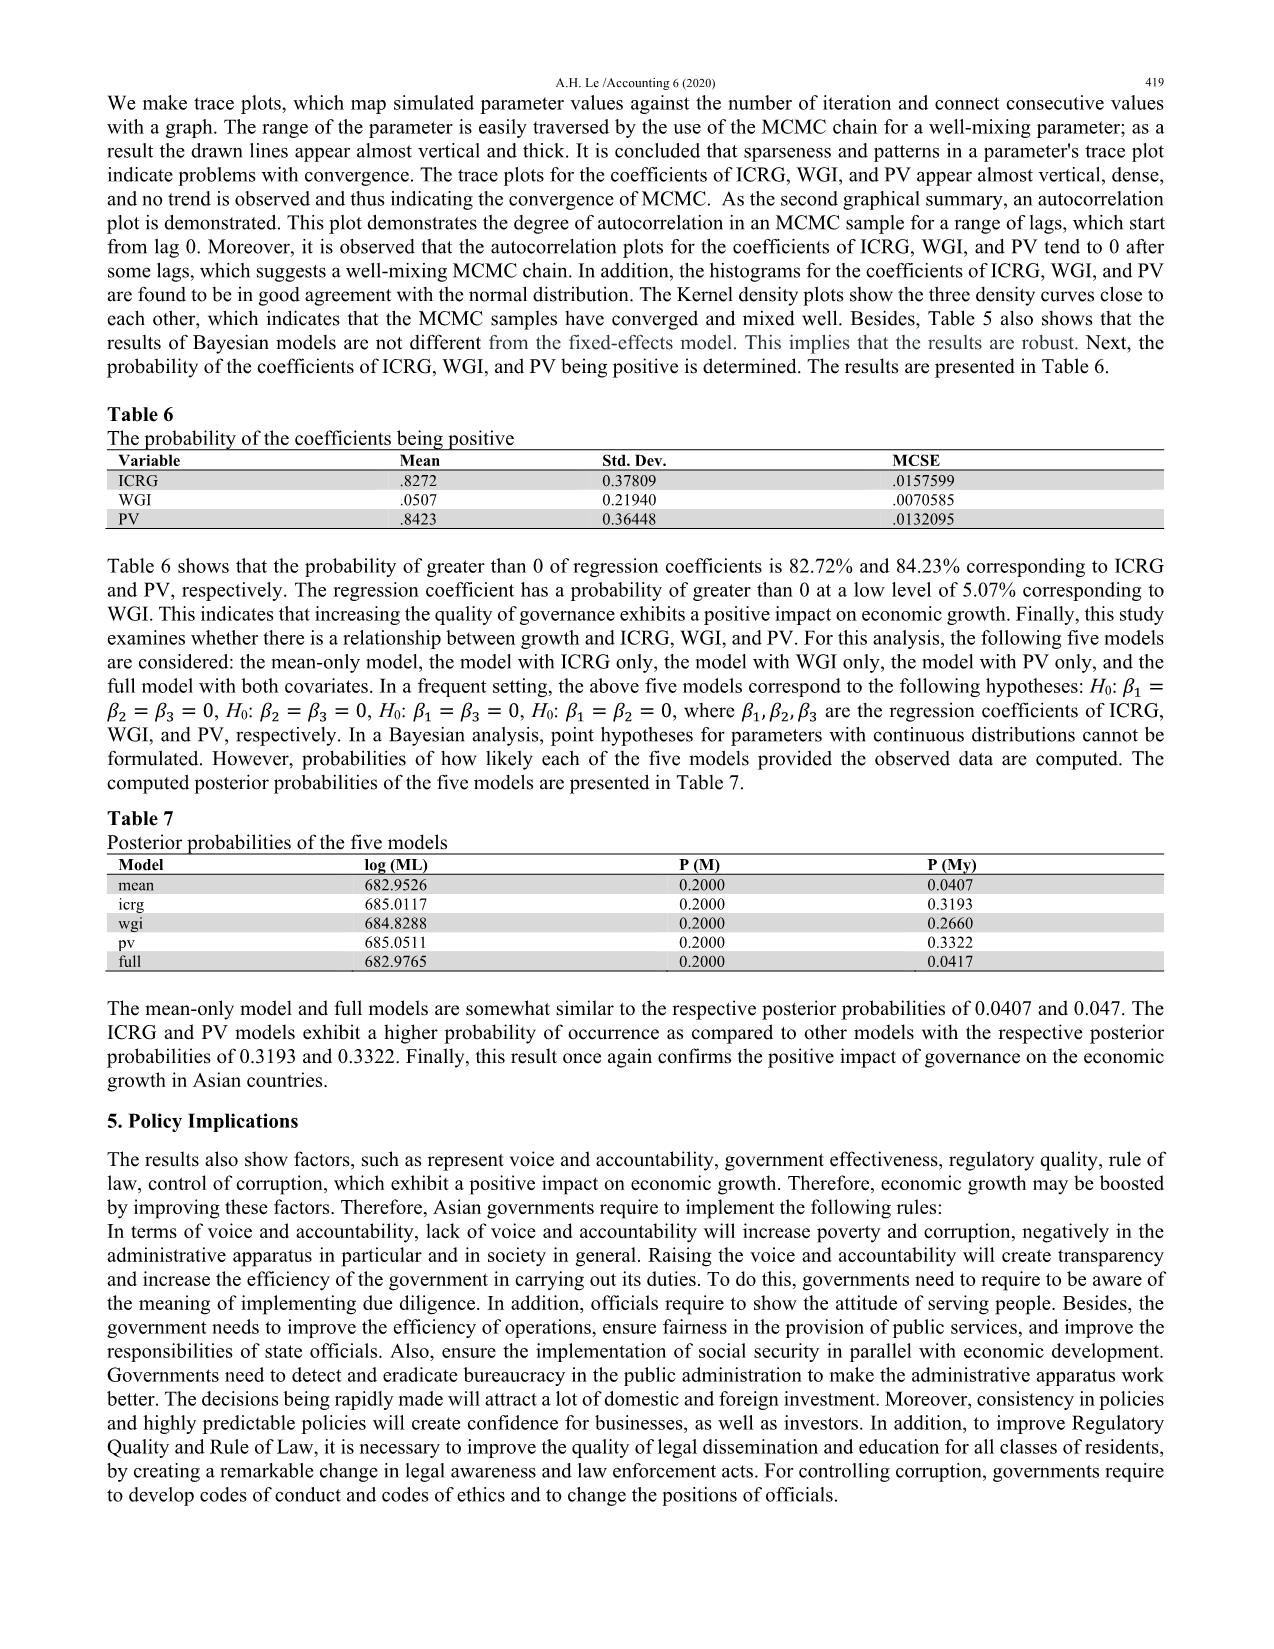
So we are testing the convergence of the MCMC. The findings are shown in Fig. 1.
Fig. 1. The MCMC convergence
A.H. Le /Accounting 6 (2020) 419
We make trace plots, which map simulated parameter values against the number of iteration and connect consecutive values
with a graph. The range of the parameter is easily traversed by the use of the MCMC chain for a well-mixing parameter; as a
result the drawn lines appear almost vertical and thick. It is concluded that sparseness and patterns in a parameter's trace plot
indicate problems with convergence. The trace plots for the coefficients of ICRG, WGI, and PV appear almost vertical, dense,
and no trend is observed and thus indicating the convergence of MCMC. As the second graphical summary, an autocorrelation
plot is demonstrated. This plot demonstrates the degree of autocorrelation in an MCMC sample for a range of lags, which start
from lag 0. Moreover, it is observed that the autocorrelation plots for the coefficients of ICRG, WGI, and PV tend to 0 after
some lags, which suggests a well-mixing MCMC chain. In addition, the histograms for the coefficients of ICRG, WGI, and PV
are found to be in good agreement with the normal distribution. The Kernel density plots show the three density curves close to
each other, which indicates that the MCMC samples have converged and mixed well. Besides, Table 5 also shows that the
results of Bayesian models are not different from the fixed-effects model. This implies that the results are robust. Next, the
probability of the coefficients of ICRG, WGI, and PV being positive is determined. The results are presented in Table 6.
Table 6
The probability of the coefficients being positive
Variable Mean Std. Dev. MCSE
ICRG .8272 0.37809 .0157599
WGI .0507 0.21940 .0070585
PV .8423 0.36448 .0132095
Table 6 shows that the probability of greater than 0 of regression coefficients is 82.72% and 84.23% corresponding to ICRG
and PV, respectively. The regression coefficient has a probability of greater than 0 at a low level of 5.07% corresponding to
WGI. This indicates that increasing the quality of governance exhibits a positive impact on economic growth. Finally, this study
examines whether there is a relationship between growth and ICRG, WGI, and PV. For this analysis, the following five models
are considered: the mean-only model, the model with ICRG only, the model with WGI only, the model with PV only, and the
full model with both covariates. In a frequent setting, the above five models correspond to the following hypotheses: H0: 𝛽ଵ =
𝛽ଶ = 𝛽ଷ = 0, H0: 𝛽ଶ = 𝛽ଷ = 0, H0: 𝛽ଵ = 𝛽ଷ = 0, H0: 𝛽ଵ = 𝛽ଶ = 0, where 𝛽ଵ,𝛽ଶ,𝛽ଷ are the regression coefficients of ICRG,
WGI, and PV, respectively. In a Bayesian analysis, point hypotheses for parameters with continuous distributions cannot be
formulated. However, probabilities of how likely each of the five models provided the observed data are computed. The
computed posterior probabilities of the five models are presented in Table 7.
Table 7
Posterior probabilities of the five models
Model log (ML) P (M) P (My)
mean 682.9526 0.2000 0.0407
icrg 685.0117 0.2000 0.3193
wgi 684.8288 0.2000 0.2660
pv 685.0511 0.2000 0.3322
full 682.9765 0.2000 0.0417
The mean-only model and full models are somewhat similar to the respective posterior probabilities of 0.0407 and 0.047. The
ICRG and PV models exhibit a higher probability of occurrence as compared to other models with the respective posterior
probabilities of 0.3193 and 0.3322. Finally, this result once again confirms the positive impact of governance on the economic
growth in Asian countries.
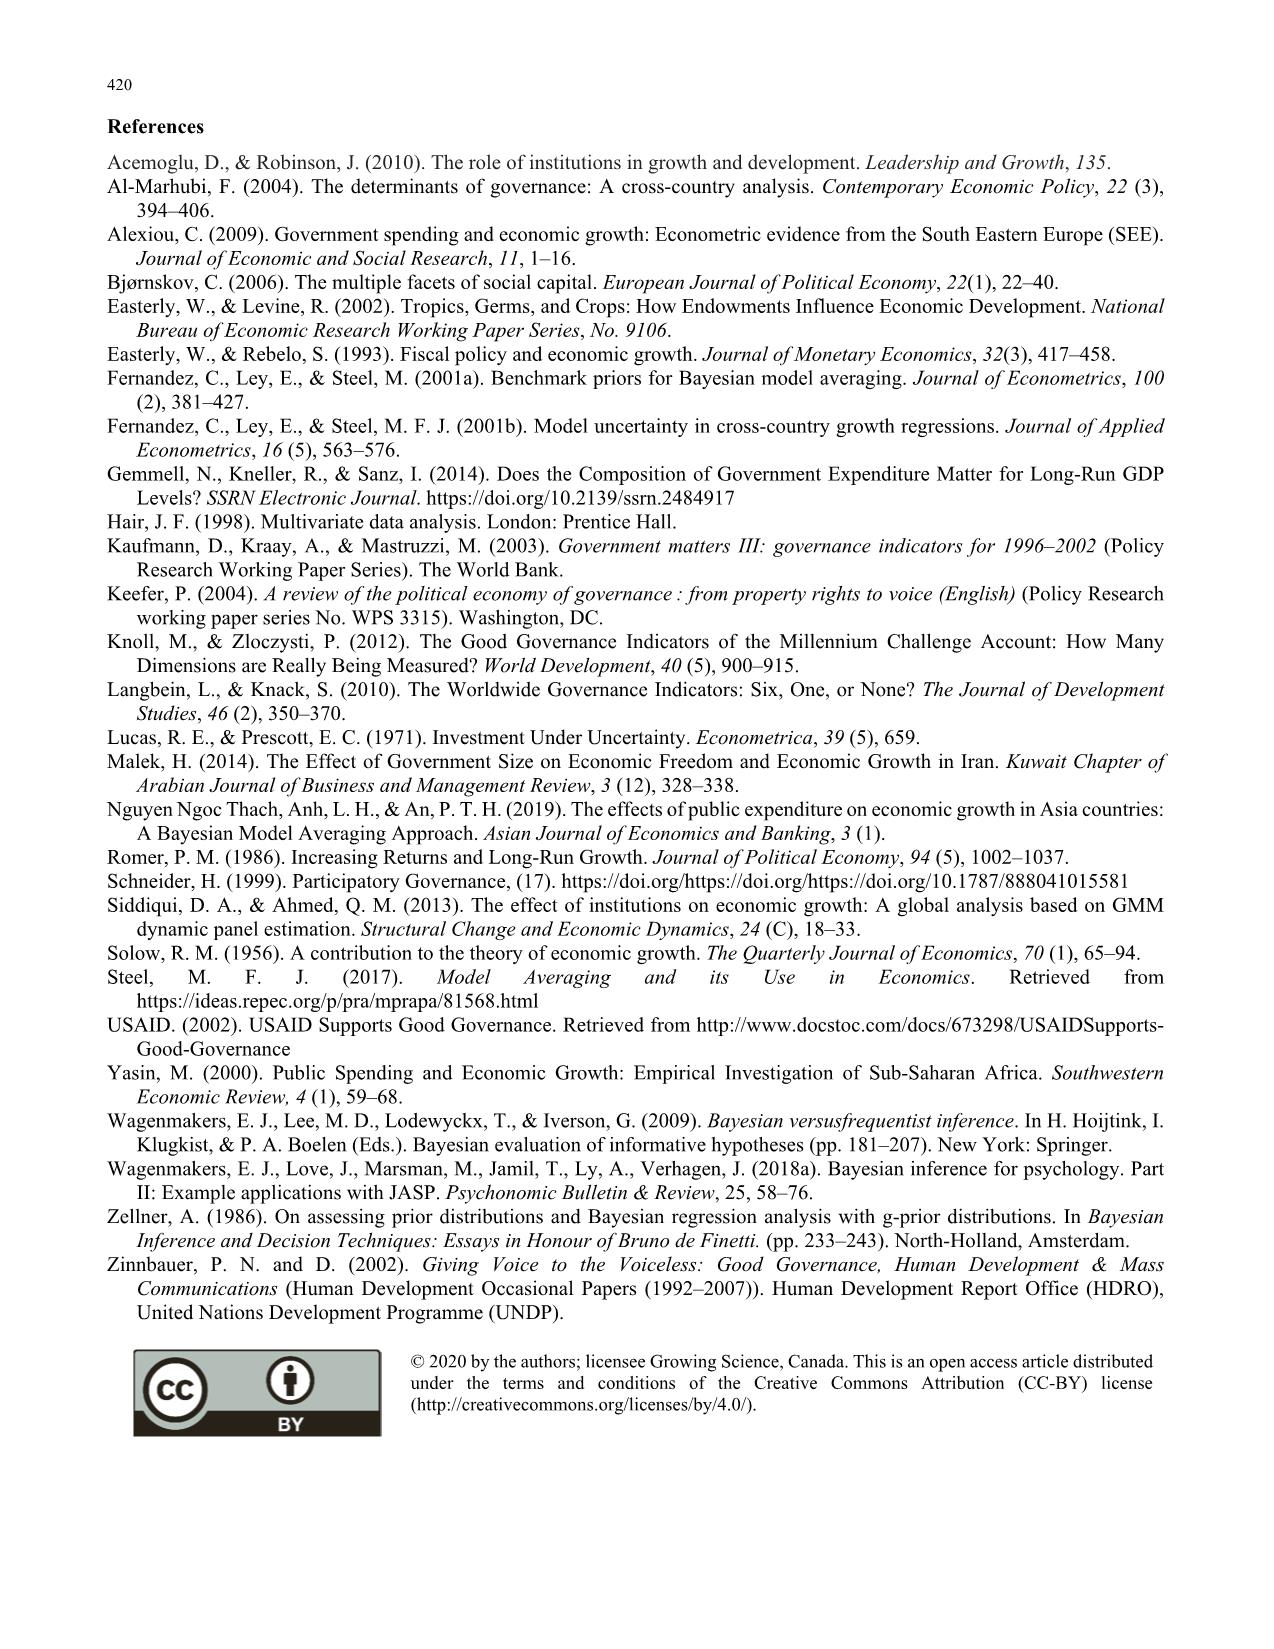
5. Policy Implications
The results also show factors, such as represent voice and accountability, government effectiveness, regulatory quality, rule of
law, control of corruption, which exhibit a positive impact on economic growth. Therefore, economic growth may be boosted
by improving these factors. Therefore, Asian governments require to implement the following rules:
In terms of voice and accountability, lack of voice and accountability will increase poverty and corruption, negatively in the
administrative apparatus in particular and in society in general. Raising the voice and accountability will create transparency
and increase the efficiency of the government in carrying out its duties. To do this, governments need to require to be aware of
the meaning of implementing due diligence. In addition, officials require to show the attitude of serving people. Besides, the
government needs to improve the efficiency of operations, ensure fairness in the provision of public services, and improve the
responsibilities of state officials. Also, ensure the implementation of social security in parallel with economic development.
Governments need to detect and eradicate bureaucracy in the public administration to make the administrative apparatus work
better. The decisions being rapidly made will attract a lot of domestic and foreign investment. Moreover, consistency in policies
and highly predictable policies will create confidence for businesses, as well as investors. In addition, to improve Regulatory
Quality and Rule of Law, it is necessary to improve the quality of legal dissemination and education for all classes of residents,
by creating a remarkable change in legal awareness and law enforcement acts. For controlling corruption, governments require
to develop codes of conduct and codes of ethics and to change the positions of officials.
 420
References
Acemoglu, D., & Robinson, J. (2010). The role of institutions in growth and development. Leadership and Growth, 135.
Al-Marhubi, F. (2004). The determinants of governance: A cross-country analysis. Contemporary Economic Policy, 22 (3),
394–406.
Alexiou, C. (2009). Government spending and economic growth: Econometric evidence from the South Eastern Europe (SEE).
Journal of Economic and Social Research, 11, 1–16.
Bjørnskov, C. (2006). The multiple facets of social capital. European Journal of Political Economy, 22(1), 22–40.
Easterly, W., & Levine, R. (2002). Tropics, Germs, and Crops: How Endowments Influence Economic Development. National
Bureau of Economic Research Working Paper Series, No. 9106.
Easterly, W., & Rebelo, S. (1993). Fiscal policy and economic growth. Journal of Monetary Economics, 32(3), 417–458.
Fernandez, C., Ley, E., & Steel, M. (2001a). Benchmark priors for Bayesian model averaging. Journal of Econometrics, 100
(2), 381–427.
Fernandez, C., Ley, E., & Steel, M. F. J. (2001b). Model uncertainty in cross-country growth regressions. Journal of Applied
Econometrics, 16 (5), 563–576.
Gemmell, N., Kneller, R., & Sanz, I. (2014). Does the Composition of Government Expenditure Matter for Long-Run GDP
Levels? SSRN Electronic Journal. https://doi.org/10.2139/ssrn.2484917
Hair, J. F. (1998). Multivariate data analysis. London: Prentice Hall.
Kaufmann, D., Kraay, A., & Mastruzzi, M. (2003). Government matters III: governance indicators for 1996–2002 (Policy
Research Working Paper Series). The World Bank.
Keefer, P. (2004). A review of the political economy of governance : from property rights to voice (English) (Policy Research
working paper series No. WPS 3315). Washington, DC.
Knoll, M., & Zloczysti, P. (2012). The Good Governance Indicators of the Millennium Challenge Account: How Many
Dimensions are Really Being Measured? World Development, 40 (5), 900–915.
Langbein, L., & Knack, S. (2010). The Worldwide Governance Indicators: Six, One, or None? The Journal of Development
Studies, 46 (2), 350–370.
Lucas, R. E., & Prescott, E. C. (1971). Investment Under Uncertainty. Econometrica, 39 (5), 659.
Malek, H. (2014). The Effect of Government Size on Economic Freedom and Economic Growth in Iran. Kuwait Chapter of
Arabian Journal of Business and Management Review, 3 (12), 328–338.
Nguyen Ngoc Thach, Anh, L. H., & An, P. T. H. (2019). The effects of public expenditure on economic growth in Asia countries:
A Bayesian Model Averaging Approach. Asian Journal of Economics and Banking, 3 (1).
Romer, P. M. (1986). Increasing Returns and Long-Run Growth. Journal of Political Economy, 94 (5), 1002–1037.
Schneider, H. (1999). Participatory Governance, (17). https://doi.org/https://doi.org/https://doi.org/10.1787/888041015581
Siddiqui, D. A., & Ahmed, Q. M. (2013). The effect of institutions on economic growth: A global analysis based on GMM
dynamic panel estimation. Structural Change and Economic Dynamics, 24 (C), 18–33.
Solow, R. M. (1956). A contribution to the theory of economic growth. The Quarterly Journal of Economics, 70 (1), 65–94.
Steel, M. F. J. (2017). Model Averaging and its Use in Economics. Retrieved from
https://ideas.repec.org/p/pra/mprapa/81568.html
USAID. (2002). USAID Supports Good Governance. Retrieved from
Good-Governance
Yasin, M. (2000). Public Spending and Economic Growth: Empirical Investigation of Sub-Saharan Africa. Southwestern
Economic Review, 4 (1), 59–68.
Wagenmakers, E. J., Lee, M. D., Lodewyckx, T., & Iverson, G. (2009). Bayesian versusfrequentist inference. In H. Hoijtink, I.
Klugkist, & P. A. Boelen (Eds.). Bayesian evaluation of informative hypotheses (pp. 181–207). New York: Springer.
Wagenmakers, E. J., Love, J., Marsman, M., Jamil, T., Ly, A., Verhagen, J. (2018a). Bayesian inference for psychology. Part
II: Example applications with JASP. Psychonomic Bulletin & Review, 25, 58–76.
Zellner, A. (1986). On assessing prior distributions and Bayesian regression analysis with g-prior distributions. In Bayesian
Inference and Decision Techniques: Essays in Honour of Bruno de Finetti. (pp. 233–243). North-Holland, Amsterdam.
Zinnbauer, P. N. and D. (2002). Giving Voice to the Voiceless: Good Governance, Human Development & Mass
Communications (Human Development Occasional Papers (1992–2007)). Human Development Report Office (HDRO),
United Nations Development Programme (UNDP).
© 2020 by the authors; licensee Growing Science, Canada. This is an open access article distributed
under the terms and conditions of the Creative Commons Attribution (CC-BY) license
(
File đính kèm:
 the_governance_quality_growth_nexus_revisited_a_new_evidence.pdf

