Short-and long-term effects of GDP, energy consumption, FDI, and trade openness on CO2 emissions
This research applies a Vector error correction model to investigate the long-Run and short-run effects of gross domestic product (GDP), energy consumption, foreign direct investment (FDI), and trade openness on CO2 emissions. The findings indicate that in the long run, GDP growth per capita has a negative influence on CO2 emission. Energy consumption and trade openness negatively affect CO2 emission. The foreign direct investment as the percentage of GDP in a long time has a positive relationship with CO2 emission. Furthermore, the short-run GDP per capita affects CO2 emission with two-year lags and energy consumption influences CO2 emission with a one-year lag. These observations have many implications for policy-makers in issuing the FDI policy in Vietnam in recent times and considering the impact of economic development on protecting the sustainable growth in the long-run
Trang 1
Trang 2
Trang 3
Trang 4
Trang 5
Trang 6
Trang 7
Trang 8
Tóm tắt nội dung tài liệu: Short-and long-term effects of GDP, energy consumption, FDI, and trade openness on CO2 emissions
tion model, the coefficient of ΔLnGDPt-2 is significant at the
10% level, which means that in the short-run GDP per capita affects CO2 emission with two-year lags.
T. V. T. Do and H. L. Dinh /Accounting 6 (2020) 369
Table 5
The estimated results of Vector error correction model
Dependent variable: LnCO2
 Coeficient P_value
Error Correction -0.6116*** 0.0026
ΔLnCO2t-1 -0.0544 0.8091
ΔLnCO2t-2 0.2097 0.3791
ΔLnGDPt-1 -0.3863 0.2647
ΔLnGDPt-2 0.5057* 0.0840
ΔLnECt-1 1.2945* 0.0531
ΔLnECt-2 0.2075 0.7574
ΔFDIt-1 -0.1278 0.8897
ΔFDIt-2 0.7147 0.5175
ΔTOt-1 0.1518 0.4463
ΔTOt-2 -0.1338 0.4444
Constant -0.0160 0.7489
 R-squared 0.6810
*, **, and *** denotes significance at 10%, 5%, and 1% level, respectively.
At the same time, the coefficient of ΔLnECt-1 is significant at the 10% level, indicating that in the short run, energy consumption
influences CO2 emission with a one-year lag. This result specifies that if energy consumption rises by 1% in the current year,
then it will contribute to the increase in CO2 emission by 1.2945% next year. These results confirm previous findings in the
literature of He and Richard (2010), Hamit-Haggar (2012), and Govindaraju and Tang (2013). Likewise, this study conducts
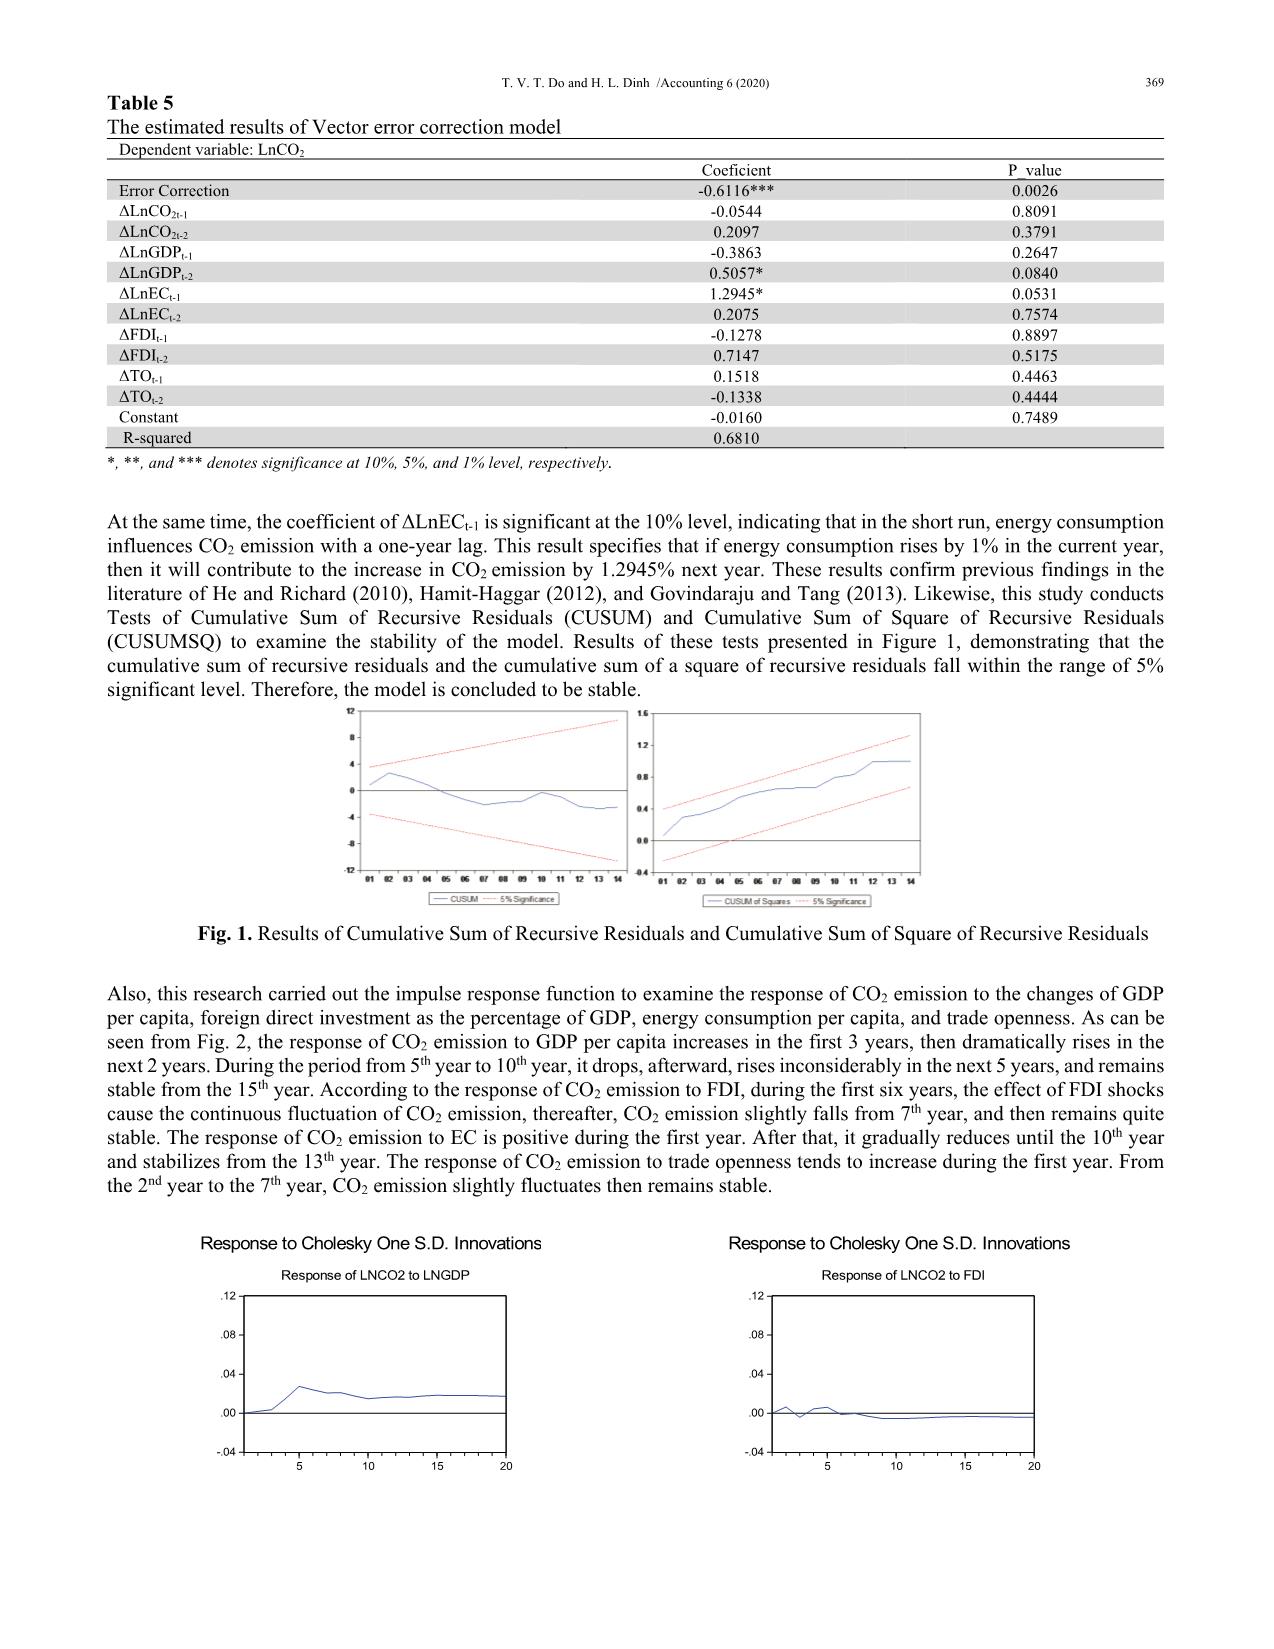
Tests of Cumulative Sum of Recursive Residuals (CUSUM) and Cumulative Sum of Square of Recursive Residuals
(CUSUMSQ) to examine the stability of the model. Results of these tests presented in Figure 1, demonstrating that the
cumulative sum of recursive residuals and the cumulative sum of a square of recursive residuals fall within the range of 5%
significant level. Therefore, the model is concluded to be stable.
Fig. 1. Results of Cumulative Sum of Recursive Residuals and Cumulative Sum of Square of Recursive Residuals
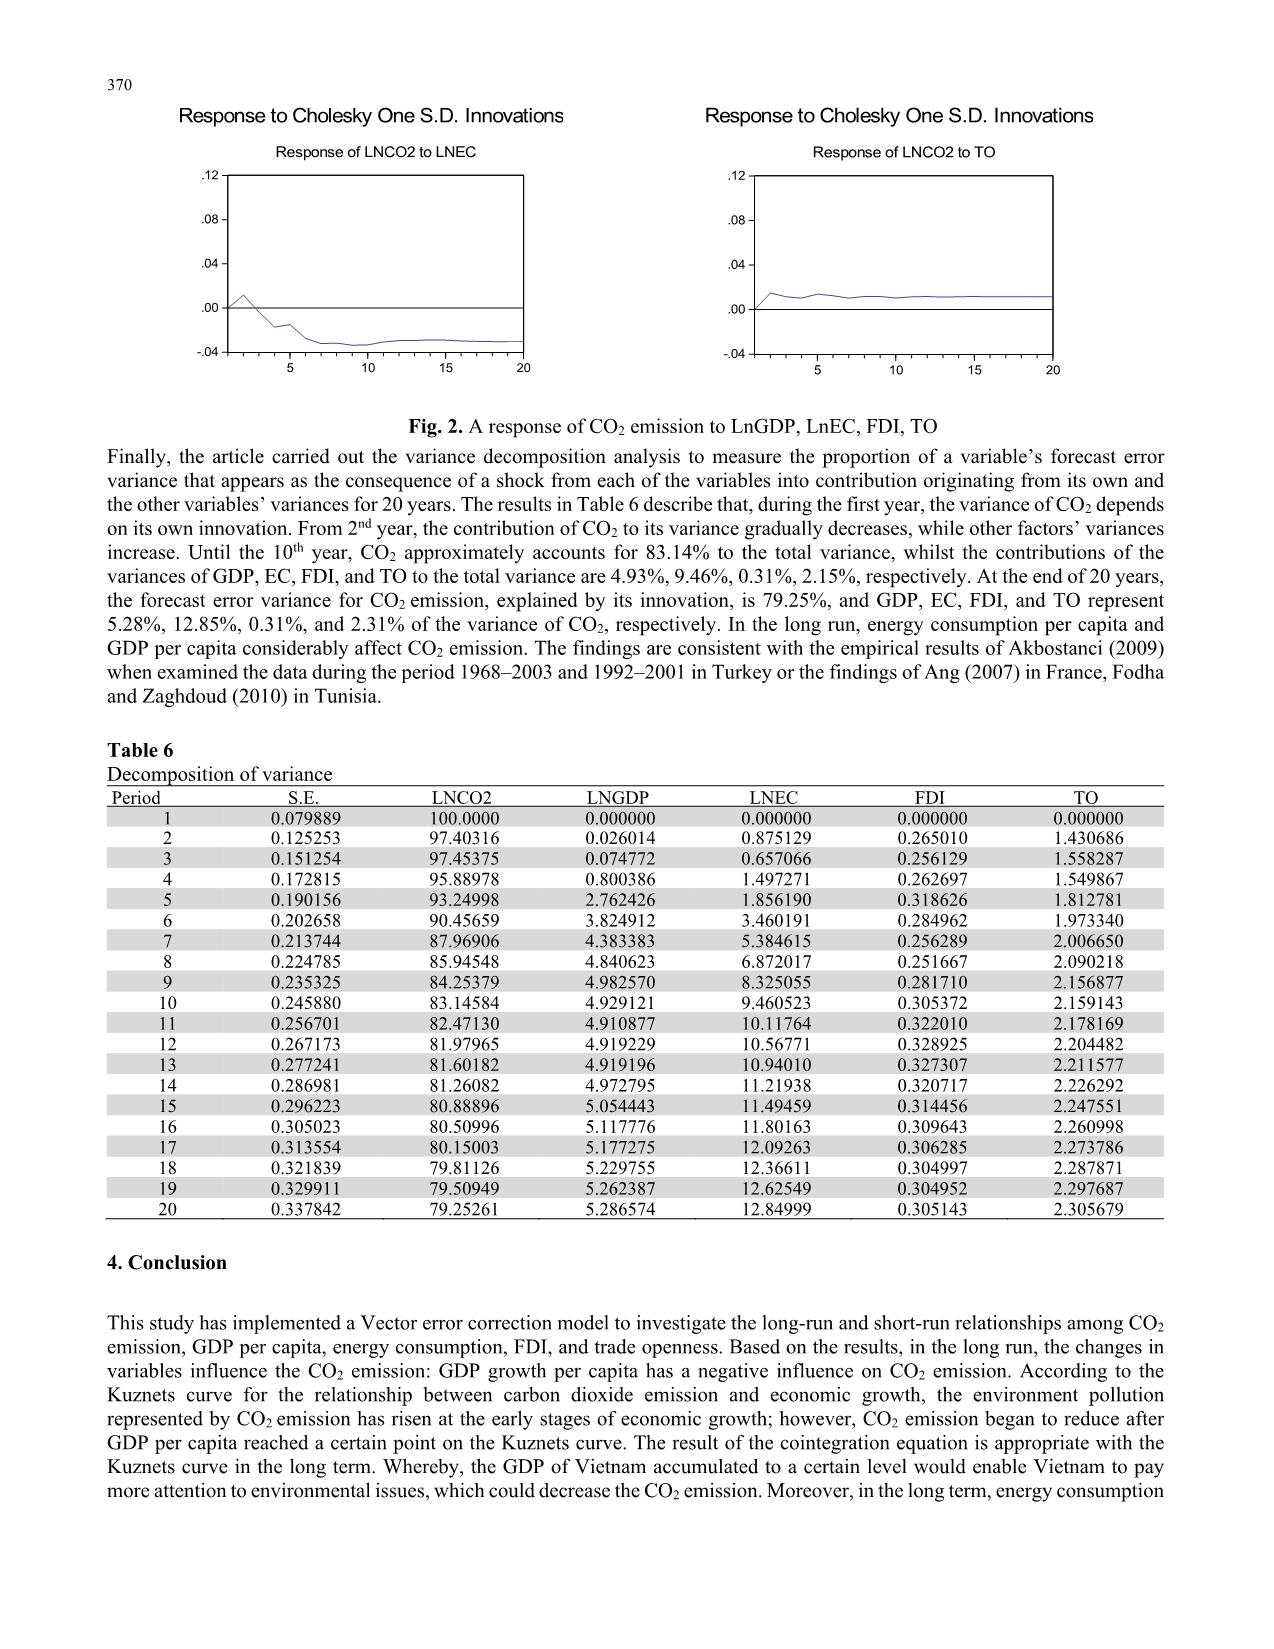
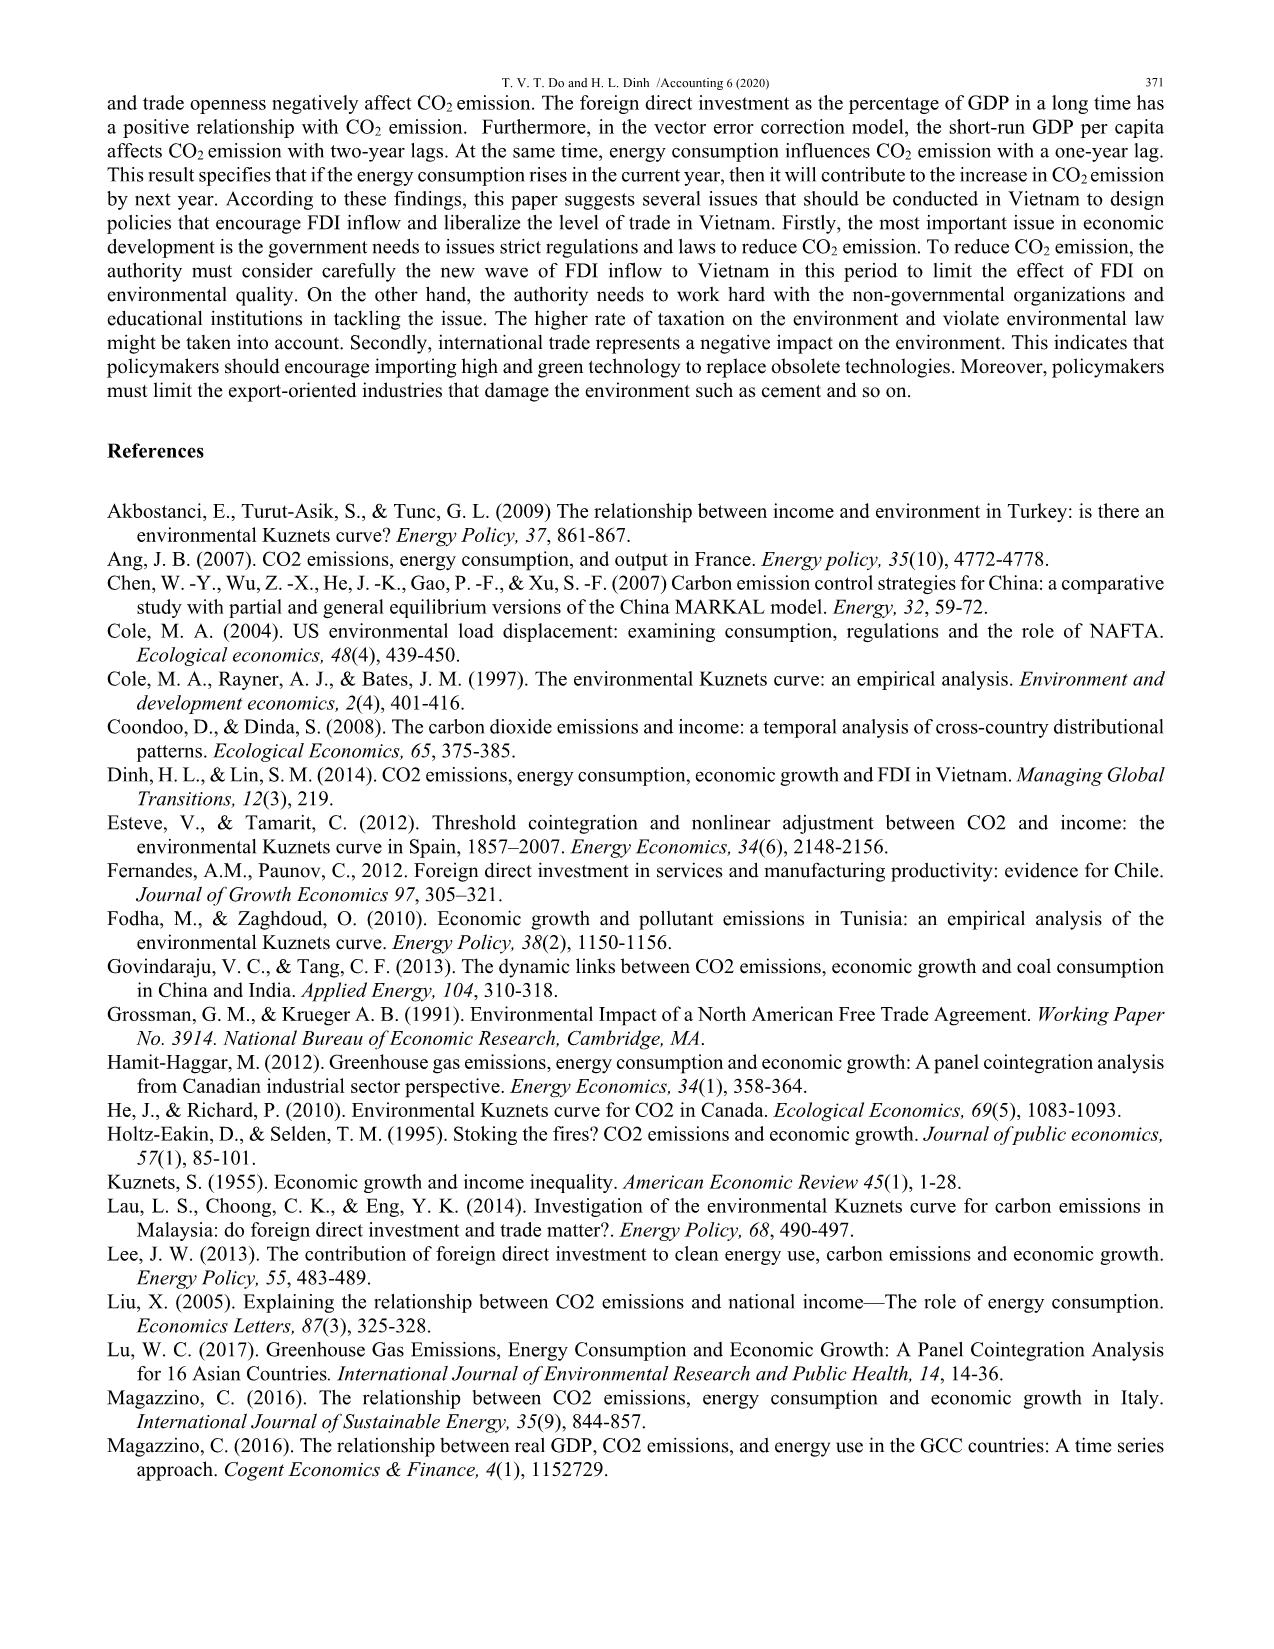
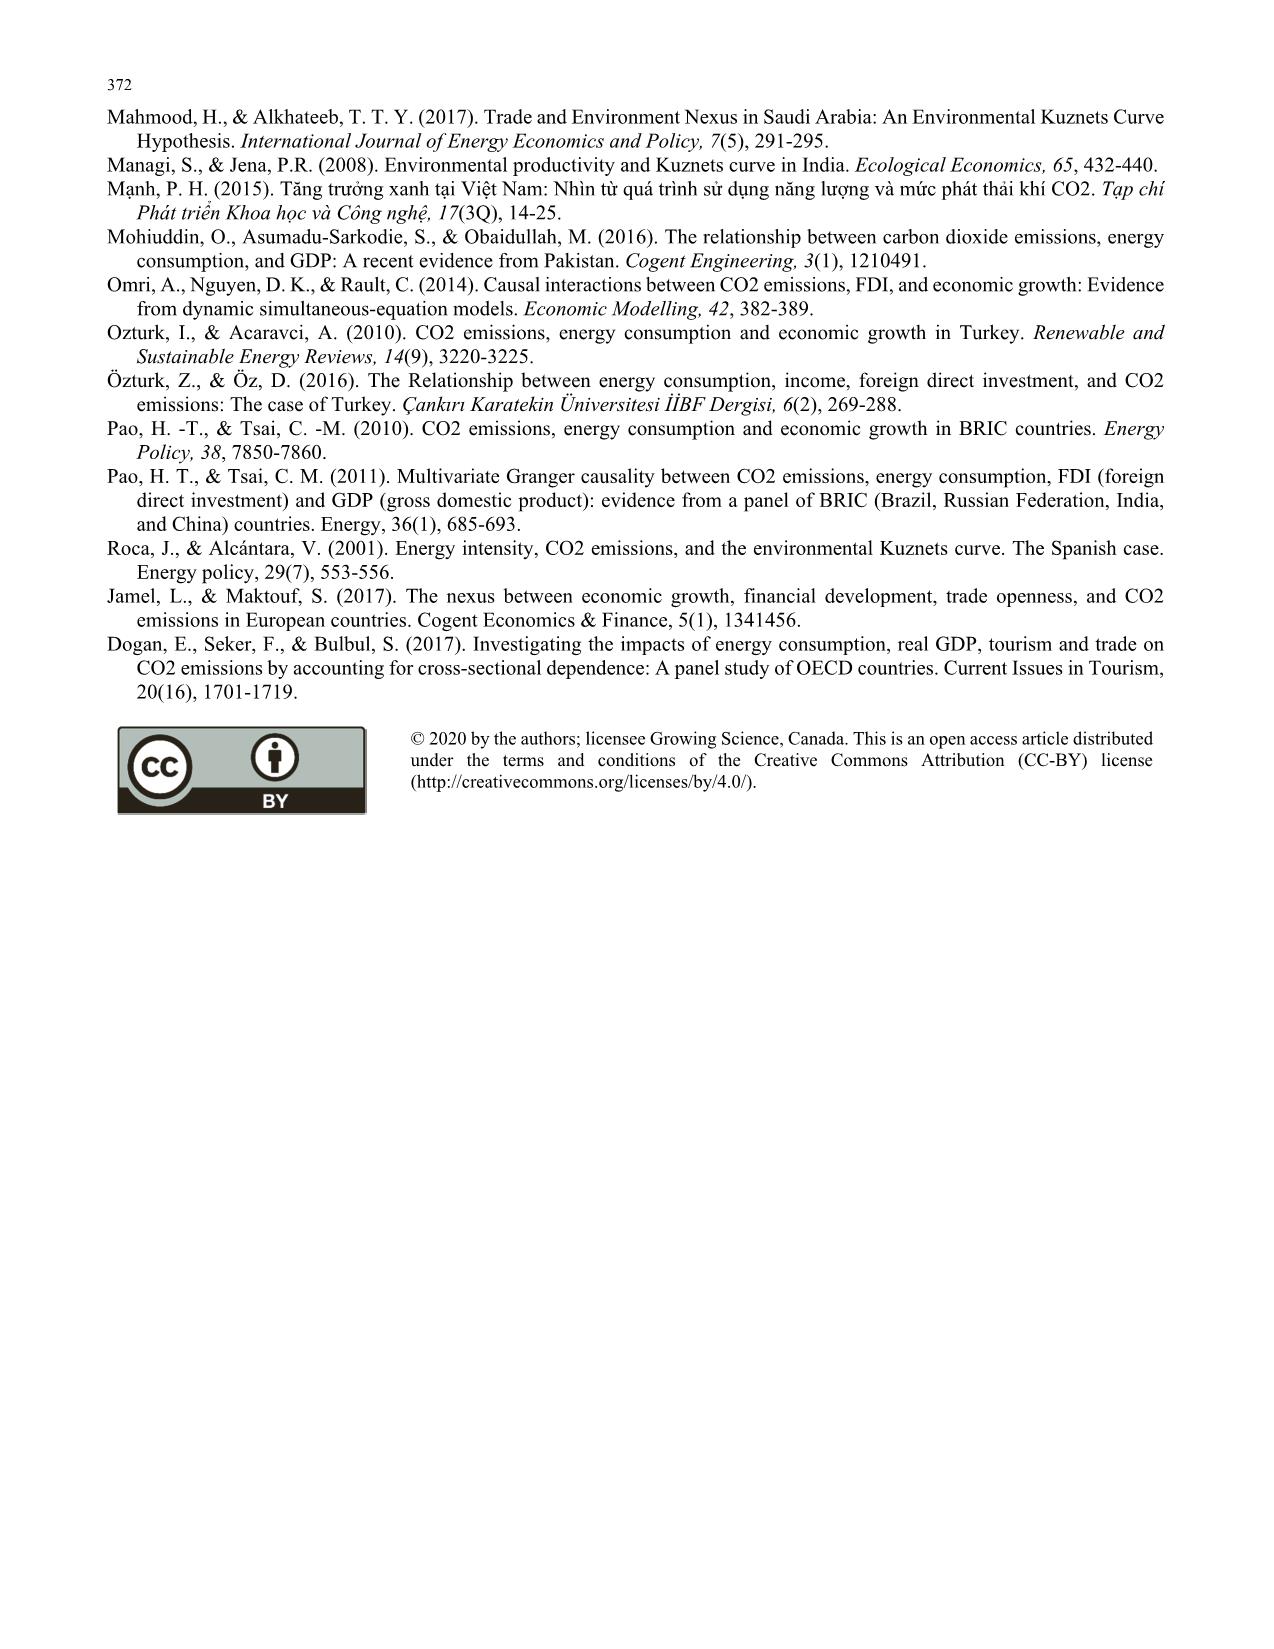
Also, this research carried out the impulse response function to examine the response of CO2 emission to the changes of GDP
per capita, foreign direct investment as the percentage of GDP, energy consumption per capita, and trade openness. As can be
seen from Fig. 2, the response of CO2 emission to GDP per capita increases in the first 3 years, then dramatically rises in the
next 2 years. During the period from 5th year to 10th year, it drops, afterward, rises inconsiderably in the next 5 years, and remains
stable from the 15th year. According to the response of CO2 emission to FDI, during the first six years, the effect of FDI shocks
cause the continuous fluctuation of CO2 emission, thereafter, CO2 emission slightly falls from 7th year, and then remains quite
stable. The response of CO2 emission to EC is positive during the first year. After that, it gradually reduces until the 10th year
and stabilizes from the 13th year. The response of CO2 emission to trade openness tends to increase during the first year. From
the 2nd year to the 7th year, CO2 emission slightly fluctuates then remains stable.
-.04
.00
.04
.08
.12
5 10 15 20
Response of LNCO2 to LNGDP
Response to Cholesky One S.D. Innovations
-.04
.00
.04
.08
.12
5 10 15 20
Response of LNCO2 to FDI
Response to Cholesky One S.D. Innovations
 370
-.04
.00
.04
.08
.12
5 10 15 20
Response of LNCO2 to TO
Response to Cholesky One S.D. Innovations
Fig. 2. A response of CO2 emission to LnGDP, LnEC, FDI, TO
Finally, the article carried out the variance decomposition analysis to measure the proportion of a variable’s forecast error
variance that appears as the consequence of a shock from each of the variables into contribution originating from its own and
the other variables’ variances for 20 years. The results in Table 6 describe that, during the first year, the variance of CO2 depends
on its own innovation. From 2nd year, the contribution of CO2 to its variance gradually decreases, while other factors’ variances
increase. Until the 10th year, CO2 approximately accounts for 83.14% to the total variance, whilst the contributions of the
variances of GDP, EC, FDI, and TO to the total variance are 4.93%, 9.46%, 0.31%, 2.15%, respectively. At the end of 20 years,
the forecast error variance for CO2 emission, explained by its innovation, is 79.25%, and GDP, EC, FDI, and TO represent
5.28%, 12.85%, 0.31%, and 2.31% of the variance of CO2, respectively. In the long run, energy consumption per capita and
GDP per capita considerably affect CO2 emission. The findings are consistent with the empirical results of Akbostanci (2009)
when examined the data during the period 1968–2003 and 1992–2001 in Turkey or the findings of Ang (2007) in France, Fodha
and Zaghdoud (2010) in Tunisia.
Table 6
Decomposition of variance
 Period S.E. LNCO2 LNGDP LNEC FDI TO
 1 0.079889 100.0000 0.000000 0.000000 0.000000 0.000000
 2 0.125253 97.40316 0.026014 0.875129 0.265010 1.430686
 3 0.151254 97.45375 0.074772 0.657066 0.256129 1.558287
 4 0.172815 95.88978 0.800386 1.497271 0.262697 1.549867
 5 0.190156 93.24998 2.762426 1.856190 0.318626 1.812781
 6 0.202658 90.45659 3.824912 3.460191 0.284962 1.973340
 7 0.213744 87.96906 4.383383 5.384615 0.256289 2.006650
 8 0.224785 85.94548 4.840623 6.872017 0.251667 2.090218
 9 0.235325 84.25379 4.982570 8.325055 0.281710 2.156877
 10 0.245880 83.14584 4.929121 9.460523 0.305372 2.159143
 11 0.256701 82.47130 4.910877 10.11764 0.322010 2.178169
 12 0.267173 81.97965 4.919229 10.56771 0.328925 2.204482
 13 0.277241 81.60182 4.919196 10.94010 0.327307 2.211577
 14 0.286981 81.26082 4.972795 11.21938 0.320717 2.226292
 15 0.296223 80.88896 5.054443 11.49459 0.314456 2.247551
 16 0.305023 80.50996 5.117776 11.80163 0.309643 2.260998
 17 0.313554 80.15003 5.177275 12.09263 0.306285 2.273786
 18 0.321839 79.81126 5.229755 12.36611 0.304997 2.287871
 19 0.329911 79.50949 5.262387 12.62549 0.304952 2.297687
 20 0.337842 79.25261 5.286574 12.84999 0.305143 2.305679
4. Conclusion
This study has implemented a Vector error correction model to investigate the long-run and short-run relationships among CO2
emission, GDP per capita, energy consumption, FDI, and trade openness. Based on the results, in the long run, the changes in
variables influence the CO2 emission: GDP growth per capita has a negative influence on CO2 emission. According to the
Kuznets curve for the relationship between carbon dioxide emission and economic growth, the environment pollution
represented by CO2 emission has risen at the early stages of economic growth; however, CO2 emission began to reduce after
GDP per capita reached a certain point on the Kuznets curve. The result of the cointegration equation is appropriate with the
Kuznets curve in the long term. Whereby, the GDP of Vietnam accumulated to a certain level would enable Vietnam to pay
more attention to environmental issues, which could decrease the CO2 emission. Moreover, in the long term, energy consumption
-.04
.00
.04
.08
.12
5 10 15 20
Response of LNCO2 to LNEC
Response to Cholesky One S.D. Innovations
T. V. T. Do and H. L. Dinh /Accounting 6 (2020) 371
and trade openness negatively affect CO2 emission. The foreign direct investment as the percentage of GDP in a long time has
a positive relationship with CO2 emission. Furthermore, in the vector error correction model, the short-run GDP per capita
affects CO2 emission with two-year lags. At the same time, energy consumption influences CO2 emission with a one-year lag.
This result specifies that if the energy consumption rises in the current year, then it will contribute to the increase in CO2 emission
by next year. According to these findings, this paper suggests several issues that should be conducted in Vietnam to design
policies that encourage FDI inflow and liberalize the level of trade in Vietnam. Firstly, the most important issue in economic
development is the government needs to issues strict regulations and laws to reduce CO2 emission. To reduce CO2 emission, the
authority must consider carefully the new wave of FDI inflow to Vietnam in this period to limit the effect of FDI on
environmental quality. On the other hand, the authority needs to work hard with the non-governmental organizations and
educational institutions in tackling the issue. The higher rate of taxation on the environment and violate environmental law
might be taken into account. Secondly, international trade represents a negative impact on the environment. This indicates that
policymakers should encourage importing high and green technology to replace obsolete technologies. Moreover, policymakers
must limit the export-oriented industries that damage the environment such as cement and so on.
References
Akbostanci, E., Turut-Asik, S., & Tunc, G. L. (2009) The relationship between income and environment in Turkey: is there an
environmental Kuznets curve? Energy Policy, 37, 861-867.
Ang, J. B. (2007). CO2 emissions, energy consumption, and output in France. Energy policy, 35(10), 4772-4778.
Chen, W. -Y., Wu, Z. -X., He, J. -K., Gao, P. -F., & Xu, S. -F. (2007) Carbon emission control strategies for China: a comparative
study with partial and general equilibrium versions of the China MARKAL model. Energy, 32, 59-72.
Cole, M. A. (2004). US environmental load displacement: examining consumption, regulations and the role of NAFTA.
Ecological economics, 48(4), 439-450.
Cole, M. A., Rayner, A. J., & Bates, J. M. (1997). The environmental Kuznets curve: an empirical analysis. Environment and
development economics, 2(4), 401-416.
Coondoo, D., & Dinda, S. (2008). The carbon dioxide emissions and income: a temporal analysis of cross-country distributional
patterns. Ecological Economics, 65, 375-385.
Dinh, H. L., & Lin, S. M. (2014). CO2 emissions, energy consumption, economic growth and FDI in Vietnam. Managing Global
Transitions, 12(3), 219.
Esteve, V., & Tamarit, C. (2012). Threshold cointegration and nonlinear adjustment between CO2 and income: the
environmental Kuznets curve in Spain, 1857–2007. Energy Economics, 34(6), 2148-2156.
Fernandes, A.M., Paunov, C., 2012. Foreign direct investment in services and manufacturing productivity: evidence for Chile.
Journal of Growth Economics 97, 305–321.
Fodha, M., & Zaghdoud, O. (2010). Economic growth and pollutant emissions in Tunisia: an empirical analysis of the
environmental Kuznets curve. Energy Policy, 38(2), 1150-1156.
Govindaraju, V. C., & Tang, C. F. (2013). The dynamic links between CO2 emissions, economic growth and coal consumption
in China and India. Applied Energy, 104, 310-318.
Grossman, G. M., & Krueger A. B. (1991). Environmental Impact of a North American Free Trade Agreement. Working Paper
No. 3914. National Bureau of Economic Research, Cambridge, MA.
Hamit-Haggar, M. (2012). Greenhouse gas emissions, energy consumption and economic growth: A panel cointegration analysis
from Canadian industrial sector perspective. Energy Economics, 34(1), 358-364.
He, J., & Richard, P. (2010). Environmental Kuznets curve for CO2 in Canada. Ecological Economics, 69(5), 1083-1093.
Holtz-Eakin, D., & Selden, T. M. (1995). Stoking the fires? CO2 emissions and economic growth. Journal of public economics,
57(1), 85-101.
Kuznets, S. (1955). Economic growth and income inequality. American Economic Review 45(1), 1-28.
Lau, L. S., Choong, C. K., & Eng, Y. K. (2014). Investigation of the environmental Kuznets curve for carbon emissions in
Malaysia: do foreign direct investment and trade matter?. Energy Policy, 68, 490-497.
Lee, J. W. (2013). The contribution of foreign direct investment to clean energy use, carbon emissions and economic growth.
Energy Policy, 55, 483-489.
Liu, X. (2005). Explaining the relationship between CO2 emissions and national income—The role of energy consumption.
Economics Letters, 87(3), 325-328.
Lu, W. C. (2017). Greenhouse Gas Emissions, Energy Consumption and Economic Growth: A Panel Cointegration Analysis
for 16 Asian Countries. International Journal of Environmental Research and Public Health, 14, 14-36.
Magazzino, C. (2016). The relationship between CO2 emissions, energy consumption and economic growth in Italy.
International Journal of Sustainable Energy, 35(9), 844-857.
Magazzino, C. (2016). The relationship between real GDP, CO2 emissions, and energy use in the GCC countries: A time series
approach. Cogent Economics & Finance, 4(1), 1152729.
 372
Mahmood, H., & Alkhateeb, T. T. Y. (2017). Trade and Environment Nexus in Saudi Arabia: An Environmental Kuznets Curve
Hypothesis. International Journal of Energy Economics and Policy, 7(5), 291-295.
Managi, S., & Jena, P.R. (2008). Environmental productivity and Kuznets curve in India. Ecological Economics, 65, 432-440.
Mạnh, P. H. (2015). Tăng trưởng xanh tại Việt Nam: Nhìn từ quá trình sử dụng năng lượng và mức phát thải khí CO2. Tạp chí
Phát triển Khoa học và Công nghệ, 17(3Q), 14-25.
Mohiuddin, O., Asumadu-Sarkodie, S., & Obaidullah, M. (2016). The relationship between carbon dioxide emissions, energy
consumption, and GDP: A recent evidence from Pakistan. Cogent Engineering, 3(1), 1210491.
Omri, A., Nguyen, D. K., & Rault, C. (2014). Causal interactions between CO2 emissions, FDI, and economic growth: Evidence
from dynamic simultaneous-equation models. Economic Modelling, 42, 382-389.
Ozturk, I., & Acaravci, A. (2010). CO2 emissions, energy consumption and economic growth in Turkey. Renewable and
Sustainable Energy Reviews, 14(9), 3220-3225.
Özturk, Z., & Öz, D. (2016). The Relationship between energy consumption, income, foreign direct investment, and CO2
emissions: The case of Turkey. Çankırı Karatekin Üniversitesi İİBF Dergisi, 6(2), 269-288.
Pao, H. -T., & Tsai, C. -M. (2010). CO2 emissions, energy consumption and economic growth in BRIC countries. Energy
Policy, 38, 7850-7860.
Pao, H. T., & Tsai, C. M. (2011). Multivariate Granger causality between CO2 emissions, energy consumption, FDI (foreign
direct investment) and GDP (gross domestic product): evidence from a panel of BRIC (Brazil, Russian Federation, India,
and China) countries. Energy, 36(1), 685-693.
Roca, J., & Alcántara, V. (2001). Energy intensity, CO2 emissions, and the environmental Kuznets curve. The Spanish case.
Energy policy, 29(7), 553-556.
Jamel, L., & Maktouf, S. (2017). The nexus between economic growth, financial development, trade openness, and CO2
emissions in European countries. Cogent Economics & Finance, 5(1), 1341456.
Dogan, E., Seker, F., & Bulbul, S. (2017). Investigating the impacts of energy consumption, real GDP, tourism and trade on
CO2 emissions by accounting for cross-sectional dependence: A panel study of OECD countries. Current Issues in Tourism,
20(16), 1701-1719.
© 2020 by the authors; licensee Growing Science, Canada. This is an open access article distributed
under the terms and conditions of the Creative Commons Attribution (CC-BY) license
(
File đính kèm:
 short_and_long_term_effects_of_gdp_energy_consumption_fdi_an.pdf

