Performance analysis of the supercomputer based on raspberry Pi nodes
Abstract: In this paper, a new Raspberry PI supercomputer cluster architecture is proposed. Generally, to gain speed at petaflops and exaflops, typical modern supercomputers based on 2009-2018 computing technologies must consume between 6 MW and 20 MW of electrical power, almost all of which is converted into heat, requiring high cost for cooling technology and Cooling Towers. The management of heat density has remained a key issue for most centralized supercomputers. In our proposed architecture, supercomputers with highly energy-efficient mobile ARM processors are a new choice as it enables them to address performance, power, and cost issues. With ARM’s recent introduction of its energy-efficient 64-bit CPUs targeting servers, Raspberry Pi cluster module-based supercomputing is now within reach. But how is the performance of supercomputers-based mobile multicore processors? Obtained experimental results reported on the proposed approach indicate the lower electrical power and higher performance in comparison with the previous approaches
Trang 1
Trang 2
Trang 3
Trang 4
Trang 5
Trang 6
Trang 7
Trang 8
Trang 9
Trang 10
Tải về để xem bản đầy đủ
Tóm tắt nội dung tài liệu: Performance analysis of the supercomputer based on raspberry Pi nodes
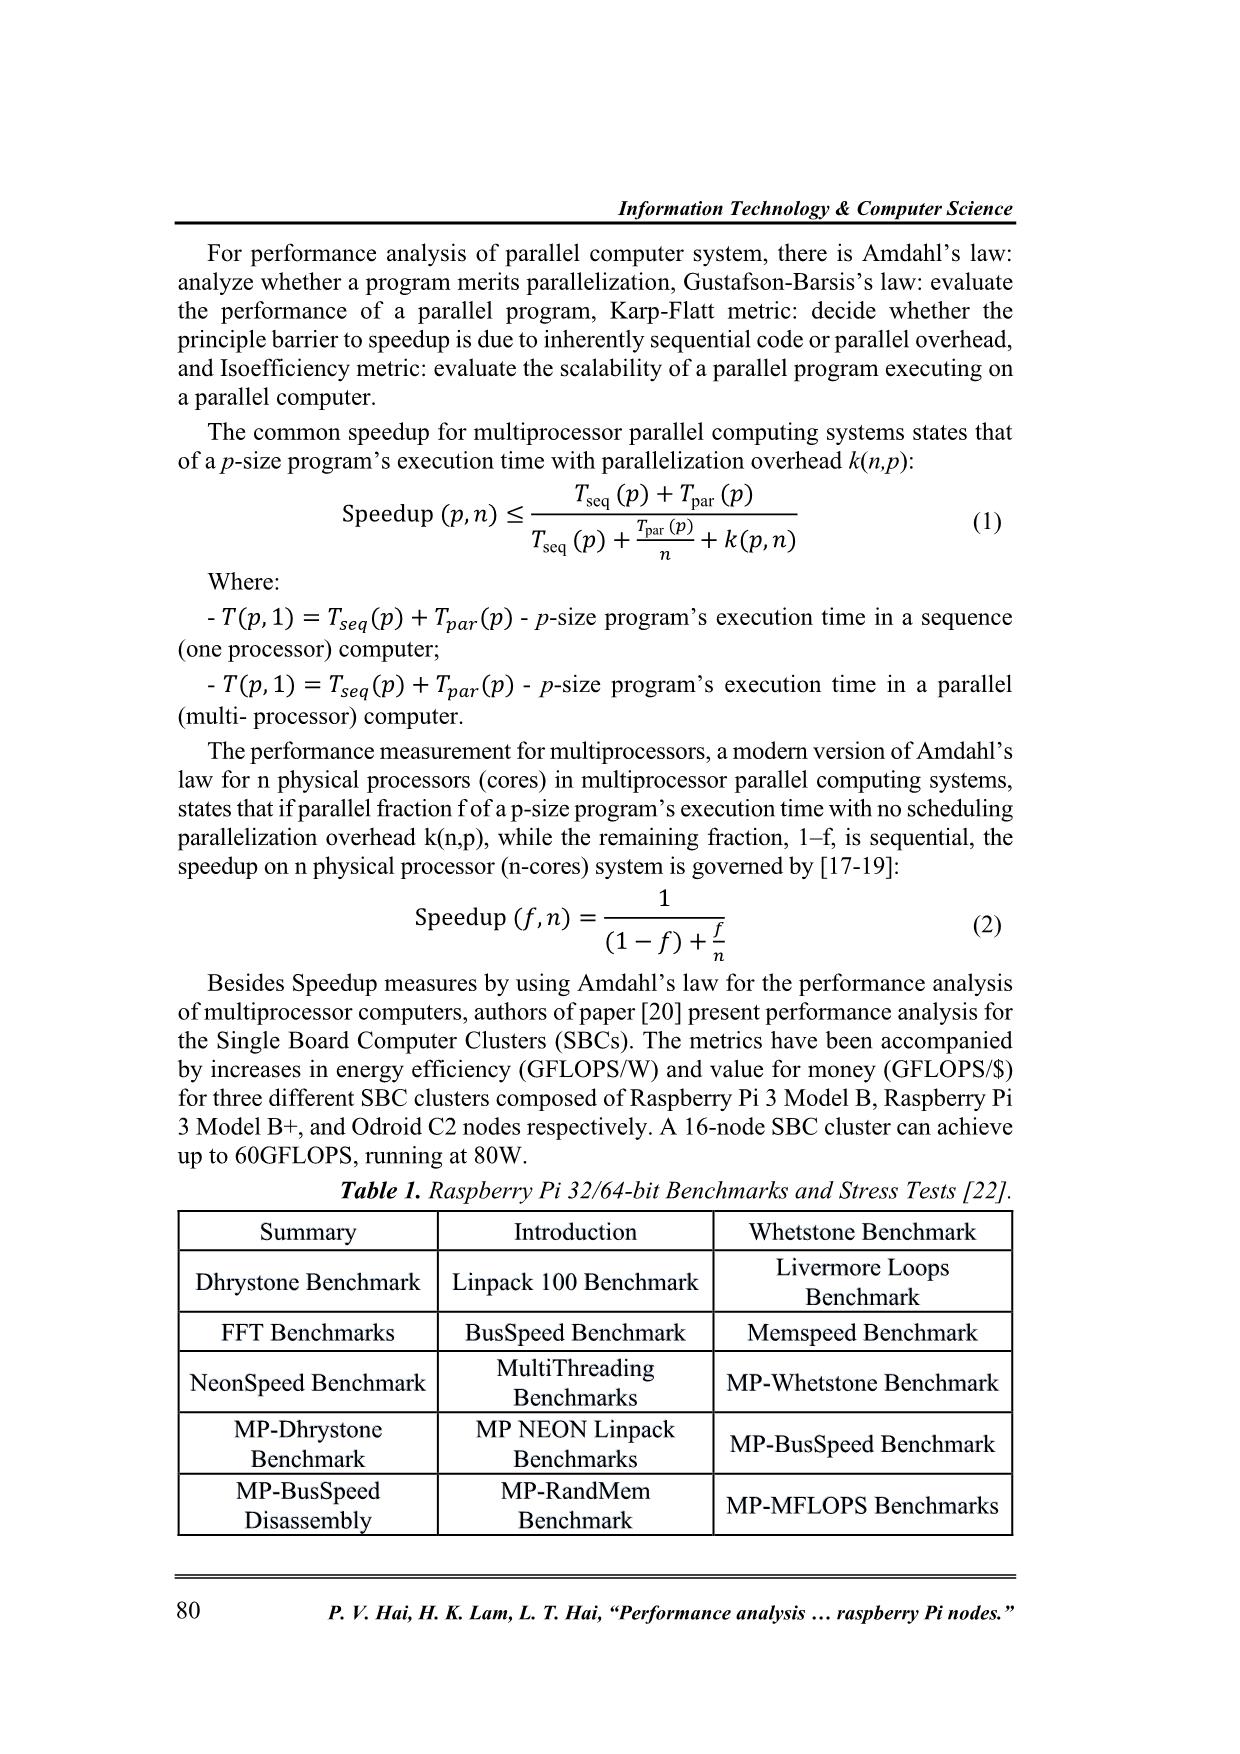
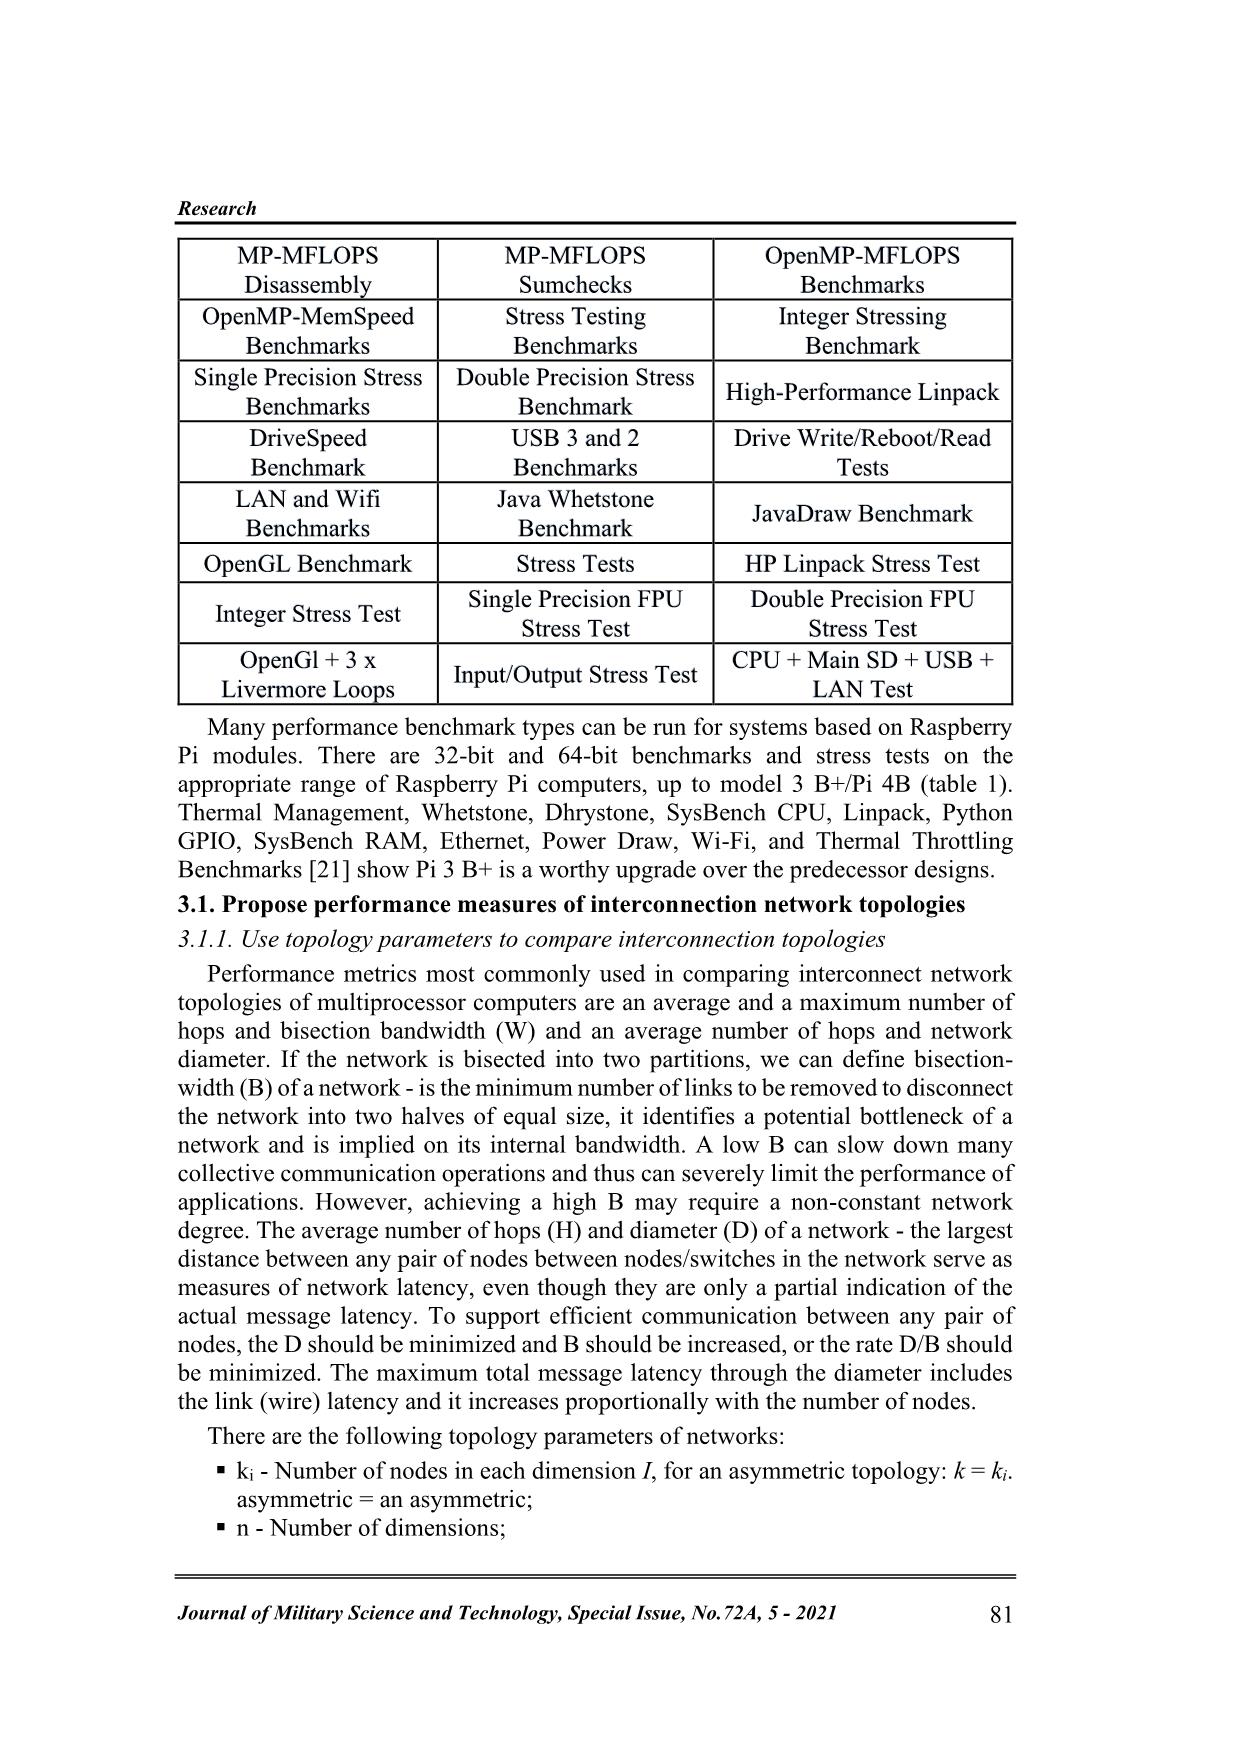
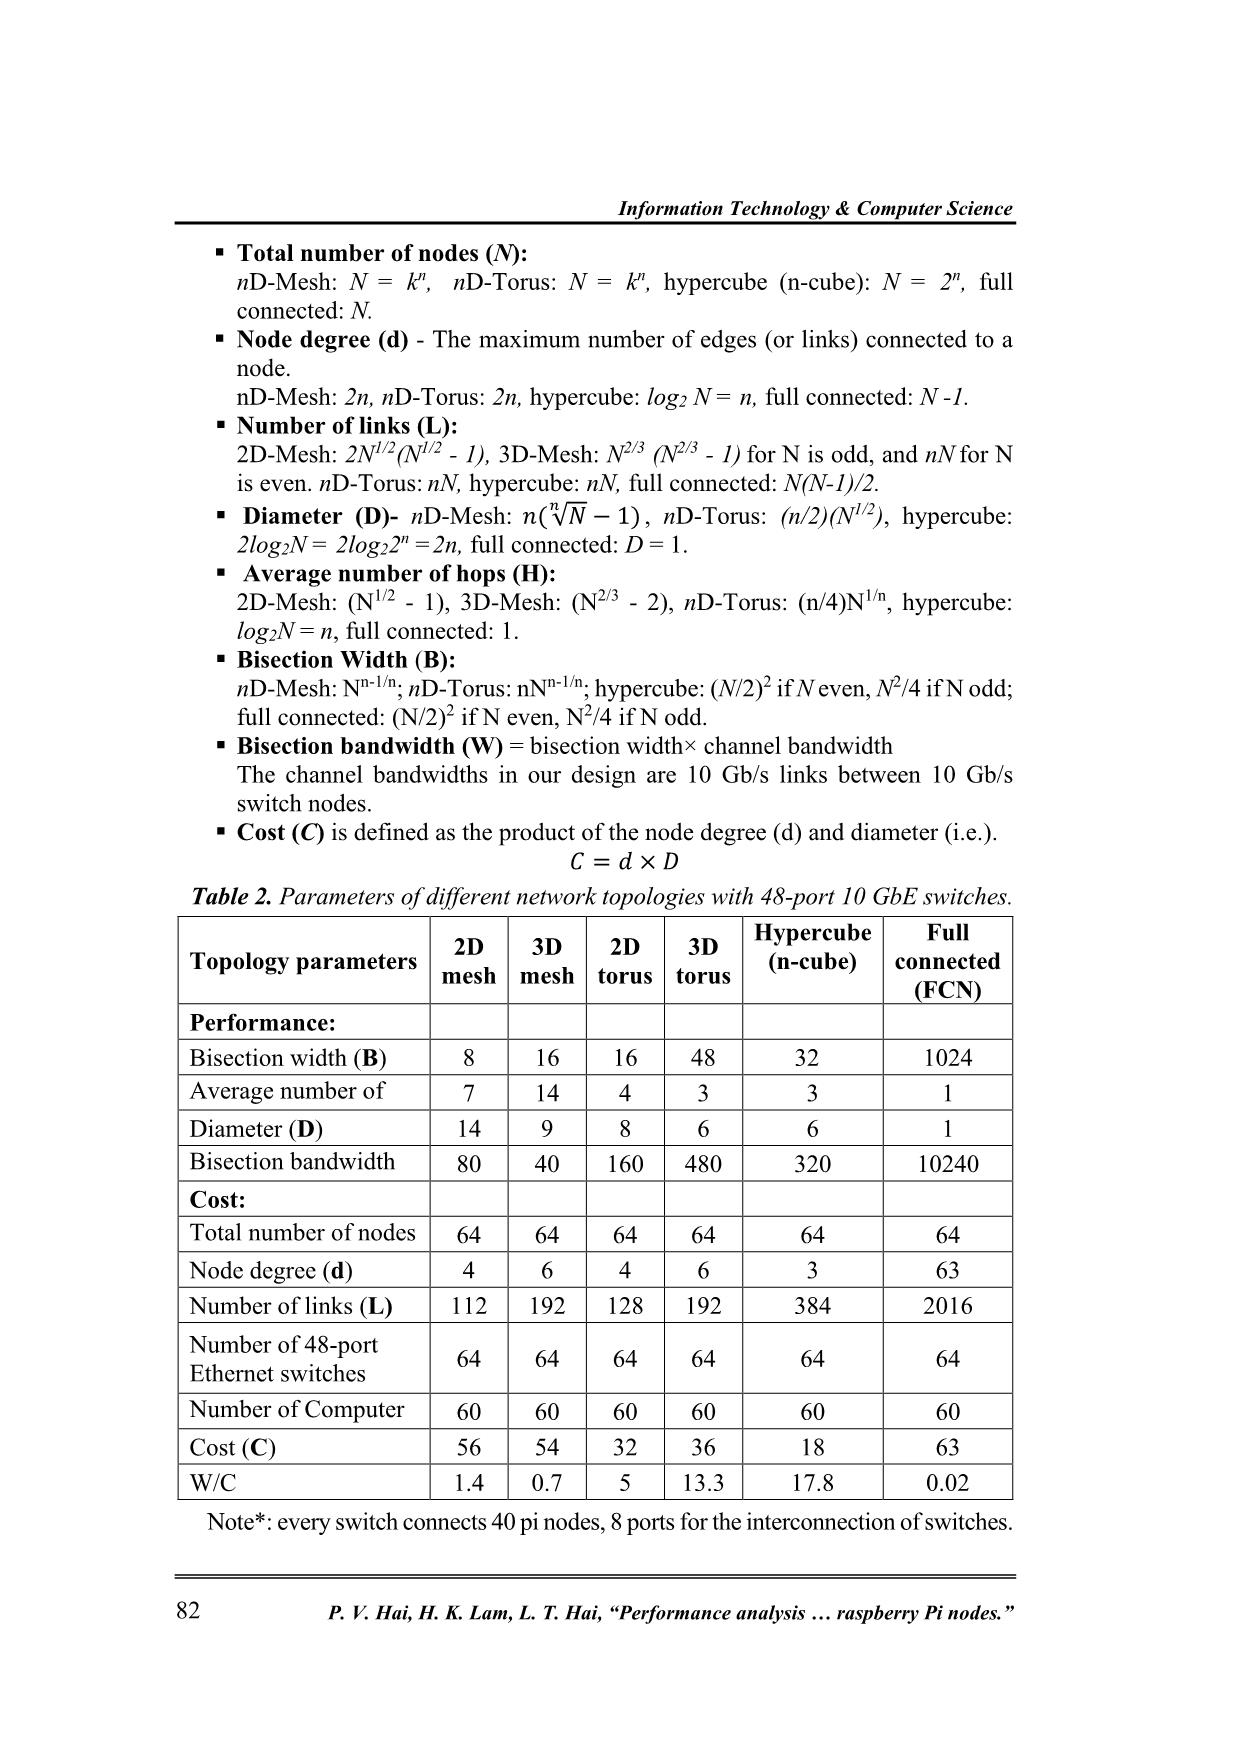
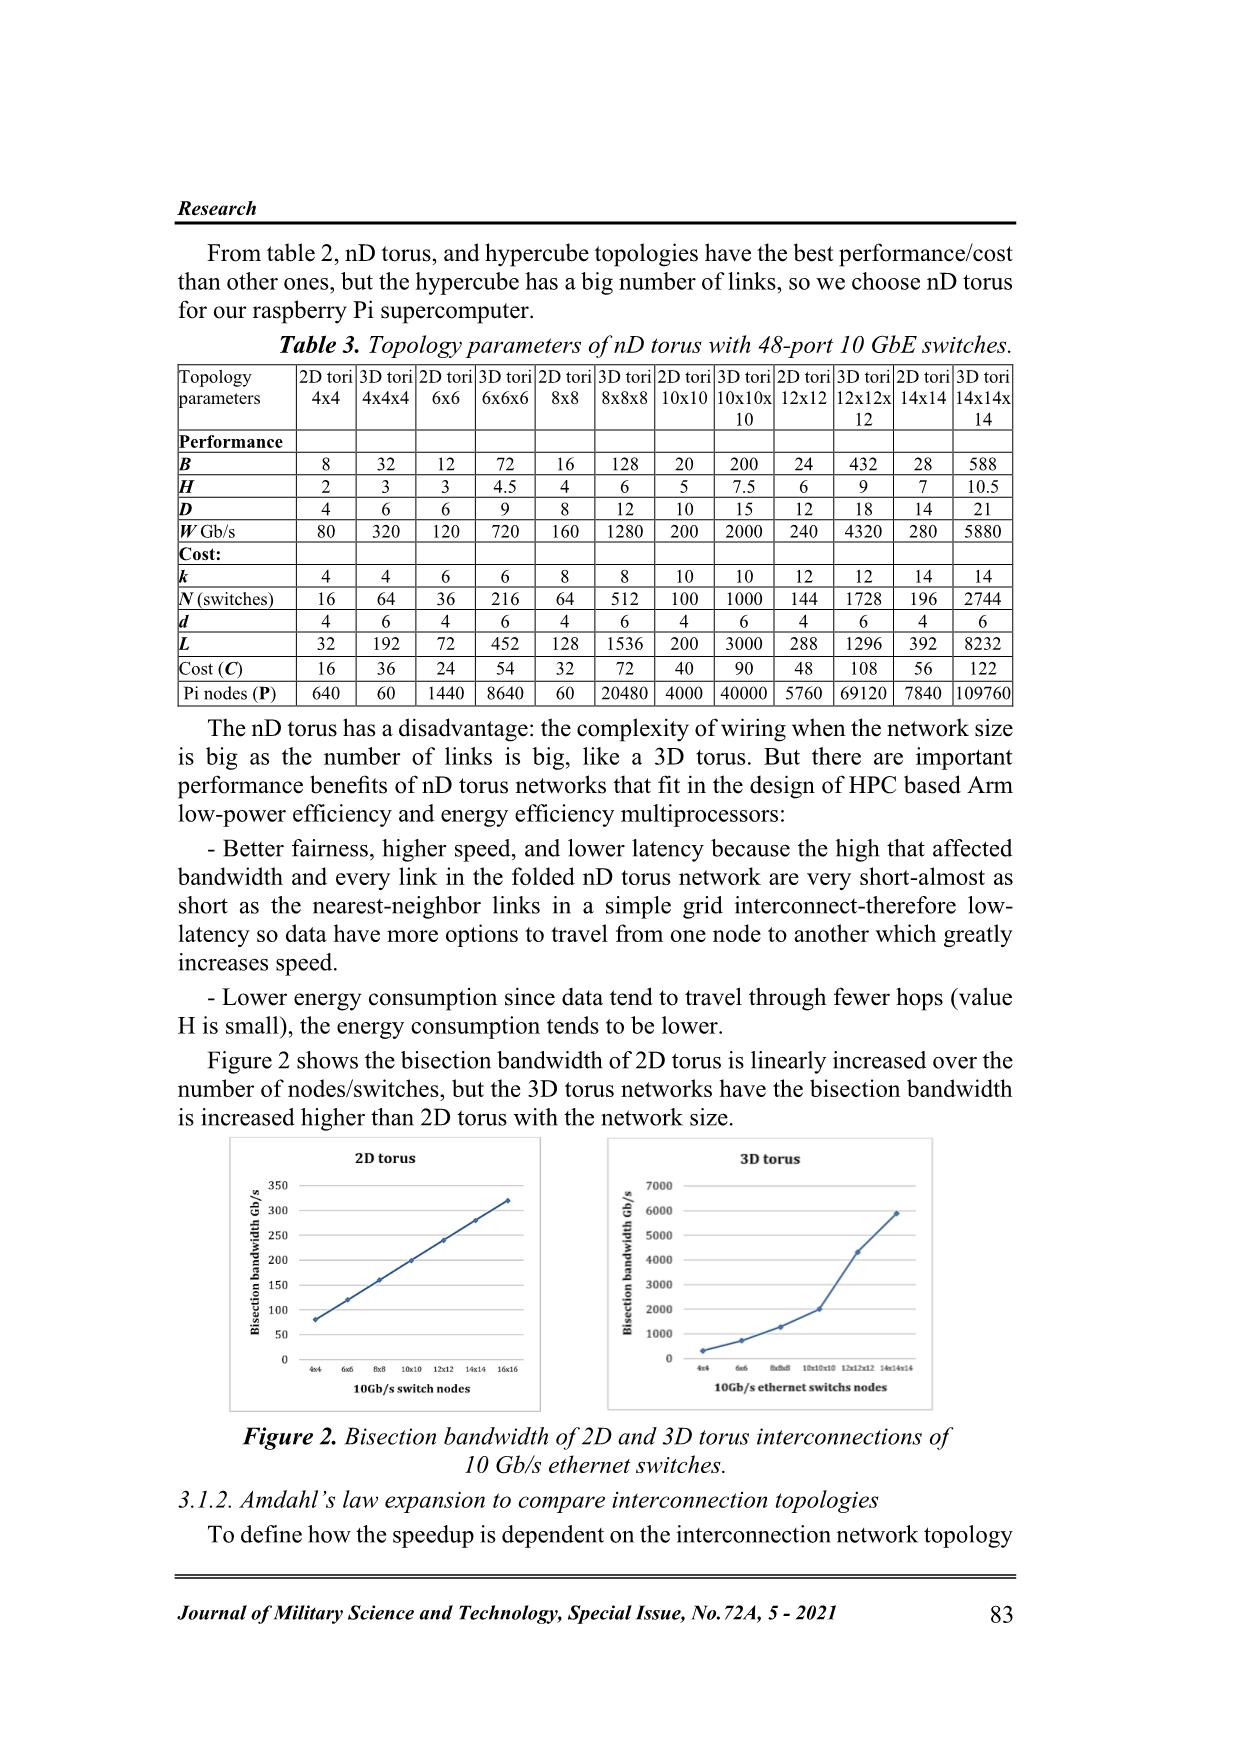
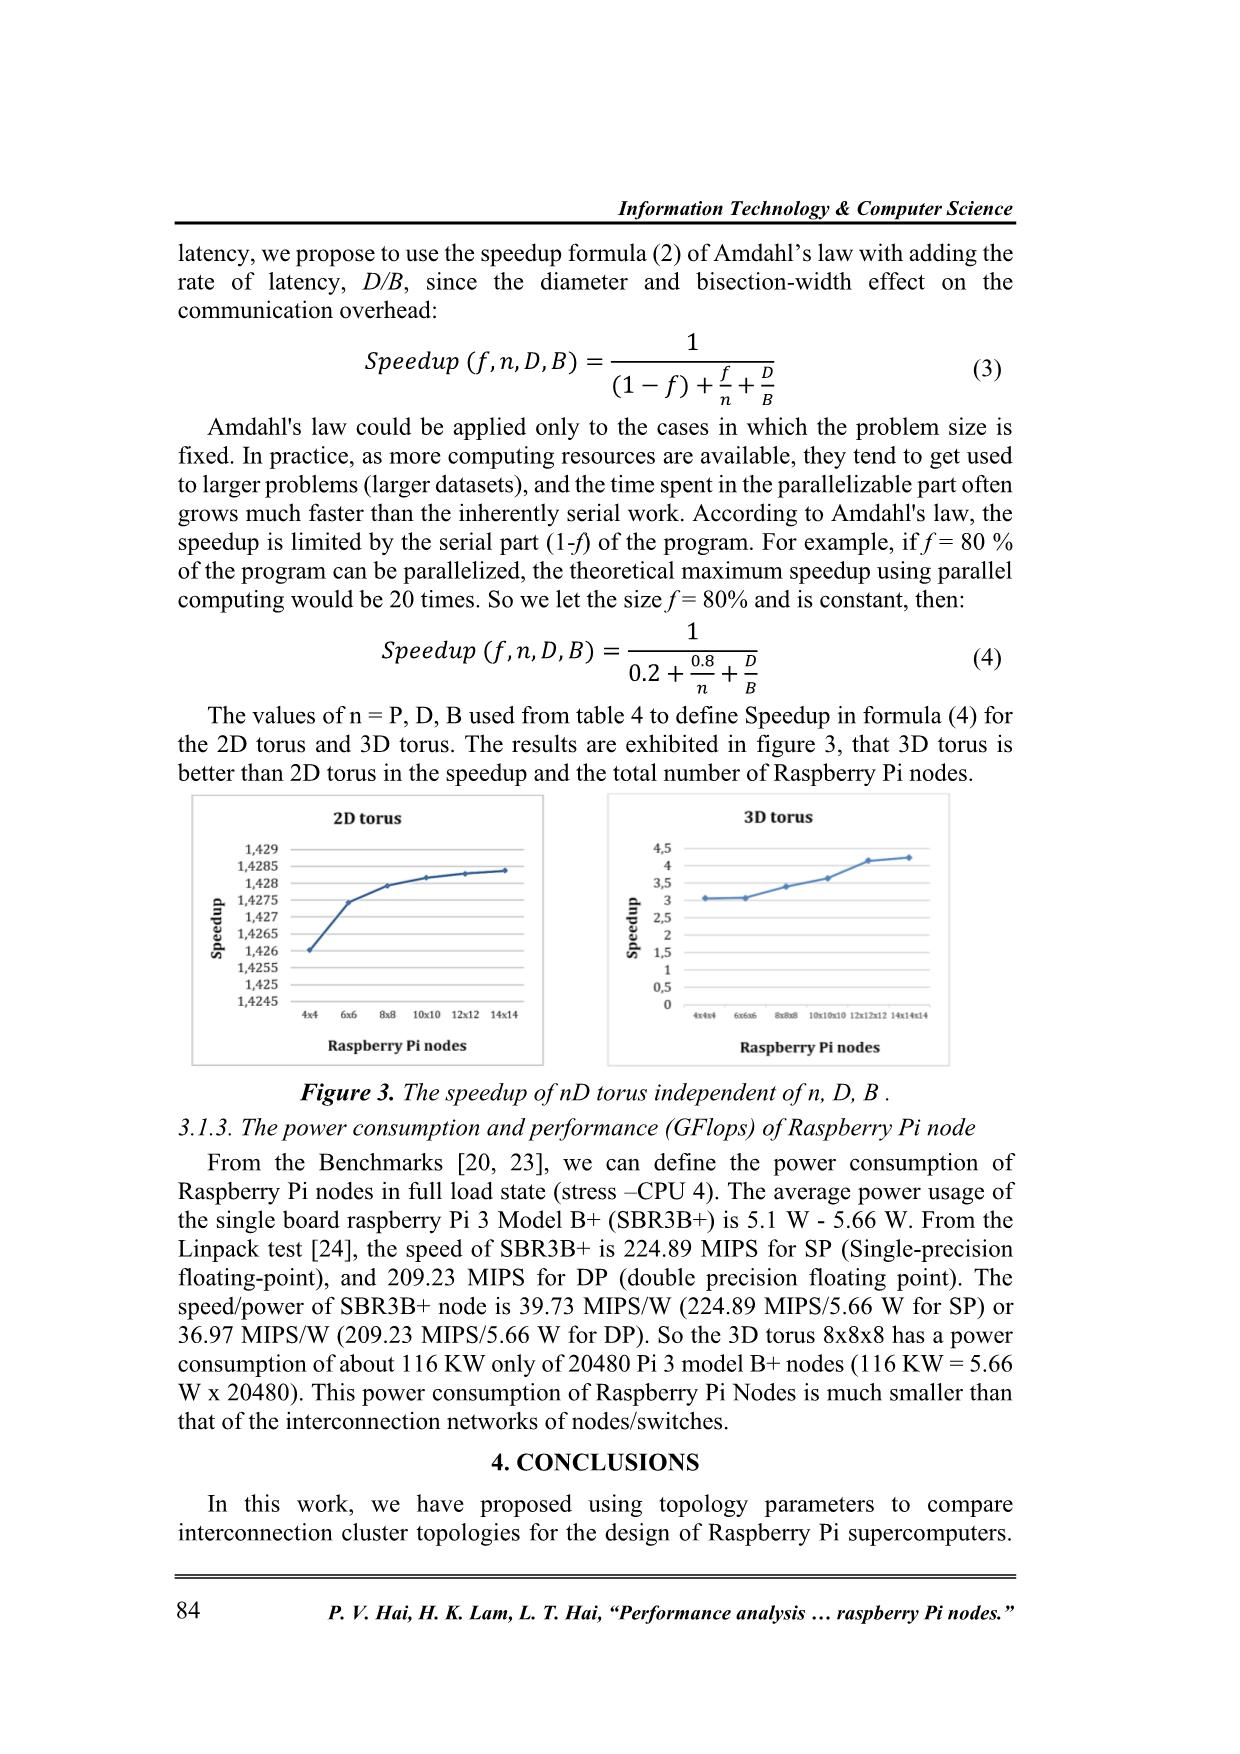
OpenGL Benchmark Stress Tests HP Linpack Stress Test Single Precision FPU Double Precision FPU Integer Stress Test Stress Test Stress Test OpenGl + 3 x CPU + Main SD + USB + Input/Output Stress Test Livermore Loops LAN Test Many performance benchmark types can be run for systems based on Raspberry Pi modules. There are 32-bit and 64-bit benchmarks and stress tests on the appropriate range of Raspberry Pi computers, up to model 3 B+/Pi 4B (table 1). Thermal Management, Whetstone, Dhrystone, SysBench CPU, Linpack, Python GPIO, SysBench RAM, Ethernet, Power Draw, Wi-Fi, and Thermal Throttling Benchmarks [21] show Pi 3 B+ is a worthy upgrade over the predecessor designs. 3.1. Propose performance measures of interconnection network topologies 3.1.1. Use topology parameters to compare interconnection topologies Performance metrics most commonly used in comparing interconnect network topologies of multiprocessor computers are an average and a maximum number of hops and bisection bandwidth (W) and an average number of hops and network diameter. If the network is bisected into two partitions, we can define bisection- width (B) of a network - is the minimum number of links to be removed to disconnect the network into two halves of equal size, it identifies a potential bottleneck of a network and is implied on its internal bandwidth. A low B can slow down many collective communication operations and thus can severely limit the performance of applications. However, achieving a high B may require a non-constant network degree. The average number of hops (H) and diameter (D) of a network - the largest distance between any pair of nodes between nodes/switches in the network serve as measures of network latency, even though they are only a partial indication of the actual message latency. To support efficient communication between any pair of nodes, the D should be minimized and B should be increased, or the rate D/B should be minimized. The maximum total message latency through the diameter includes the link (wire) latency and it increases proportionally with the number of nodes. There are the following topology parameters of networks: ▪ ki - Number of nodes in each dimension I, for an asymmetric topology: k = ki. asymmetric = an asymmetric; ▪ n - Number of dimensions; Journal of Military Science and Technology, Special Issue, No.72A, 5 - 2021 81 Information Technology & Computer Science ▪ Total number of nodes (N): n n n nD-Mesh: N = k , nD-Torus: N = k , hypercube (n-cube): N = 2 , full connected: N. ▪ Node degree (d) - The maximum number of edges (or links) connected to a node. nD-Mesh: 2n, nD-Torus: 2n, hypercube: log2 N = n, full connected: N -1. ▪ Number of links (L): 1/2 1/2 2/3 2/3 2D-Mesh: 2N (N - 1), 3D-Mesh: N (N - 1) for N is odd, and nN for N is even. nD-Torus: nN, hypercube: nN, full connected: N(N-1)/2. ▪ Diameter (D)- nD-Mesh: 푛(푛√ − 1) , nD-Torus: (n/2)(N1/2), hypercube: n 2log2N = 2log22 =2n, full connected: D = 1. ▪ Average number of hops (H): 2D-Mesh: (N1/2 - 1), 3D-Mesh: (N2/3 - 2), nD-Torus: (n/4)N1/n, hypercube: log2N = n, full connected: 1. ▪ Bisection Width (B): nD-Mesh: Nn-1/n; nD-Torus: nNn-1/n; hypercube: (N/2)2 if N even, N2/4 if N odd; full connected: (N/2)2 if N even, N2/4 if N odd. ▪ Bisection bandwidth (W) = bisection width× channel bandwidth The channel bandwidths in our design are 10 Gb/s links between 10 Gb/s switch nodes. ▪ Cost (C) is defined as the product of the node degree (d) and diameter (i.e.). = × Table 2. Parameters of different network topologies with 48-port 10 GbE switches. Hypercube Full 2D 3D 2D 3D Topology parameters (n-cube) connected mesh mesh torus torus (FCN) Performance: Bisection width (B) 8 16 16 48 32 1024 Average number of 7 14 4 3 3 1 Diameterhops (H) (D) 14 9 8 6 6 1 Bisection bandwidth 80 40 160 480 320 10240 Cost:(W) Gb/s Total number of nodes 64 64 64 64 64 64 Node(N) degree (d) 4 6 4 6 3 63 Number of links (L) 112 192 128 192 384 2016 Number of 48-port 64 64 64 64 64 64 Ethernet switches Number of Computer 60 60 60 60 60 60 CostPi nodes (C) * 56 54 32 36 18 63 W/C 1.4 0.7 5 13.3 17.8 0.02 Note*: every switch connects 40 pi nodes, 8 ports for the interconnection of switches. 82 P. V. Hai, H. K. Lam, L. T. Hai, “Performance analysis raspberry Pi nodes.” Research From table 2, nD torus, and hypercube topologies have the best performance/cost than other ones, but the hypercube has a big number of links, so we choose nD torus for our raspberry Pi supercomputer. Table 3. Topology parameters of nD torus with 48-port 10 GbE switches. Topology 2D tori 3D tori 2D tori 3D tori 2D tori 3D tori 2D tori 3D tori 2D tori 3D tori 2D tori 3D tori parameters 4x4 4x4x4 6x6 6x6x6 8x8 8x8x8 10x10 10x10x 12x12 12x12x 14x14 14x14x 10 12 14 Performance B 8 32 12 72 16 128 20 200 24 432 28 588 H 2 3 3 4.5 4 6 5 7.5 6 9 7 10.5 D 4 6 6 9 8 12 10 15 12 18 14 21 W Gb/s 80 320 120 720 160 1280 200 2000 240 4320 280 5880 Cost: k 4 4 6 6 8 8 10 10 12 12 14 14 N (switches) 16 64 36 216 64 512 100 1000 144 1728 196 2744 d 4 6 4 6 4 6 4 6 4 6 4 6 L 32 192 72 452 128 1536 200 3000 288 1296 392 8232 Cost (C) 16 36 24 54 32 72 40 90 48 108 56 122 Pi nodes (P) 640 60 1440 8640 60 20480 4000 40000 5760 69120 7840 109760 The nD torus has a disadvantage: the complexity of wiring when the network size is big as the number of links is big, like a 3D torus. But there are important performance benefits of nD torus networks that fit in the design of HPC based Arm low-power efficiency and energy efficiency multiprocessors: - Better fairness, higher speed, and lower latency because the high that affected bandwidth and every link in the folded nD torus network are very short-almost as short as the nearest-neighbor links in a simple grid interconnect-therefore low- latency so data have more options to travel from one node to another which greatly increases speed. - Lower energy consumption since data tend to travel through fewer hops (value H is small), the energy consumption tends to be lower. Figure 2 shows the bisection bandwidth of 2D torus is linearly increased over the number of nodes/switches, but the 3D torus networks have the bisection bandwidth is increased higher than 2D torus with the network size. Figure 2. Bisection bandwidth of 2D and 3D torus interconnections of 10 Gb/s ethernet switches. 3.1.2. Amdahl’s law expansion to compare interconnection topologies To define how the speedup is dependent on the interconnection network topology Journal of Military Science and Technology, Special Issue, No.72A, 5 - 2021 83 Information Technology & Computer Science latency, we propose to use the speedup formula (2) of Amdahl’s law with adding the rate of latency, D/B, since the diameter and bisection-width effect on the communication overhead: 1 푆 푒푒 ( , 푛, , ) = (3) (1 − ) + + 푛 Amdahl's law could be applied only to the cases in which the problem size is fixed. In practice, as more computing resources are available, they tend to get used to larger problems (larger datasets), and the time spent in the parallelizable part often grows much faster than the inherently serial work. According to Amdahl's law, the speedup is limited by the serial part (1-f) of the program. For example, if f = 80 % of the program can be parallelized, the theoretical maximum speedup using parallel computing would be 20 times. So we let the size f = 80% and is constant, then: 1 푆 푒푒 ( , 푛, , ) = 0.8 (4) 0.2 + + 푛 The values of n = P, D, B used from table 4 to define Speedup in formula (4) for the 2D torus and 3D torus. The results are exhibited in figure 3, that 3D torus is better than 2D torus in the speedup and the total number of Raspberry Pi nodes. Figure 3. The speedup of nD torus independent of n, D, B . 3.1.3. The power consumption and performance (GFlops) of Raspberry Pi node From the Benchmarks [20, 23], we can define the power consumption of Raspberry Pi nodes in full load state (stress –CPU 4). The average power usage of the single board raspberry Pi 3 Model B+ (SBR3B+) is 5.1 W - 5.66 W. From the Linpack test [24], the speed of SBR3B+ is 224.89 MIPS for SP (Single-precision floating-point), and 209.23 MIPS for DP (double precision floating point). The speed/power of SBR3B+ node is 39.73 MIPS/W (224.89 MIPS/5.66 W for SP) or 36.97 MIPS/W (209.23 MIPS/5.66 W for DP). So the 3D torus 8x8x8 has a power consumption of about 116 KW only of 20480 Pi 3 model B+ nodes (116 KW = 5.66 W x 20480). This power consumption of Raspberry Pi Nodes is much smaller than that of the interconnection networks of nodes/switches. 4. CONCLUSIONS In this work, we have proposed using topology parameters to compare interconnection cluster topologies for the design of Raspberry Pi supercomputers. 84 P. V. Hai, H. K. Lam, L. T. Hai, “Performance analysis raspberry Pi nodes.” Research From the obtained results, we proposed to use nD torus topology, since their performance/cost parameters are the best. We also proposed the simple expansion of Amdahl's law formula with the rate of D/B as the factor that affected the communication overhead of the interconnection network topology to evaluate the speedup and compare different network topology types. For future work, the supercomputer cluster module of 24-Raspberry Pi 3 Model B+ could be applied to Raspberry Pi 4 8GB cluster models in 3D torus interconnection network of 10GBASE-T switches to create a higher performance (TFlops/watt) we expect. REFERENCES [1]. Victor Tangermann. “The Eight most powerful supercomputers in the world”. September 28th, 2017. [2]. Greenhill, David. "SWaP Space Watts and Power" (PDF). US EPA Energystar. Retrieved 14 November 2013. [3]. Girish Kumar Patnaik et. al. “Green Computing Metrics, Methods and Models”. International Journal of Engineering Research & Technology (IJERT). ISSN: 2278-0181. Vol. 3 Issue 3, March – 2014. [4]. “Mont-Blanc. European Modular and Power-Efficient HPC Processor”. Copyright 2011 - 2020 © All Rights Reserved [5]. “Scalable clusters make HPC R&D easy as Raspberry Pi”. Bitscope.com/cluster [6]. Gerald Venza. “Building the world’s largest Raspberry Pi cluster”. [7]. www.pidramble.com/wiki/benchmarks/microsd-cards. [8]. Nikhil Jain et.al. “Predicting the Performance Impact of Different Fat-Tree Configurations”. Lawrence Livermore National Laboratory. [9]. Tomohiro Inoue, Fujitsu Limited. “The 6D Mesh/Torus Interconnect of K Computer”. [10]. G. Bolch, S. Greiner, H. de Meer, and K. S. Trivedi, “Queueing Networks and Markov Chains ”, John Wiley, 2nd edition, 2006. [11]. Norhazlina Hamid, Robert John Walters, Gary Brian Wills. “An Analytical Model of Multi-Core Multi-Cluster Architecture (MCMCA)”. Open Journal of Cloud Computing (OJCC) Volume 2, Issue 1, 2015. ISSN 2199-1987. [12]. Xiaoyue Pan. “Performance Modeling of Multicore Systems”. ISSN 1651- 6214 ISBN 978-91-554-9451-3. [13]. Murata, T.: “Petri nets: properties, analysis, and applications”, Proceedings of IEEE, 77 (4), 1989, 541-580. [14]. Falko Bause, Pieter S. Kritzinger, “Stochastic Petri Nets”. Bause and Kritzinger, 2002. [15]. M. Ajmone Marsan, Gianfranco Balbo, Gianni Conte, Susanna Donatelli, Giuliana Franceschinis, “Modelling with generalized stochastic Petri nets”. Università degli Studi di Torino. [16]. Viktor Mashkov & Jiri Barilla & Pavel Similar. “Applying Petri Nets to Modeling of Many-Core Processor Self-Testing when Tests are Performed Randomly”. J Electron Test (2013). Journal of Military Science and Technology, Special Issue, No.72A, 5 - 2021 85 Information Technology & Computer Science [17]. Mark D. Hill, University of Wisconsin-Madison Michael R. Marty, Google. “Amdahl’s Law in the Multicore Era”. [18]. Christina Delimitrou, Christos Kozyrakis. “Amdahl’s Law for Tail Latency”. August 2018 | Vol. 61| No. 8| Communications of the ACM. [19]. Surya Narayanan Natarajan. “Modeling performance of serial and parallel sections of multi-threaded programs in many core era”. pr´epar´ee `a l’unit´e de recherche INRIA – Bretagne Atlantique Institut National de Recherche en Informatique et Automatique Composante Universitaire (ISTIC). [20]. Philip J. et. al. “Performance analysis of single-board computer clusters”. Future Generation Computer Systems. 102 (2020) 278-291. ELSEVIER. [21]. Gareth Halfaceree. “Benchmarking the Raspberry Pi 3 B+”. Mar 14, 2018. [22]. [22].Roy Longbottom, UK Government. “Raspberry Pi 4B 32 Bit Benchmarks”. Technical Report. June 2019. [23]. https://www.pidramble.com/wiki/benchmarks/power-consumption. [24]. Lucy Hattersley. “Raspberry Pi 4 vs Raspberry Pi 3B+”. https://magpi.raspberrypi.org/articles/raspberry-pi-4-vs-raspberry-pi-3b-plus [25]. “Raspberry Pi 4 vs Raspberry Pi 3B+,” The MagPi magazine. https://magpi.raspberrypi.org/articles/raspberry-pi-4-vs-raspberry-pi-3b-plus. TÓM TẮT PHÂN TÍCH HIỆU NĂNG CỦA SIÊU MÁY TÍNH DỰA TRÊN NỀN TẢNG RASPBERRY Để đạt được tốc độ ở petaflops và exaflops, các siêu máy tính hiện đại hiện nay dựa trên công nghệ điện toán 2009-2018 cần phải tiêu thụ điện năng từ 6 MW đến 20 MW, hầu hết điện năng đó đều được chuyển đổi thành nhiệt, do vậy đòi hỏi chi phí cao về công nghệ làm mát và giải nhiệt. Việc xử lý giảm nhiệt vẫn là một vấn đề quan trọng đối với hầu hết các siêu máy tính hiện nay. Các siêu máy tính có hiệu suất năng lượng cao dựa trên bộ xử lý của dòng chip ARM trên các điện thoại di động thông minh là một lựa chọn mới vì nó cho phép chúng giải quyết các vấn đề về hiệu suất, năng lượng và chi phí. Với công nghệ dòng chip ARM giới thiệu gần đây các siêu máy tính có máy chủ sử dụng mô-đun cụm raspberry Pi CPU 64-bit 1.4 GHz hướng tới mục tiêu tiết kiệm năng lượng, chiếm ít không gian lưu trữ, tỏa ít nhiệt năng và hạn chế tối đa lượng CO2 tạo ra đó là xu hướng nghiên cứu mới, đã nằm trong tầm tay. Vấn đề là cần làm gì và hiệu năng của siêu máy tính dựa trên bộ xử lý đa lõi di động như thế nào. Bài viết này đề xuất kiến trúc cụm siêu máy tính raspberry Pi và phân tích hiệu năng. Từ khóa: Bộ xử lý Mobile ARM; Cụm siêu máy tính Raspberry Pi; Phân tích hiệu năng. Received 7th November 2020 Revised 8th January 2021 Accepted 10th May 2021 Author affiliations: 1 Hanoi Open University; 2 Hung Yen University of Technology and Education; 3 Military Science and Technology Institute. *Corresponding author: phamvanhai@hou.edu.vn. 86 P. V. Hai, H. K. Lam, L. T. Hai, “Performance analysis raspberry Pi nodes.”
File đính kèm:
 performance_analysis_of_the_supercomputer_based_on_raspberry.pdf

