Neural network used in predicting cardiovascular risks
1. Introduction
No gold standard exists for assessing the risk of individual patients. Current
techniques use a generic technique applied to the patient’s cardiovascular record.
This data itself is inconsistent, over a history of patients at any one clinical site, and
not always immediately useable. The research is applying data mining methods to
make the clinical data more useable, meaningful and open to the use of neural and
other classifier techniques.
Risk assessment systems were designed and implemented to help the clinicians
in their decision for the patients particular cardiovascular uses. These systems support the diagnosis based on medical data and knowledge domain. The quality of
medical decision making will be improved by the support from these systems and
clinical experiences. This research focuses on the popular system, which is using
broadly in Britain medical decision support system, The Physiological Operative
Severity Score for enUmeration of Mortality and morbidity (POSSUM).
The research focuses on the using of both supervised learning, and unsupervised techniques in the medical domain, in particular to the cardiovascular domain.
These techniques are Multi-Layer Perceptron (MLP), Radial Basic Function (RBF),
and Support Vector Machine (SVM) for supervised learning, and Self Organizing
Maps (SOM) for unsupervised learning. The techniques of supervised ones are applied to the data domain in order to have a comparison between the evaluated system
of POSSUM and the advantage of Neural network. The comparisons are based on
the rate of mortality and morbidity of patients. The outcome set of unsupervised
learning techniques is compared to the results of supervised ones.
Trang 1
Trang 2
Trang 3
Trang 4
Trang 5
Trang 6
Trang 7
Trang 8
Tóm tắt nội dung tài liệu: Neural network used in predicting cardiovascular risks
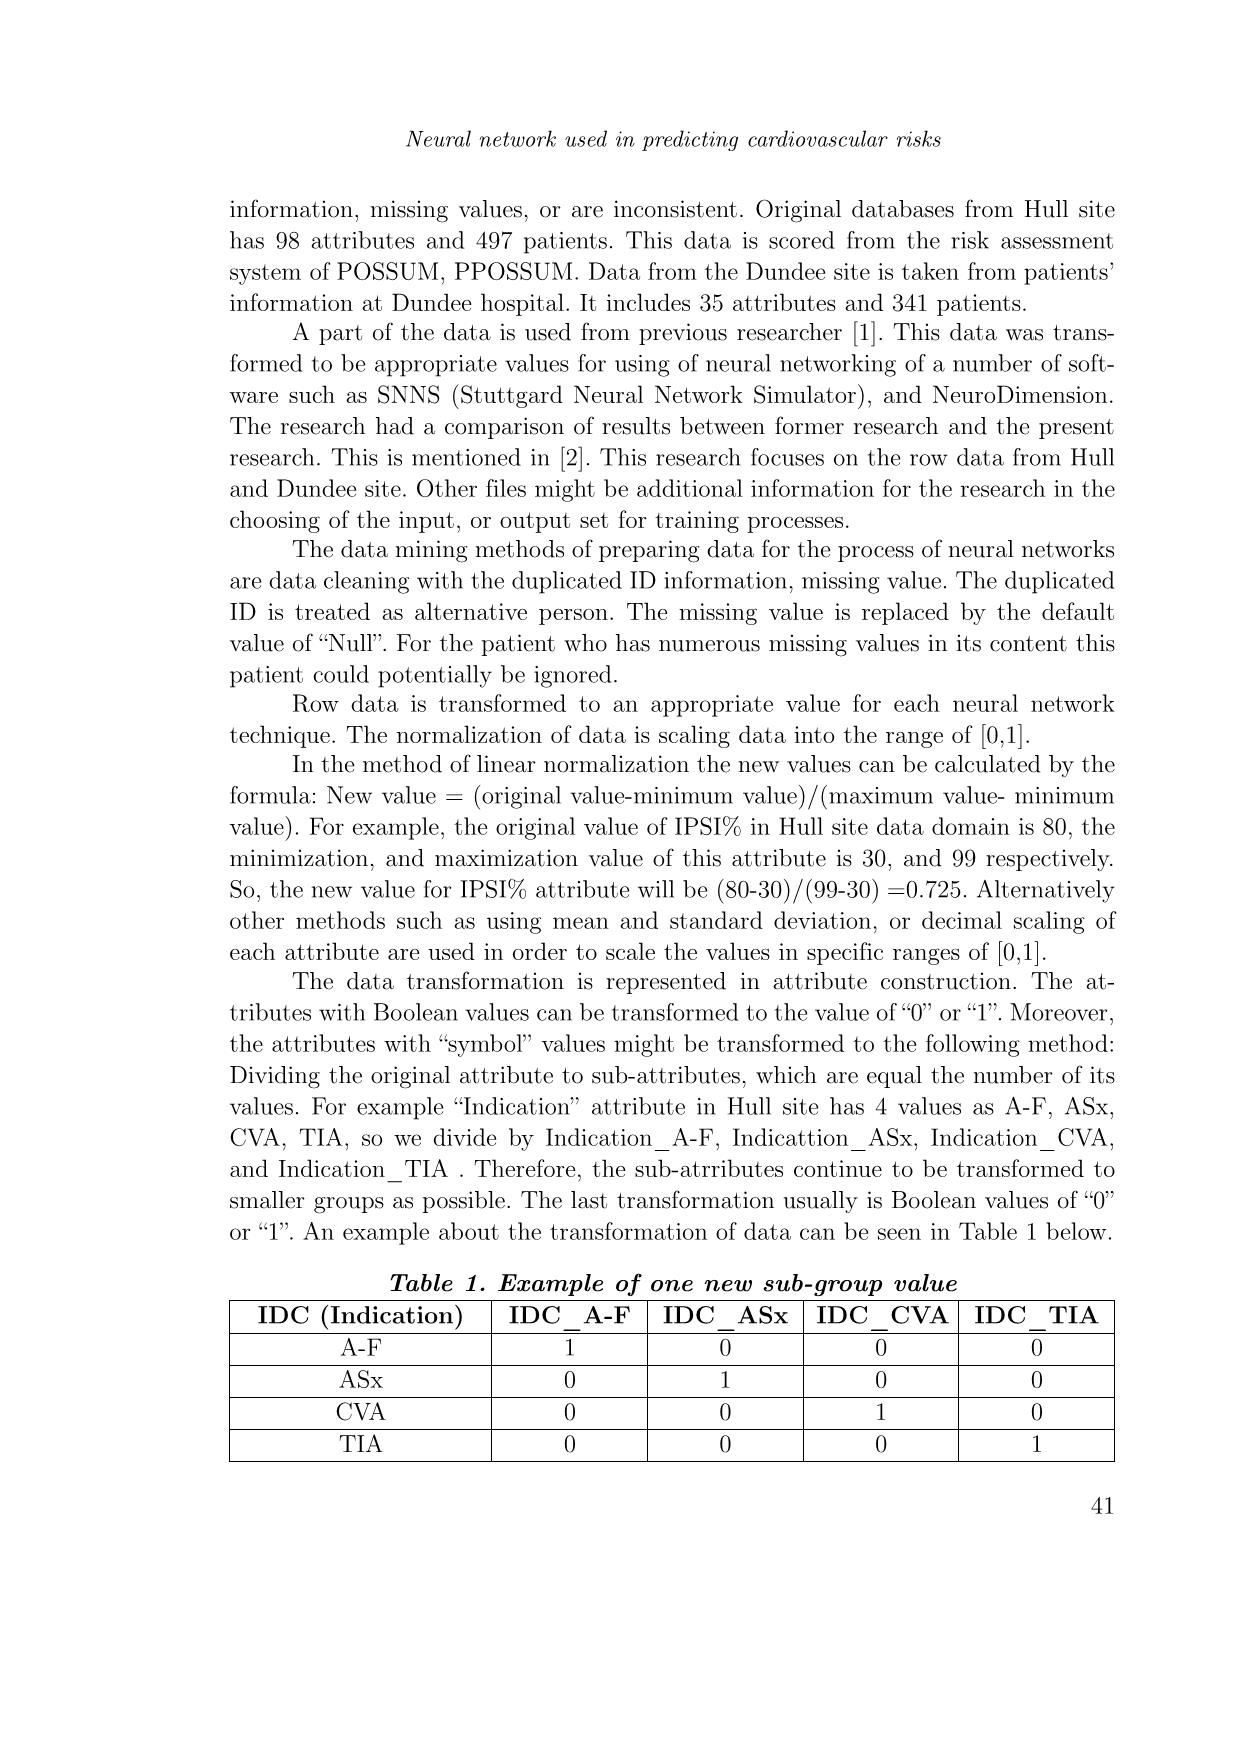
Indication_TIA . Therefore, the sub-atrributes continue to be transformed to
smaller groups as possible. The last transformation usually is Boolean values of “0”
or “1”. An example about the transformation of data can be seen in Table 1 below.
Table 1. Example of one new sub-group value
IDC (Indication) IDC_A-F IDC_ASx IDC_CVA IDC_TIA
A-F 1 0 0 0
ASx 0 1 0 0
CVA 0 0 1 0
TIA 0 0 0 1
41
Nguyen Thi Thu Thuy
3. Risk assessment systems
The medical decision support system are populary reviewed in such as MYCIN;
INTERNIST-QMR; the GLAsgow system for the diagnosis of DYSpepsia; Acute
Physiology and Chronic Health Evaluation [3]; or POSSUM and PPOSSUM [4].
The research focuses on the popular risk assessment systems in Britain (POSSUM
and PPOSSUM).
The Physiological and Operative Severity Score for enUmeration of Mortality
and morbidity (POSSUM) is a system, which provide a tool for predicting risk
adjustment and comparative audit. POSSUM (and PPOSSUM) rely on an a-priori
scoring of physiological and operative severity parameters. The calculation of the
physiological and operative severity parameters is based on multivariate discriminant
analysis of factors measured in a broad group of general surgical patients. The logistic
regression analysis in this model tries to produce statistically significant equations
for both mortality and morbidity based on a 12 factors/4 grades physiological score
and 6 factors operative severity score [4].
There is another model which based on POSSUM, it is Portsmouth POSSUM
(P-POSSUM). This equation was derived from a heterogeneous general surgical pop-
ulation and has been used as an audit tool to provide risk-adjusted operative mor-
tality rates. The equations correlated to mortality and morbidity were introduced
in [4].
Experiment:
The data in Hull site were already scored in POSSUM and PPOSSUM system.
However, the evaluation of mortality and morbidity rate need to be calculated in
order to have a comparison between scoring system prediction and neural network
prediction. The data in the Dundee site did not include scores from risk assessment
system of POSSUM and PPOSSUM. This data needs to be highlighted for further
investigation.
There is an example of experiment of calculation mortality and morbidity
rates. The data used in this experiment is from the Hull site, and already scored for
the physiological and operative severity attributes. The equations of POSSUM to
predict the morbidity and mortality for each patient are used. The performance of
the system is measured by the ratio of death between the prediction of the system
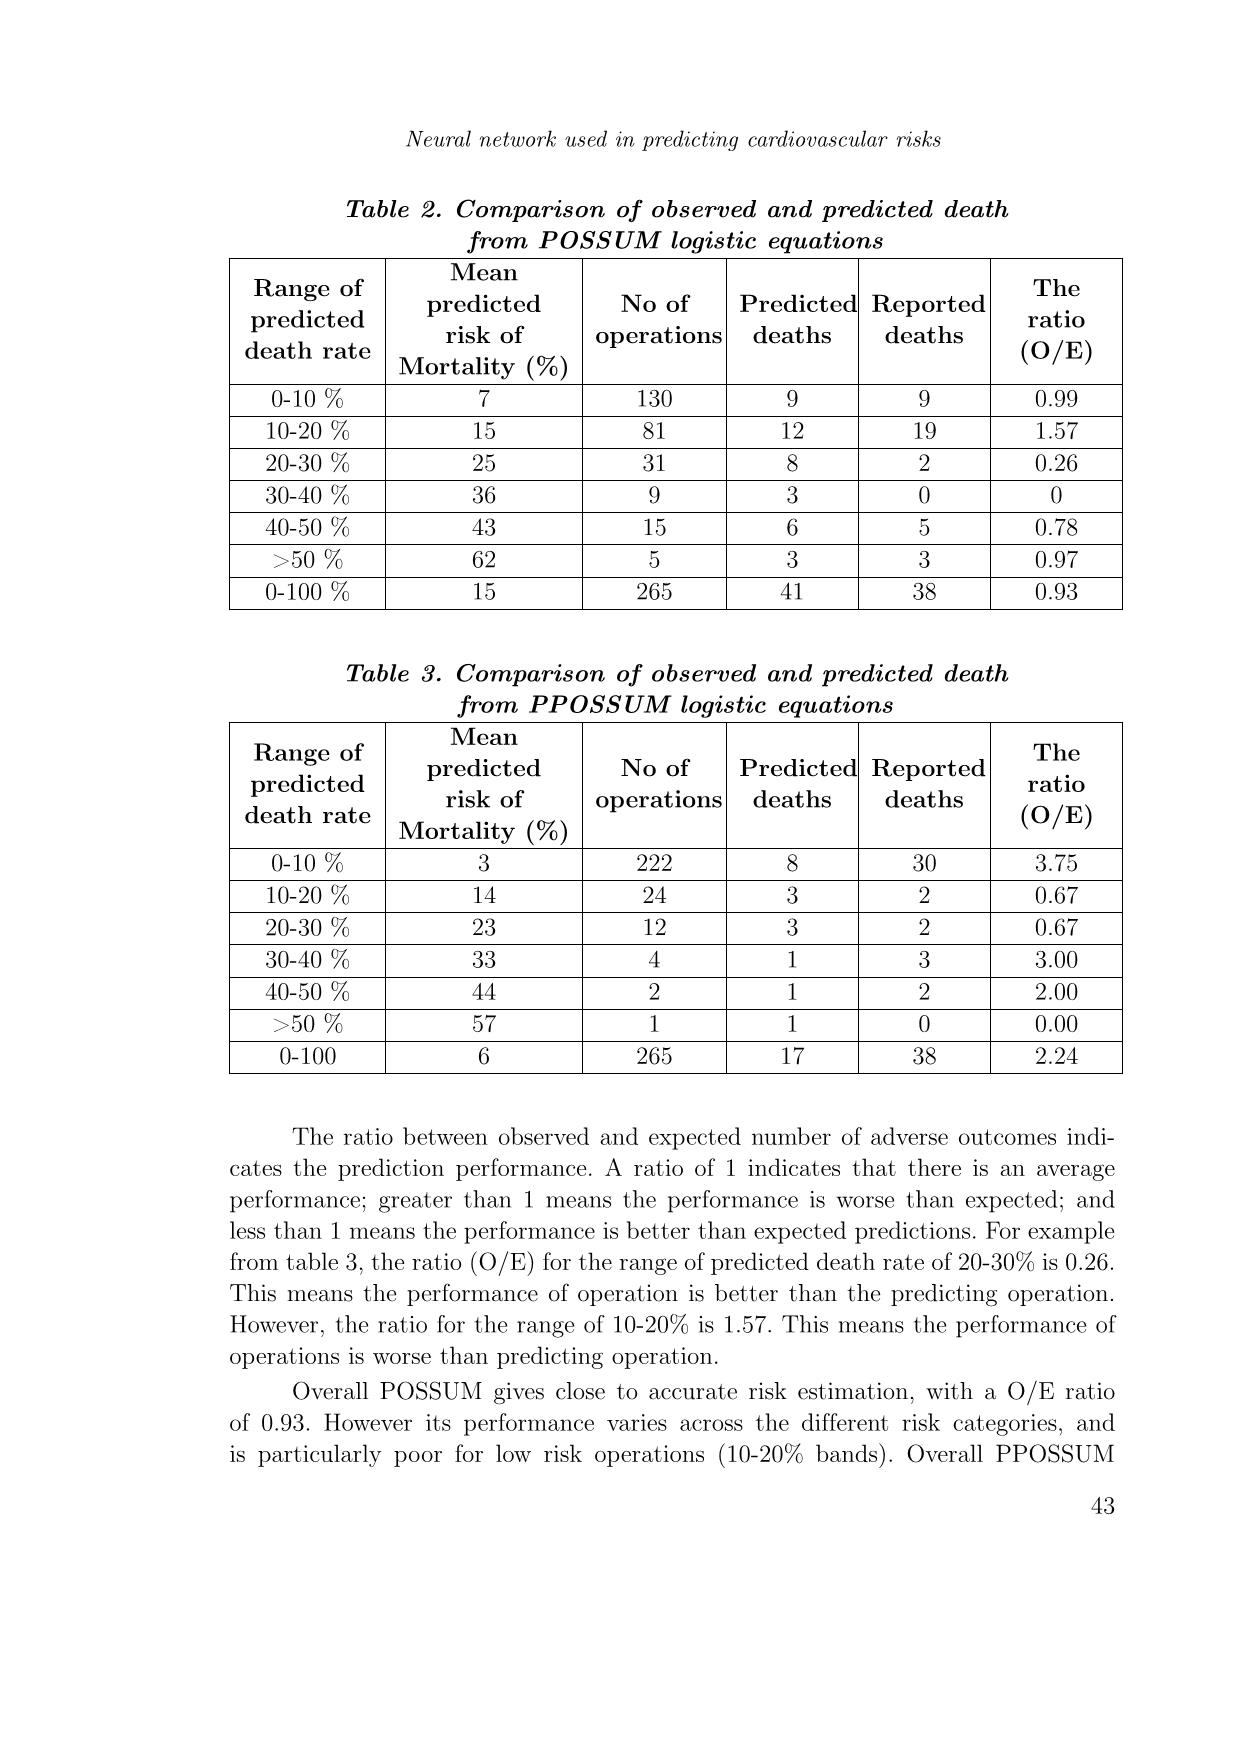
and the observed death. Table 2 below shows the mean predicted risk of mortality
in 7 groups of patients, and the comparisons between predicted death and observed
death of the POSSUM system. The performances of the mortality rate for PPOS-
SUM can be seen in Table 3 below.
42
Neural network used in predicting cardiovascular risks
Table 2. Comparison of observed and predicted death
from POSSUM logistic equations
Range of
predicted
death rate
Mean
predicted
risk of
Mortality (%)
No of
operations
Predicted
deaths
Reported
deaths
The
ratio
(O/E)
0-10 % 7 130 9 9 0.99
10-20 % 15 81 12 19 1.57
20-30 % 25 31 8 2 0.26
30-40 % 36 9 3 0 0
40-50 % 43 15 6 5 0.78
>50 % 62 5 3 3 0.97
0-100 % 15 265 41 38 0.93
Table 3. Comparison of observed and predicted death
from PPOSSUM logistic equations
Range of
predicted
death rate
Mean
predicted
risk of
Mortality (%)
No of
operations
Predicted
deaths
Reported
deaths
The
ratio
(O/E)
0-10 % 3 222 8 30 3.75
10-20 % 14 24 3 2 0.67
20-30 % 23 12 3 2 0.67
30-40 % 33 4 1 3 3.00
40-50 % 44 2 1 2 2.00
>50 % 57 1 1 0 0.00
0-100 6 265 17 38 2.24
The ratio between observed and expected number of adverse outcomes indi-
cates the prediction performance. A ratio of 1 indicates that there is an average
performance; greater than 1 means the performance is worse than expected; and
less than 1 means the performance is better than expected predictions. For example
from table 3, the ratio (O/E) for the range of predicted death rate of 20-30% is 0.26.
This means the performance of operation is better than the predicting operation.
However, the ratio for the range of 10-20% is 1.57. This means the performance of
operations is worse than predicting operation.
Overall POSSUM gives close to accurate risk estimation, with a O/E ratio
of 0.93. However its performance varies across the different risk categories, and
is particularly poor for low risk operations (10-20% bands). Overall PPOSSUM
43
Nguyen Thi Thu Thuy
underestimates the risk (O/E = 2.24), and for no one group does it give an accurate
risk estimation. The need for better estimators is therefore obvious.
4. Neural network techniques
The Neural Network (NN) approach adopted is that of an information pro-
cessing system that consists of a graph representing the processing system as well as
various algorithms which access that graph [5]. Neural Network techniques can be
divided into two methodologies: supervised learning and unsupervised learning. For
supervised learning, the data is trained via networks with expected (a-priori defined)
outputs. The supervised techniques used are MultiLayer Perceptron (MLP), Radial
Basic Function (RBF), and Support Vector Machine (SVM). Conversely, with the
unsupervised method, no a-priori classifications are used.
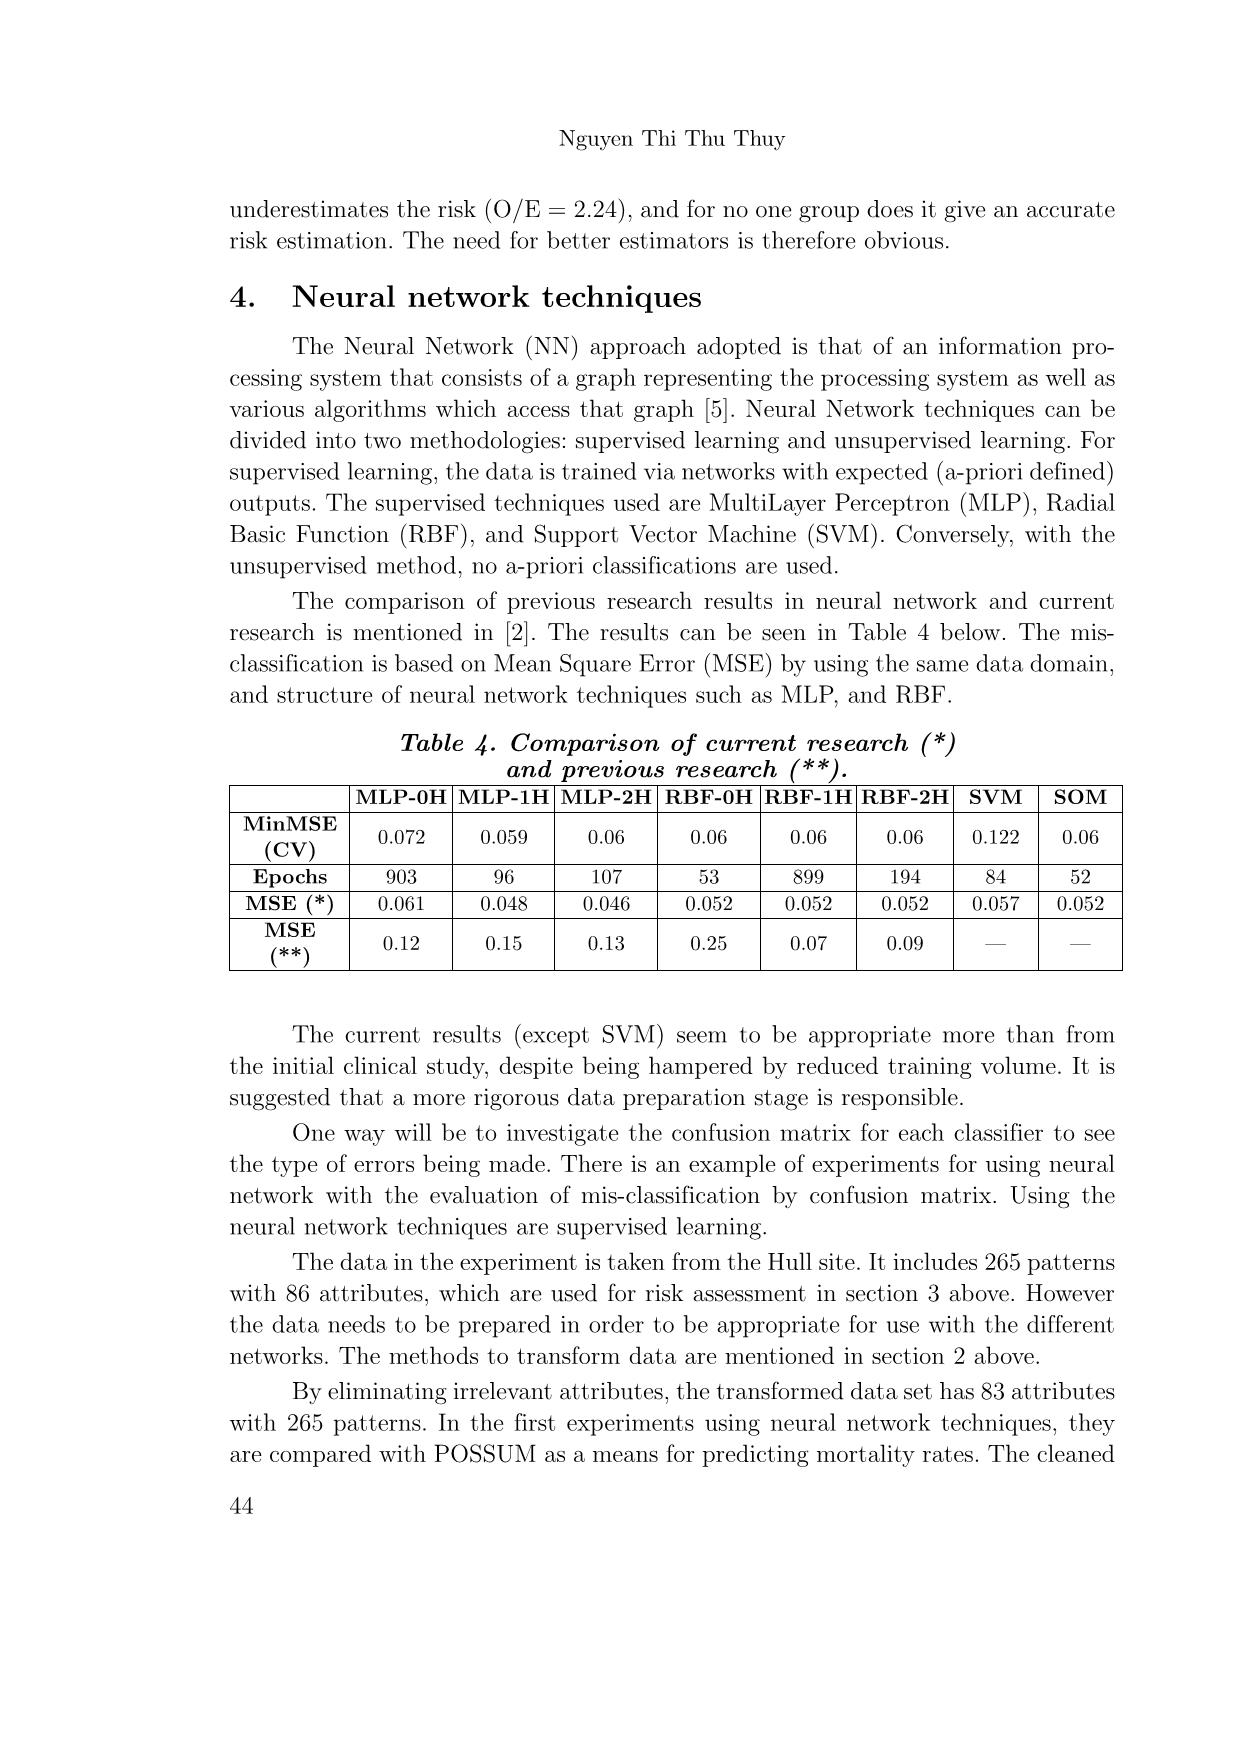
The comparison of previous research results in neural network and current
research is mentioned in [2]. The results can be seen in Table 4 below. The mis-
classification is based on Mean Square Error (MSE) by using the same data domain,
and structure of neural network techniques such as MLP, and RBF.
Table 4. Comparison of current research (*)
and previous research (**).
MLP-0H MLP-1H MLP-2H RBF-0H RBF-1H RBF-2H SVM SOM
MinMSE
(CV) 0.072 0.059 0.06 0.06 0.06 0.06 0.122 0.06
Epochs 903 96 107 53 899 194 84 52
MSE (*) 0.061 0.048 0.046 0.052 0.052 0.052 0.057 0.052
MSE
(**) 0.12 0.15 0.13 0.25 0.07 0.09 — —
The current results (except SVM) seem to be appropriate more than from
the initial clinical study, despite being hampered by reduced training volume. It is
suggested that a more rigorous data preparation stage is responsible.
One way will be to investigate the confusion matrix for each classifier to see
the type of errors being made. There is an example of experiments for using neural
network with the evaluation of mis-classification by confusion matrix. Using the
neural network techniques are supervised learning.
The data in the experiment is taken from the Hull site. It includes 265 patterns
with 86 attributes, which are used for risk assessment in section 3 above. However
the data needs to be prepared in order to be appropriate for use with the different
networks. The methods to transform data are mentioned in section 2 above.
By eliminating irrelevant attributes, the transformed data set has 83 attributes
with 265 patterns. In the first experiments using neural network techniques, they
are compared with POSSUM as a means for predicting mortality rates. The cleaned
44
Neural network used in predicting cardiovascular risks
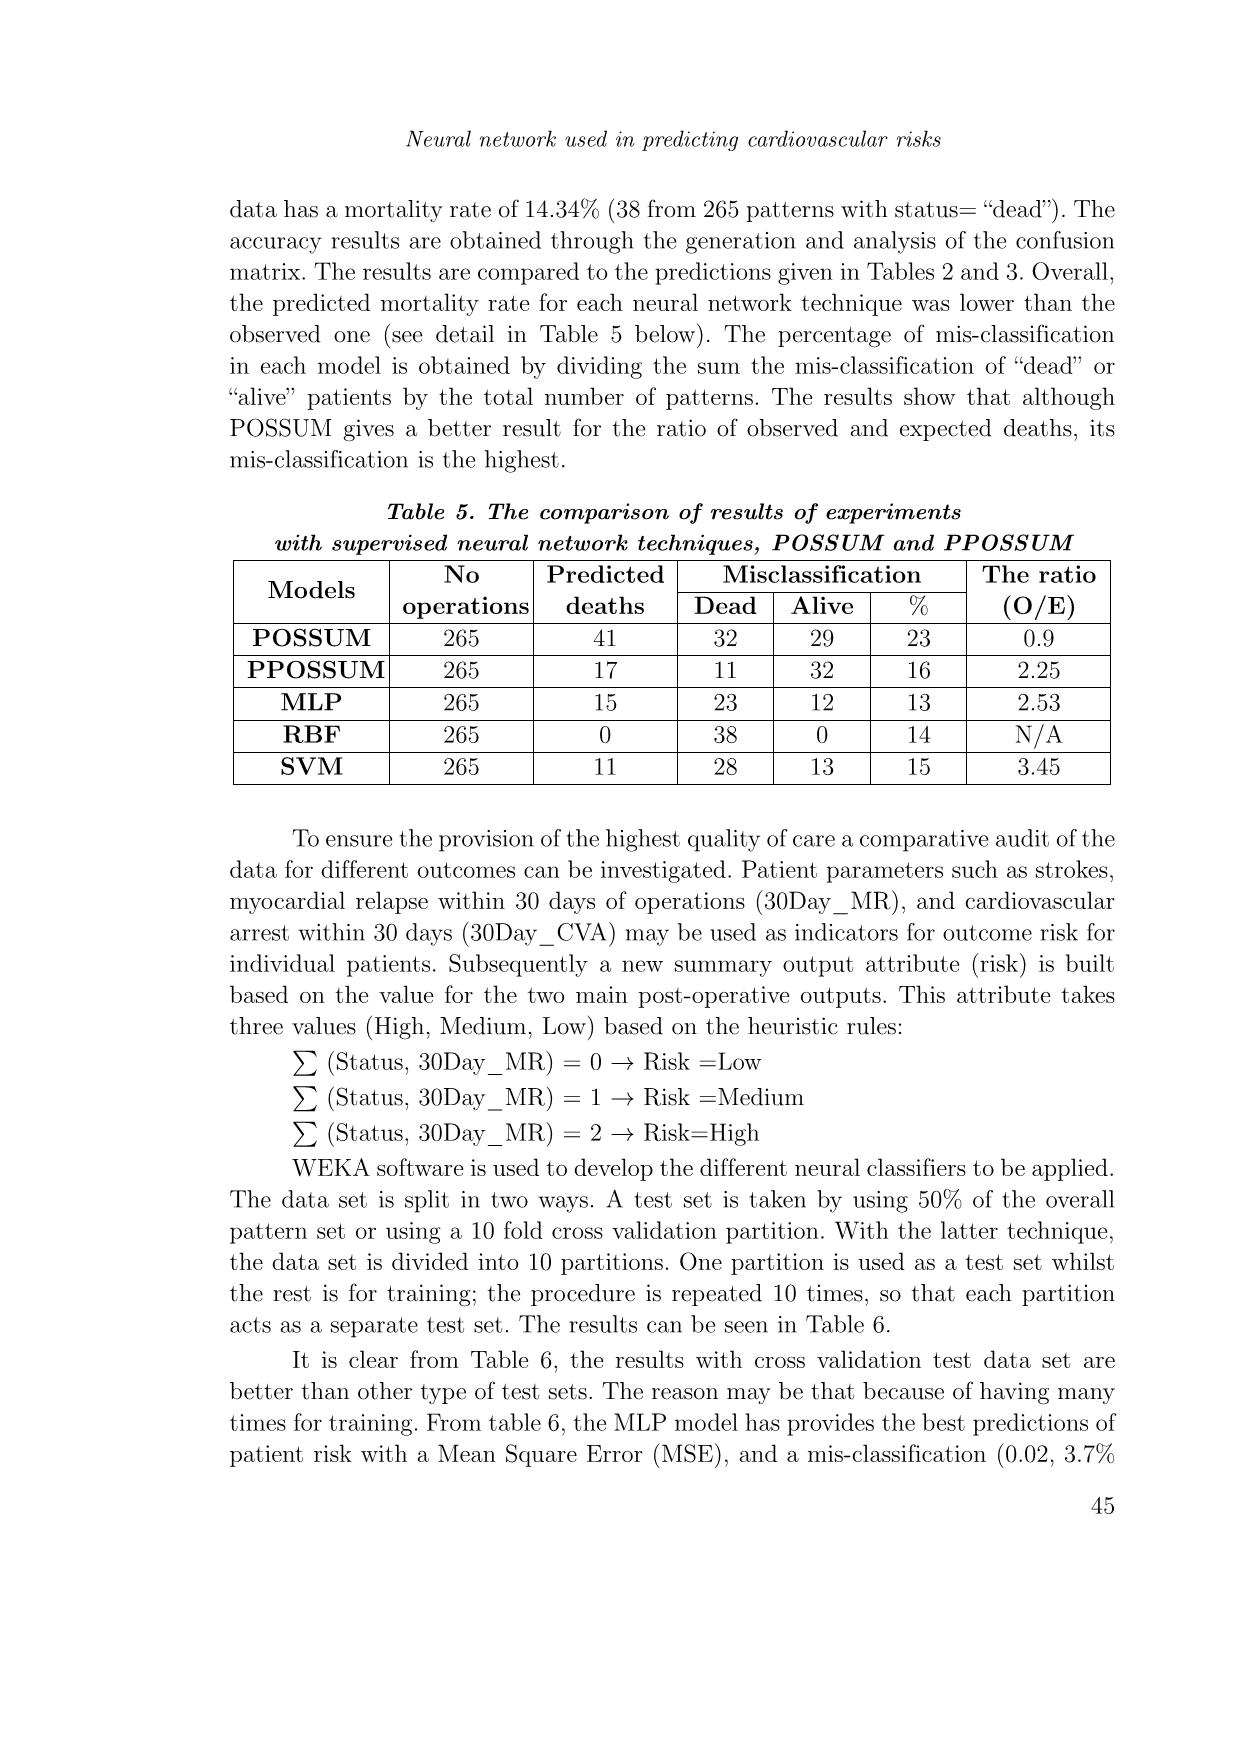
data has a mortality rate of 14.34% (38 from 265 patterns with status= “dead”). The
accuracy results are obtained through the generation and analysis of the confusion
matrix. The results are compared to the predictions given in Tables 2 and 3. Overall,
the predicted mortality rate for each neural network technique was lower than the
observed one (see detail in Table 5 below). The percentage of mis-classification
in each model is obtained by dividing the sum the mis-classification of “dead” or
“alive” patients by the total number of patterns. The results show that although
POSSUM gives a better result for the ratio of observed and expected deaths, its
mis-classification is the highest.
Table 5. The comparison of results of experiments
with supervised neural network techniques, POSSUM and PPOSSUM
Models No Predicted Misclassification The ratiooperations deaths Dead Alive % (O/E)
POSSUM 265 41 32 29 23 0.9
PPOSSUM 265 17 11 32 16 2.25
MLP 265 15 23 12 13 2.53
RBF 265 0 38 0 14 N/A
SVM 265 11 28 13 15 3.45
To ensure the provision of the highest quality of care a comparative audit of the
data for different outcomes can be investigated. Patient parameters such as strokes,
myocardial relapse within 30 days of operations (30Day_MR), and cardiovascular
arrest within 30 days (30Day_CVA) may be used as indicators for outcome risk for
individual patients. Subsequently a new summary output attribute (risk) is built
based on the value for the two main post-operative outputs. This attribute takes
three values (High, Medium, Low) based on the heuristic rules:∑
(Status, 30Day_MR) = 0 → Risk =Low∑
(Status, 30Day_MR) = 1 → Risk =Medium∑
(Status, 30Day_MR) = 2 → Risk=High
WEKA software is used to develop the different neural classifiers to be applied.
The data set is split in two ways. A test set is taken by using 50% of the overall
pattern set or using a 10 fold cross validation partition. With the latter technique,
the data set is divided into 10 partitions. One partition is used as a test set whilst
the rest is for training; the procedure is repeated 10 times, so that each partition
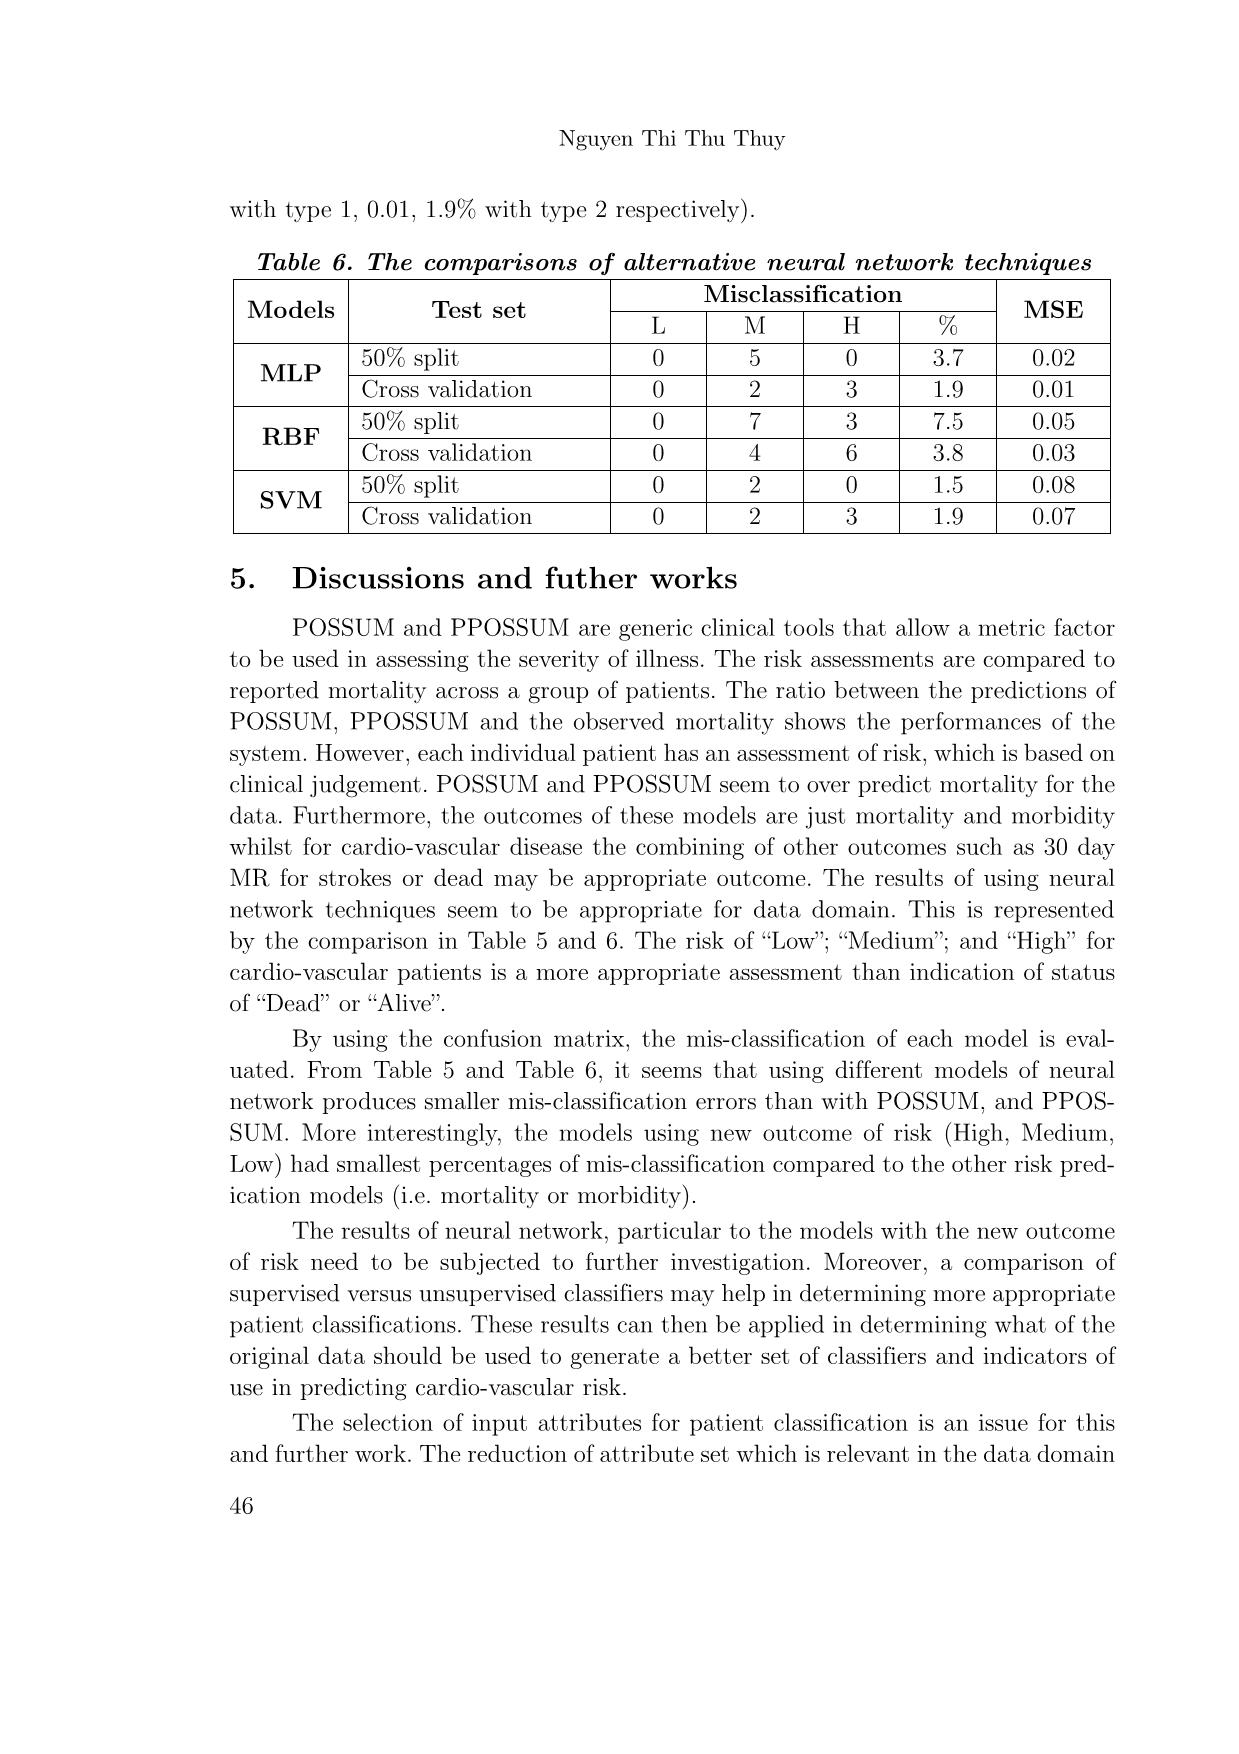
acts as a separate test set. The results can be seen in Table 6.
It is clear from Table 6, the results with cross validation test data set are
better than other type of test sets. The reason may be that because of having many
times for training. From table 6, the MLP model has provides the best predictions of
patient risk with a Mean Square Error (MSE), and a mis-classification (0.02, 3.7%
45
Nguyen Thi Thu Thuy
with type 1, 0.01, 1.9% with type 2 respectively).
Table 6. The comparisons of alternative neural network techniques
Models Test set Misclassification MSEL M H %
MLP 50% split 0 5 0 3.7 0.02Cross validation 0 2 3 1.9 0.01
RBF 50% split 0 7 3 7.5 0.05Cross validation 0 4 6 3.8 0.03
SVM 50% split 0 2 0 1.5 0.08Cross validation 0 2 3 1.9 0.07
5. Discussions and futher works
POSSUM and PPOSSUM are generic clinical tools that allow a metric factor
to be used in assessing the severity of illness. The risk assessments are compared to
reported mortality across a group of patients. The ratio between the predictions of
POSSUM, PPOSSUM and the observed mortality shows the performances of the
system. However, each individual patient has an assessment of risk, which is based on
clinical judgement. POSSUM and PPOSSUM seem to over predict mortality for the
data. Furthermore, the outcomes of these models are just mortality and morbidity
whilst for cardio-vascular disease the combining of other outcomes such as 30 day
MR for strokes or dead may be appropriate outcome. The results of using neural
network techniques seem to be appropriate for data domain. This is represented
by the comparison in Table 5 and 6. The risk of “Low”; “Medium”; and “High” for
cardio-vascular patients is a more appropriate assessment than indication of status
of “Dead” or “Alive”.
By using the confusion matrix, the mis-classification of each model is eval-
uated. From Table 5 and Table 6, it seems that using different models of neural
network produces smaller mis-classification errors than with POSSUM, and PPOS-
SUM. More interestingly, the models using new outcome of risk (High, Medium,
Low) had smallest percentages of mis-classification compared to the other risk pred-
ication models (i.e. mortality or morbidity).
The results of neural network, particular to the models with the new outcome
of risk need to be subjected to further investigation. Moreover, a comparison of
supervised versus unsupervised classifiers may help in determining more appropriate
patient classifications. These results can then be applied in determining what of the
original data should be used to generate a better set of classifiers and indicators of
use in predicting cardio-vascular risk.
The selection of input attributes for patient classification is an issue for this
and further work. The reduction of attribute set which is relevant in the data domain
46
Neural network used in predicting cardiovascular risks
might improve the classifiers. This is based on the theory of mutual information If
the domain derived techniques are not to be trusted or are to be independently vali-
dated, then alternative means of clustering patients (according to risk) are required.
Unsupervised neural techniques are used to achieve this.
REFERENCES
[1] Kuhan, DN Davis*, IC Chetter, CN McCollum+, PT McCollum, 2003. The use
of Artificial Neural Networks for risk prediction following Carotid endarterectomy.
Internal Report.
[2] TNguyen TT and Davis ND, 2005. Predicting CardioVascular Risk Using Neural
Net Techniques. Poster in The Computer Science Conference.
[3] Lisboa P.J.G, 2002. A review of evidence of health benefit from artificial neural
networks in medical intervention. Elsevier: Neural Network 15, pp. 11-39.
[4] Copeland G P, Jones D, Walters M, 1991. POSSUM: a scoring system for surgical
audit. Br J Surg 78, pp. 355-360.
[5] Dunham, M. H, 2002. Data mining introductory and Advance Topics, Upper
Saddle River, NJ : Prentice Hall/Pearson Education.
ABSTRACT
Neural network using in predicting cardiovascular risks
Neural Networks are broadly applied in a number of fields such as cognitive
science, diagnosis, and forecasting. Medical decision support is one area of increasing
research interest. This research looks at the application of data mining techniques to
the assessment of risk in the clinical domain of cardiovascular medicine. The primary
technique is the modelling of medical data using a number of alternative neural net-
work techniques. The research focuses on classification for risk assessment in given
medical data using both supervised and unsupervised learning. Specific techniques
investigated are Multi-Layer Perceptron, Radial Basic Function, and Support Vector
Machine for supervised classification, and Self Organizing Map, Cluster algorithm
for unsupervised ones. The popular risk scoring systems used in British Surgery
are described. The Physiological and Operative Severity Score for enumeration of
Mortality and morbidity (POSSUM), and Portsmouth POSSUM (PPOSSUM) are
systems, which provide a tool for predicting risk adjustment and comparative au-
dit. The POSSUM and PPOSSUM models are built assuming a linear relationship
between the outcome and other variables. The risk assessment of popular medicine
scoring system such as POSSUM and PPOSSUM is compared to neural network
predictions in order to increase the advantages of using NN. All results of predicting
risks are analysed in order to evaluate the agreements between NN techniques, and
the decision will be further investigated.
47
File đính kèm:
 neural_network_used_in_predicting_cardiovascular_risks.pdf

