Low-Dose CT image denoising using image decomposition and sparse representation
X-Ray computed tomography (CT) is now a widely used imaging modality for numerous medical purposes. The risk of high X-ray radiation may induce genetic, cancerous and other diseases, demanding the development of new image processing methods that are able to enhance the quality of low-dose CT images. However, lowering the radiation dose increases the noise in acquired images and hence affects important diagnostic information. This paper contributes an efficient denoising method for low-dose CT images. A noisy image is decomposed into three component images of low, medium and high frequency bands; noise is mainly presented in the medium and high component images. Then, by exploiting the fact that a small image patch of the noisy image can be approximated by a linear combination of several elements in a given dictionary of noise-free image patches generated from noise-free images taken at nearly the same position with the noisy image, noise in these medium and high component images are effectively eliminated. Specifically, we give new solutions for image decomposition to easily control the filter parameters, for dictionary construction to improve the effectiveness and reduce the running-time. Instead of using a large dataset of patches, only a structured small part of patches extracted from the raw data is used to form a dictionary, to be used in sparse coding. In addition, we illustrate the effectiveness of the proposed method in preserving image details which are subtle but clinically important. Experimental results conducted on both synthetic and real noise data demonstrate that the proposed method is competitive with the state-of-the-art methods
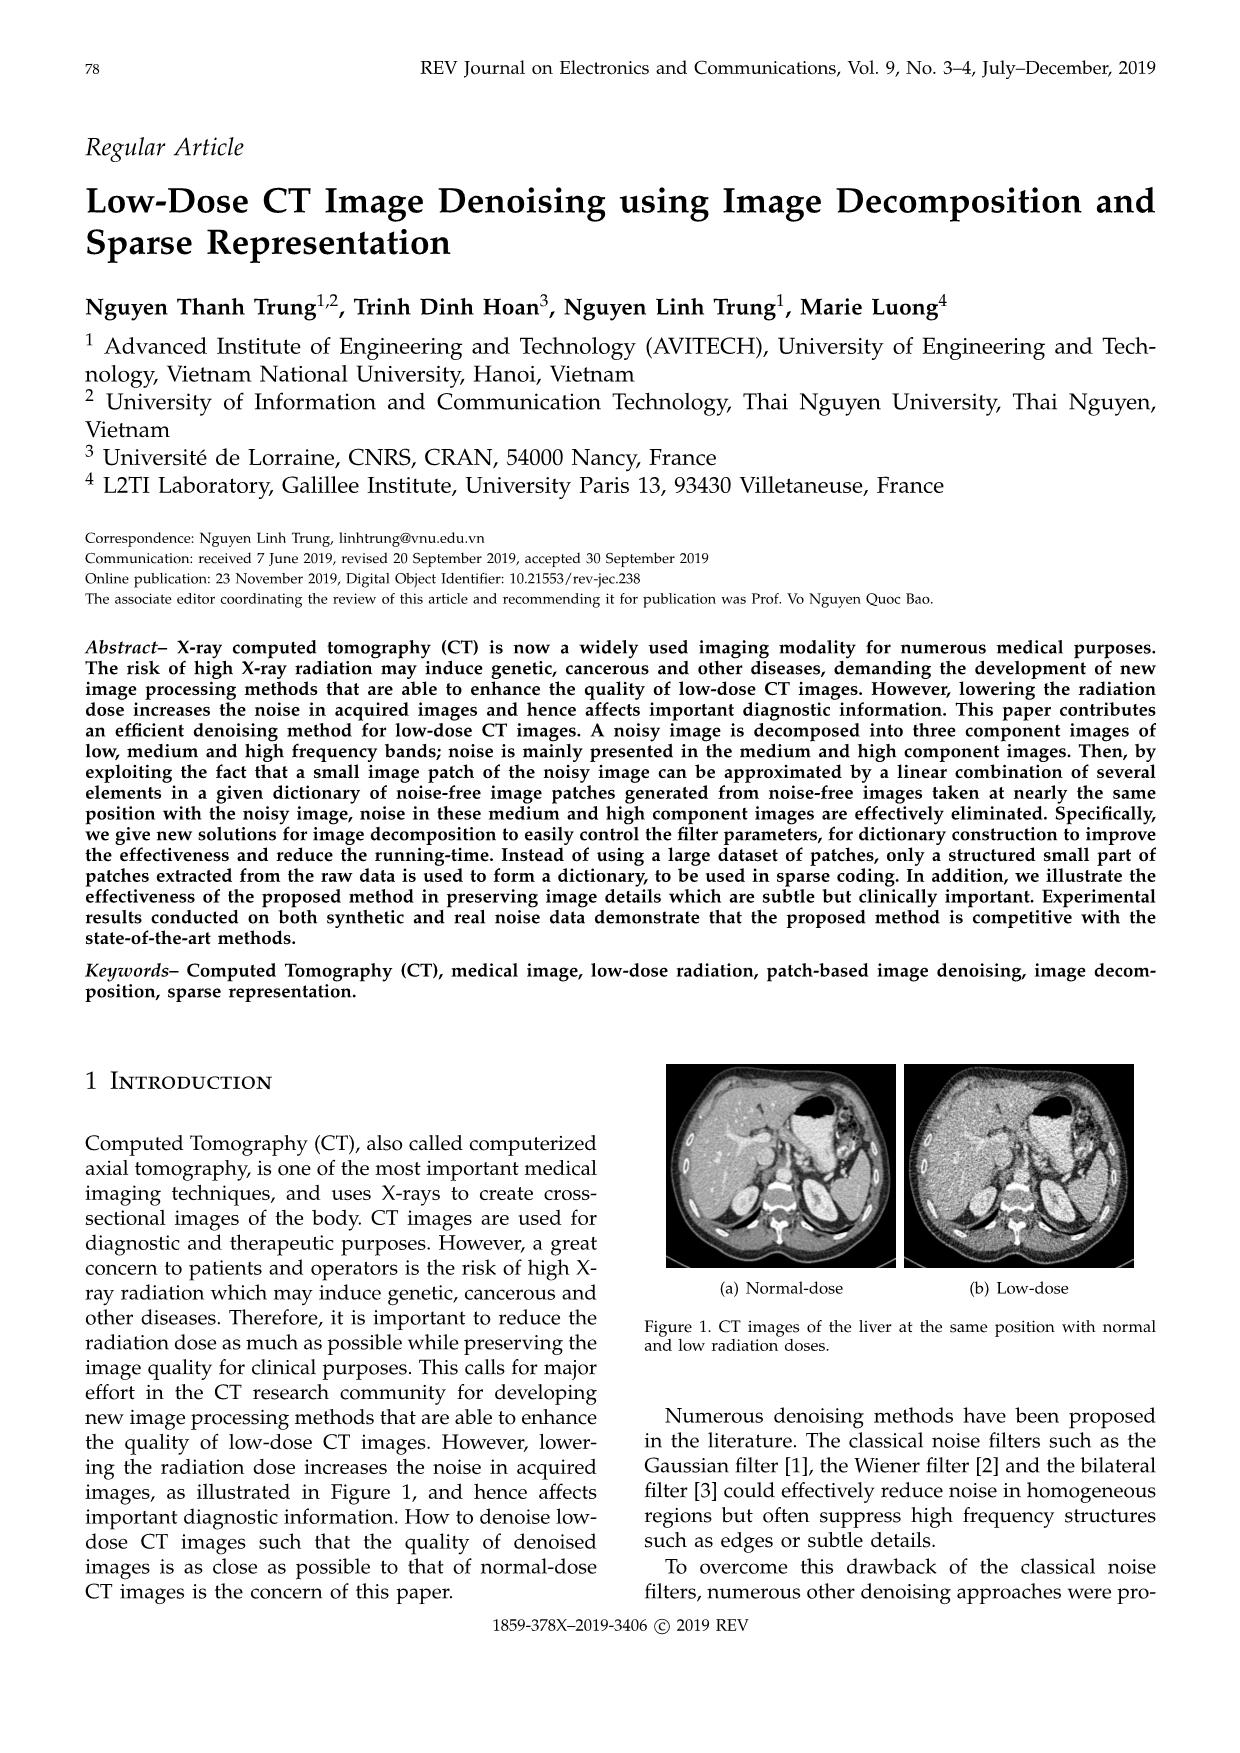
Trang 1
Trang 2
Trang 3
Trang 4
Trang 5
Trang 6
Trang 7
Trang 8
Trang 9
Trang 10
Tải về để xem bản đầy đủ
Tóm tắt nội dung tài liệu: Low-Dose CT image denoising using image decomposition and sparse representation
tation 85
N. T. Trung et al.: Low-Dose CT Image Denoising using Image Decomposition and Sparse Representation 85
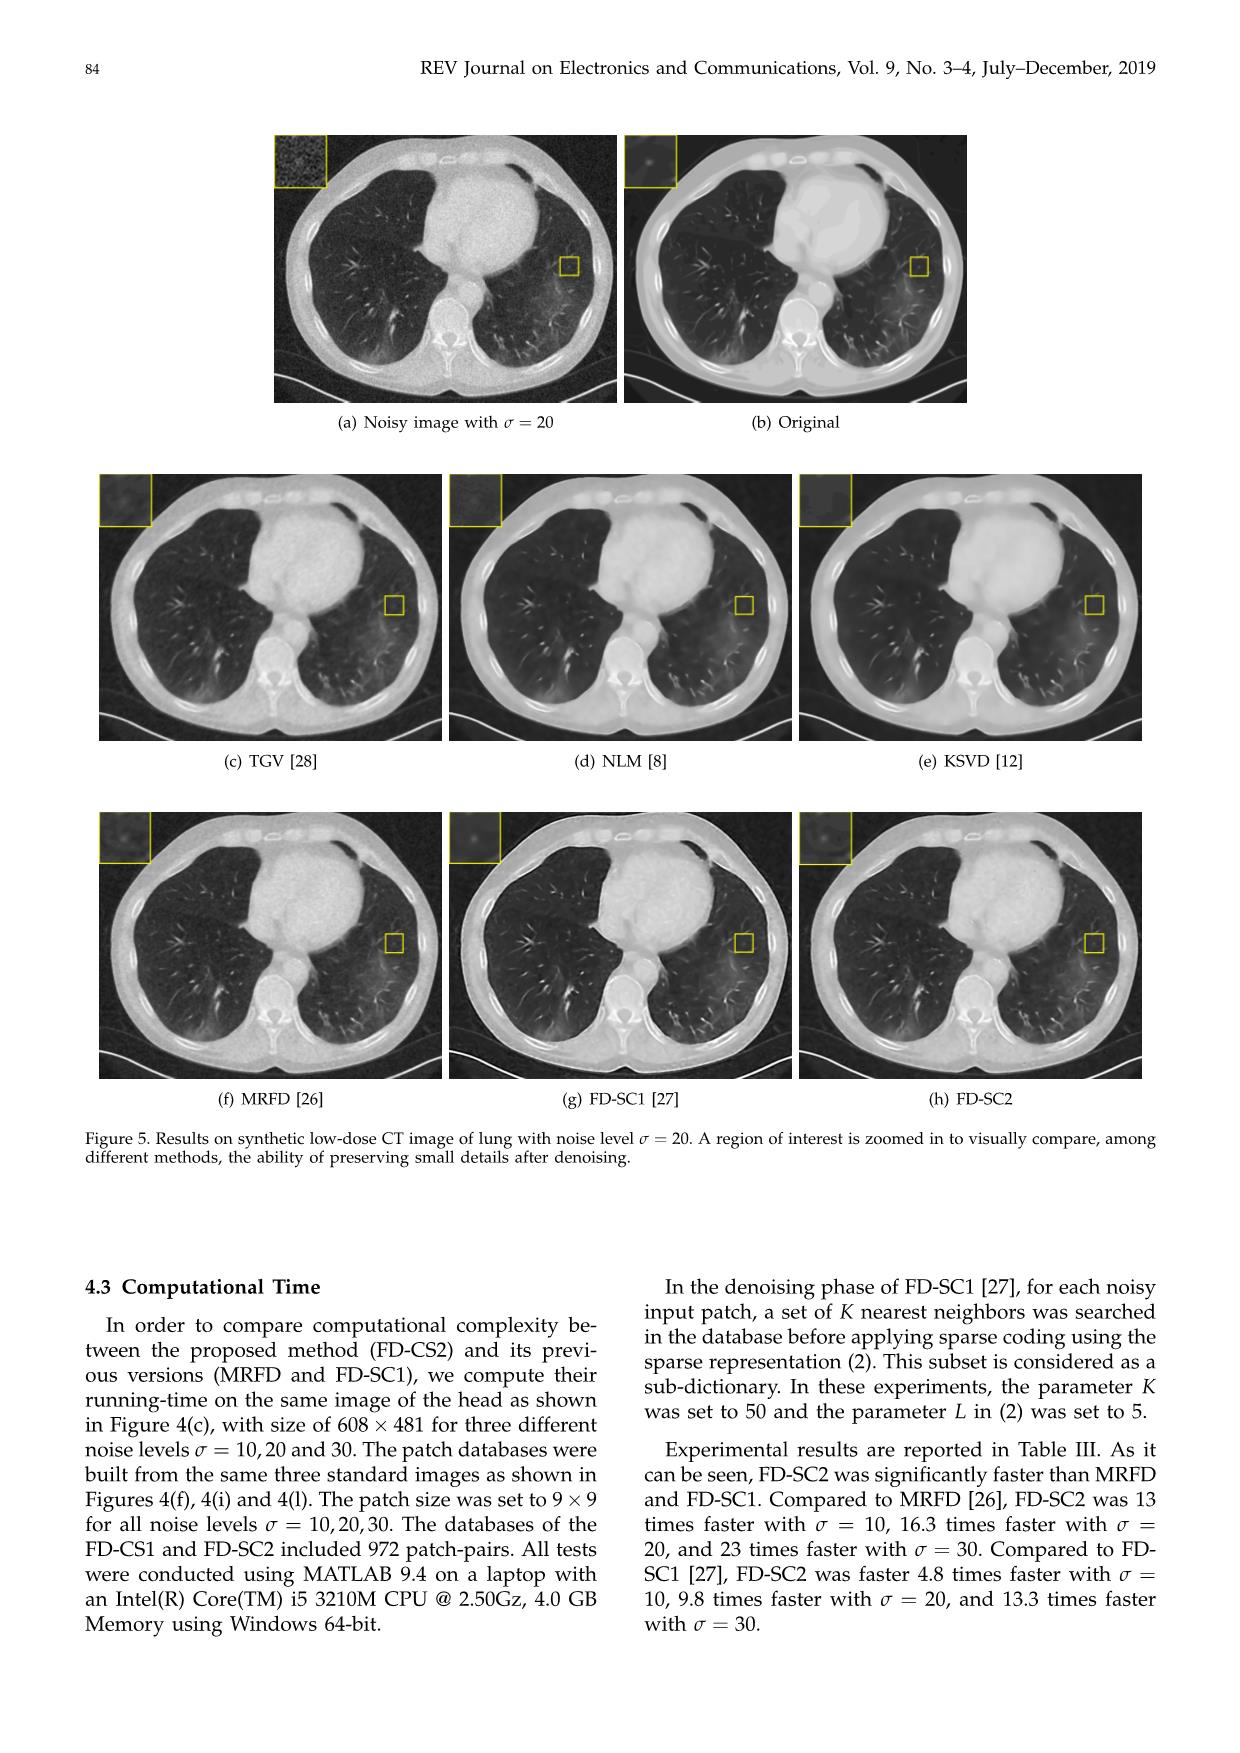
 (a) Low-dose CT image (b) Normal-dose CT image
 (a) Low-dose CT image (b) Normal-dose CT image
 (c) TGV [28] (d) NLM [8] (e) KSVD [12]
 (c) TGV [28] (d) NLM [8] (e) KSVD [12]
 (f)(f) MRFD MRFD [26] (g) FD-SC1(g) FD-SC1 [27] [27] (h) FD-SC2(h) FD-SC2
 FigureFigure 6. Denoising6. Denoising result result on aon real a real low-dose low-dose lung lung CT image CT image including including one nodule one nodule at position at position (X=190, (X=190, Y=394). Y=394).
 Table III
 Table III test images given in Figure 4 with three noise levels
RunningRunning-time-time comparison comparison of ofMRFD,MRFD, FD-SC1 FD-SC1andandFD-SC2FD-SC2whenwhen and PSNR, are used to analyze the influence of the
 denoising the head image in Figure 4(c)(size 608 481) with σ = 10, 20, and 30.
 denoising the head image in Figure 4(c)(size 608× 481) with parameters. Experiments were conducted on the three
 noisenoise levels levelsσ =σ 10,= 10, 20 20andand3030 (running (running-time-time is is given given× in in seconds)
 seconds). test images given in Figure 4 with three noise levels
 σ = 10, 20, and 30.
 γ
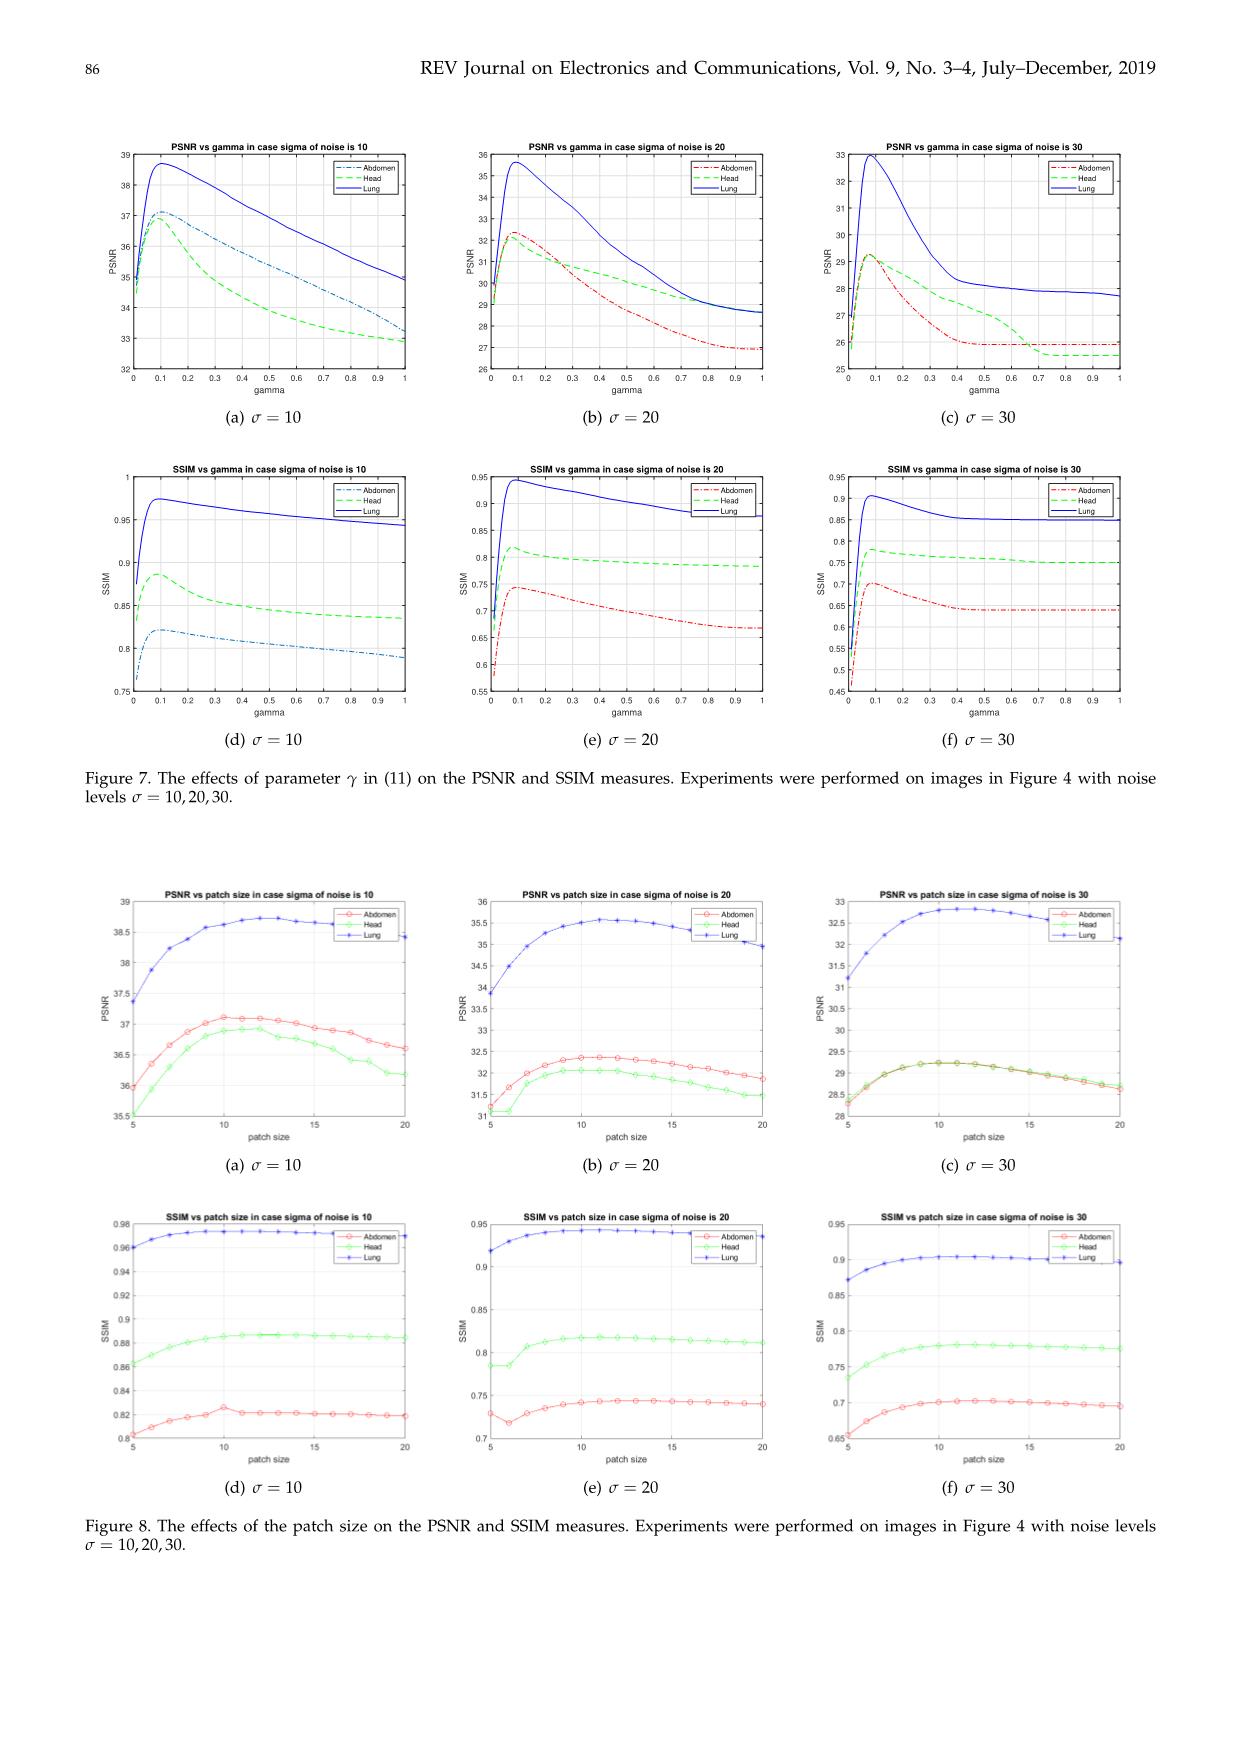
 Noise level MRFD [26] FD-SC1 [27] FD-SC2 To seeTo the see effect the effect of , of weγ performed, we performed experiments experiments with with
 γ = 0.01, 0.02, . . . , 1.0, and the patch size is fixed at 11
 σ = 10 129.00 46.90 9.63 γ = 0.01, 0.02, . . . , 1.0, and the patch size is fixed at 11
 11. The results, as shown in Figure 7, indicate that the×
 σ = 20 78.13 46.77 4.78 11. The results, as shown in Figure 7, indicate that the×
 optimal value of γ approximately was 0.09 for all three
 optimal value of γ approximately was 0.09 for all three
 σ = 30 86.41 46.90 3.73 noise levels. It means that the optimal value of γ is less
 sensitivenoise to levels. noise. It means that the optimal value of γ is less
 sensitive to noise.
4.4 Empirical Study on Parameters
 4.4 Empirical Study on Parameters Figure 8 shows the effect of the patch size. We
 In this subsection, we present the effect of the thresh- Figureperformed 8 shows experiments the effect with of different the patch patch size. sizes, We from
oldIn parameter this subsection,ε in (25) we and present the patch the effect size of√ then thresh-√n performed5 5 to experiments 20 20 while with keeping differentγ patchin these sizes, experiments from
 × ×
onold the parameter performanceε in of(11) the and proposed the patch method size √× (FD-n √n 5 constant5 to 20 at20 0.09. while Visually, keeping theγ in optimal these experiments patch size in the
 ×
CS2).on the Two performance well-known ofimage the quality proposed metrics, method SSIM (FD- constant× the proposed at× 0.09. Visually, method the (FD-SC2) optimal can patch be size determined in the as
andCS2). PSNR, Two are well-known used to analyze image the quality influence metrics, of the SSIM the11 proposed11. method (FD-SC2) can be determined as
parameters. Experiments were conducted on the three 11 11.×
 ×
86 REV Journal on Electronics and Communications, Vol. 9, No. 3–4, July–December, 2019
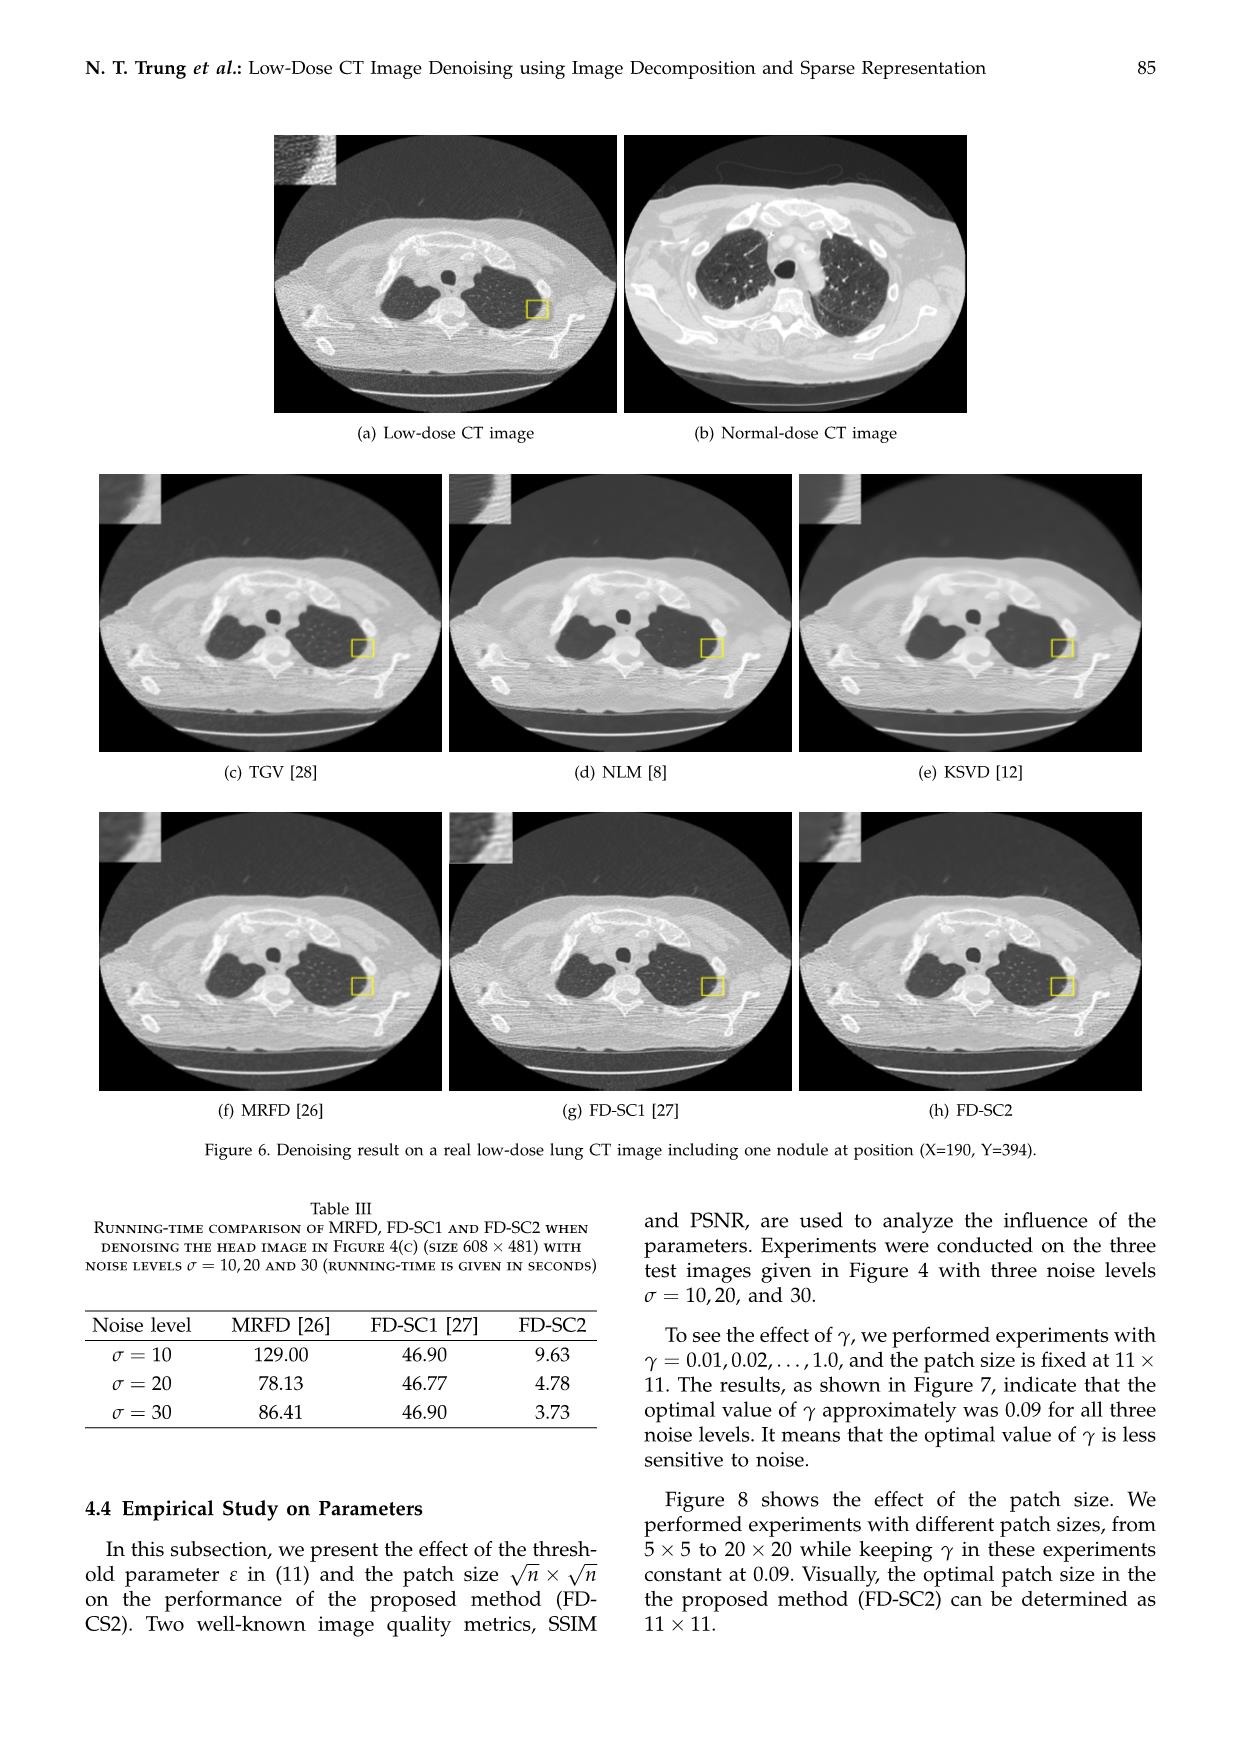
 PSNR vs gamma in case sigma of noise is 10 PSNR vs gamma in case sigma of noise is 20 PSNR vs gamma in case sigma of noise is 30
 39 36 33
 Abdomen Abdomen Abdomen
 35
 Head Head 32 Head
 38 Lung Lung Lung
 34
 31
 37 33
 30
 32
 36
 31 29
 PSNR 35 PSNR PSNR
 30
 28
 34 29
 27
 28
 33 26
 27
 32 26 25
 0 0.1 0.2 0.3 0.4 0.5 0.6 0.7 0.8 0.9 1 0 0.1 0.2 0.3 0.4 0.5 0.6 0.7 0.8 0.9 1 0 0.1 0.2 0.3 0.4 0.5 0.6 0.7 0.8 0.9 1
 gamma gamma gamma
 (a) σ = 10 (b) σ = 20 (c) σ = 30
 SSIM vs gamma in case sigma of noise is 10 SSIM vs gamma in case sigma of noise is 20 SSIM vs gamma in case sigma of noise is 30
 1 0.95 0.95
 Abdomen Abdomen Abdomen
 0.9
 Head 0.9 Head Head
 Lung Lung Lung
 0.95 0.85
 0.85
 0.8
 0.8
 0.9 0.75
 0.75 0.7
 SSIM SSIM SSIM
 0.85 0.65
 0.7
 0.6
 0.65
 0.8 0.55
 0.6
 0.5
 0.75 0.55 0.45
 0 0.1 0.2 0.3 0.4 0.5 0.6 0.7 0.8 0.9 1 0 0.1 0.2 0.3 0.4 0.5 0.6 0.7 0.8 0.9 1 0 0.1 0.2 0.3 0.4 0.5 0.6 0.7 0.8 0.9 1
 gamma gamma gamma
 (d) σ = 10 (e) σ = 20 (f) σ = 30
Figure 7. The effects of parameter γ in (11) on the PSNR and SSIM measures. Experiments were performed on images in Figure 4 with noise
levels σ = 10, 20, 30.
 (a) σ = 10 (b) σ = 20 (c) σ = 30
 (d) σ = 10 (e) σ = 20 (f) σ = 30
Figure 8. The effects of the patch size on the PSNR and SSIM measures. Experiments were performed on images in Figure 4 with noise levels
σ = 10, 20, 30.
N. T. Trung et al.: Low-Dose CT Image Denoising using Image Decomposition and Sparse Representation 87
5 Conclusions ies,” IEEE Transactions on Image processing, vol. 15, no. 12,
 pp. 3736–3745, 2006.
This paper has presented an effective denoising method [13] J. Mairal, F. Bach, J. Ponce, G. Sapiro, and A. Zisserman,
for low-dose CT images. The proposed method, re- “Non-local sparse models for image restoration,” in
 Proceedings of the IEEE 12th International Conference on
ferred to as FD-SC2, was developed based on the Computer Vision. IEEE, 2009, pp. 2272–2279.
assumption that noise mainly lies in the medium [14] W. Dong, L. Zhang, G. Shi, and X. Li, “Nonlocally
and high frequency components. Thus, a noisy image centralized sparse representation for image restoration,”
is decomposed into three component images of low, IEEE Transactions on Image Processing, vol. 22, no. 4, pp.
medium and high frequency bands, and then denoising 1620–1630, 2013.
 [15] K. Dabov, A. Foi, V. Katkovnik, and K. Egiazarian, “Im-
is processed on the medium and high frequency com- age denoising by sparse 3-D transform-domain collab-
ponent images. Moreover, inspired by recent success of orative filtering,” IEEE Transactions on Image Processing,
learning-based methods, we have also exploited useful vol. 16, no. 8, pp. 2080–2095, 2007.
and available information from normal-dose CT images [16] ——, “BM3D image denoising with shape-adaptive
in FD-SC2. Useful information from the database of principal component analysis,” in Proceedings of the
 SPARS’09-Signal Processing with Adaptive Sparse Struc-
standard CT images is mined based on a sparse rep- tured Representations, 2009.
resentation model. The effectiveness of the proposed [17] D. Kang, P. J. Slomka, R. Nakazato, J. Woo, D. S. Berman,
method was verified through experimental results. FD- C. J. Kuo, and D. Dey, “Image denoising of low-radiation
SC2 can effectively reduce noise while preserving well dose coronary CT angiography by an adaptive block-
subtle image details as well as the nature of image. In matching 3D algorithm,” in Proceedings of the Medical
 Imaging 2013: Image Processing, 2013, p. 86692G.
future works, we will study the problem of patch dictio- [18] D. H. Trinh, M. Luong, J.-M. Rocchisani, C. D. Pham, and
nary optimization for sparse coding. Moreover, we will F. Dibos, “Medical image denoising using kernel ridge
also seek a better solution for the image decomposition. regression,” in Proceedings of the 18th IEEE International
 Conference on Image Processing (ICIP), 2011, pp. 1597–1600.
 [19] J. M. Wolterink, T. Leiner, M. A. Viergever, and I. Išgum,
References “Generative adversarial networks for noise reduction
 in low-dose CT,” IEEE Transactions on Medical Imaging,
 [1] G. Deng and L. Cahill, “An adaptive Gaussian filter for vol. 36, no. 12, pp. 2536–2545, 2017.
 noise reduction and edge detection,” in Nuclear Science [20] H. Chen, Y. Zhang, M. K. Kalra, F. Lin, Y. Chen, P. Liao,
 Symposium and Medical Imaging Conference, 1993 IEEE J. Zhou, and G. Wang, “Low-dose CT with a residual
 Conference Record. IEEE, 1993, pp. 1615–1619. encoder-decoder convolutional neural network,” IEEE
 [2] F. Jin, P. Fieguth, L. Winger, and E. Jernigan, “Adaptive Transactions on Medical Imaging, vol. 36, no. 12, pp. 2524–
 wiener filtering of noisy images and image sequences,” 2535, 2017.
 in Proceedings of the International Conference on Image [21] Q. Yang, P. Yan, Y. Zhang, H. Yu, Y. Shi, X. Mou, M. K.
 Processing, ICIP 2003, vol. 3. IEEE, 2003, pp. III–349. Kalra, Y. Zhang, L. Sun, and G. Wang, “Low dose CT
 [3] C. Tomasi and R. Manduchi, “Bilateral filtering for gray image denoising using a generative adversarial network
 and color images,” in Proceedings of the Sixth International with Wasserstein distance and perceptual loss,” IEEE
 Conference on Computer Vision. IEEE, 1998, pp. 839–846. Transactions on Medical Imaging, 2018.
 [4] L. I. Rudin, S. Osher, and E. Fatemi, “Nonlinear total [22] D. H. Trinh, M. Luong, J.-M. Rocchisani, C. D. Pham,
 variation based noise removal algorithms,” Physica D: H. D. Pham, and F. Dibos, “An optimal weight method
 Nonlinear Phenomena, vol. 60, no. 1-4, pp. 259–268, 1992. for CT image denoising,” Journal of Electronic Science and
 [5] C. S. Drapaca, “A nonlinear total variation-based denois- Technology, vol. 10, no. 2, pp. 124–129, 2012.
 ing method with two regularization parameters,” IEEE [23] D.-H. Trinh, M. Luong, F. Dibos, J.-M. Rocchisani, C.-D.
 Transactions on Biomedical Engineering, vol. 56, no. 3, pp. Pham, and T. Q. Nguyen, “Novel example-based method
 582–586, 2009. for super-resolution and denoising of medical images,”
 [6] K. Bredies, K. Kunisch, and T. Pock, “Total generalized IEEE Transactions on Image processing, vol. 23, no. 4, pp.
 variation,” SIAM Journal on Imaging Sciences, vol. 3, no. 3, 1882–1895, 2014.
 pp. 492–526, 2010. [24] Y. Chen, X. Yin, L. Shi, H. Shu, L. Luo, J.-L. Coatrieux,
 [7] F. Knoll, K. Bredies, T. Pock, and R. Stollberger, “Sec- and C. Toumoulin, “Improving abdomen tumor low-
 ond order total generalized variation (TGV) for MRI,” dose CT images using a fast dictionary learning based
 Magnetic resonance in medicine, vol. 65, pp. 480–491, 2011. processing,” Physics in Medicine & Biology, vol. 58, no. 16,
 [8] A. Buades, B. Coll, and J.-M. Morel, “A non-local algo- p. 5803, 2013.
 rithm for image denoising,” in IEEE Computer Society [25] Y. Chen, L. Shi, Q. Feng, J. Yang, H. Shu, L. Luo,
 Conference on Computer Vision and Pattern Recognition J. Coatrieux, and W. Chen, “Artifact suppressed dictio-
 (CVPR), vol. 2, 2005, pp. 60–65. nary learning for low-dose CT image processing,” IEEE
 [9] Z. Li, L. Yu, J. D. Trzasko, D. S. Lake, , D. J. Blezek, Transactions on Medical Imaging, vol. 33, no. 12, pp. 2271–
 J. G. Fletcher, and C. H. McCollough, “Adaptive nonlocal 2292, 2014.
 means filtering based on local noise level for CT denois- [26] D. H. Trinh, N. Linh-Trung, and T.-T. Nguyen, “An
 ing,” Medical Physics, vol. 41, no. 1, p. 011908, 2014. effective example-based denoising method for CT im-
[10] M. Green, E. M. Marom, N. Kiryati, E. Konen, and ages using Markov random field,” in Proceedings of the
 A. Mayer, “Efficient low-dose CT denoising by locally- International Conference on Advanced Technologies for Com-
 consistent non-local means (LC-NLM),” in Proceedings munications (ATC 2014), 2014, pp. 355–359.
 of the Medical Image Computing and Computer-Assisted [27] T.-T. Nguyen, D.-H. Trinh, and N. Linh-Trung, “An
 Intervention - MICCAI 2016, Part III, 2016, pp. 423–431. efficient example-based method for CT image denoising
[11] M. Aharon, M. Elad, and A. Bruckstein, “K-SVD: An based on frequency decomposition and sparse represen-
 algorithm for designing overcomplete dictionaries for tation,” in International Conference on Advanced Technolo-
 sparse representation,” IEEE Transactions on Signal Pro- gies for Communications (ATC), 2016, pp. 293–296.
 cessing, vol. 54, no. 11, pp. 4311–4322, 2006. [28] K. Bredies, K. Kunisch, and T. Pock, “Total generalized
[12] M. Elad and M. Aharon, “Image denoising via sparse variation,” SIAM Journal on Imaging Sciences, vol. 3, no. 3,
 and redundant representations over learned dictionar- pp. 492–526, 2010.
88 REV Journal on Electronics and Communications, Vol. 9, No. 3–4, July–December, 2019
[29] Z. Wang, A. C. Bovik, H. R. Sheikh, and E. P. Simoncelli, Nguyen Linh Trung obtained his B.Eng. and
 “Image quality assessment: from error visibility to struc- Ph.D. degrees, both in Electrical Engineering,
 tural similarity,” IEEE Transactions on Image Processing, from Queensland University of Technology,
 vol. 13, no. 4, pp. 600–612, 2004. Brisbane, Australia. Since 2006, he has been
 on the faculty of University of Engineering
 and Technology, a member university of Viet-
 nam National University, Hanoi, where he
 is currently an associate professor of elec-
 Nguyen Thanh Trung received his B.Eng. tronic engineering in the Faculty of Electronics
 degree in Electronics and Telecommunications and Telecommunications and director of the
 from the Faculty of Technology, Vietnam Na- Advanced Institute of Engineering and Tech-
 tional University, Hanoi, Vietnam in 2003, M.S. nology. He is interested in signal processing methods, including
 degree in electronics engineering from Uni- time-frequency signal analysis, blind source separation, compressive
 versity of Engineering and Technology, Viet- sampling, tensor-based signal analysis, graph signal processing, and
 nam National University, Hanoi, Vietnam in apply them to wireless communication and networking, biomedical
 2012. He is now a Phd student at VNU-UET engineering, with a current focus on large-scale processing.
 and a lecturer at the Faculty of Electronics
 and Communication, University of Informa-
 tion and Communication Technology, Thain-
guyen University, Vietnam. His research interests include biomedical
signal and image processing,sparse coding, machine learning. Marie Luong received the Engineer Diploma
 degree from the Ecole Nationale Supérieure
 d’Electricité et de Mécanique de Nancy,
 France, and the Ph.D. degree in Auto-
 matic, Diagnosis, Signal processing from the
 Trinh Dinh Hoan received the B.S. degree L’Institut National Polytechnique de Lorraine
 in mathematics education from the Vietnam (Lorraine University), France, in 1991 and
 National University, Hanoi, the M.S. degree 1996, respectively. She is currently an Asso-
 in mathematics from the Hanoi Institute of ciate Professor with the Université Paris 13,
 Mathematics, and the Ph.D. degree in signal Sorbonne Paris Cité, France. Her research in-
 and image processing from the Laboratoire terests include image restoration, superresolu-
 Analyse, Géométrie et Applications, Univer- tion, segmentation, watermarking, and medical imaging.
 sité Paris 13, Sorbonne Paris Cité, France,
 in 2005, 2008, and 2013, respectively. He is
 currently a Researcher with the Signals and
 Systems Laboratory, Université de Lorraine
and CNRS, CRAN UMR 7039, 2 avenue de la Forêt de Haye, 54518
Vandœuvre-Lès-Nancy Cedex, France. His research interests include
image restoration, super resolution, segmentation, sparse coding,
machine learning, optimization, and medical imaging.
File đính kèm:
 low_dose_ct_image_denoising_using_image_decomposition_and_sp.pdf

