Impacts of labor migration on structural change of rural labor in Trieu Son district of Thanh Hoa province in Vietnam
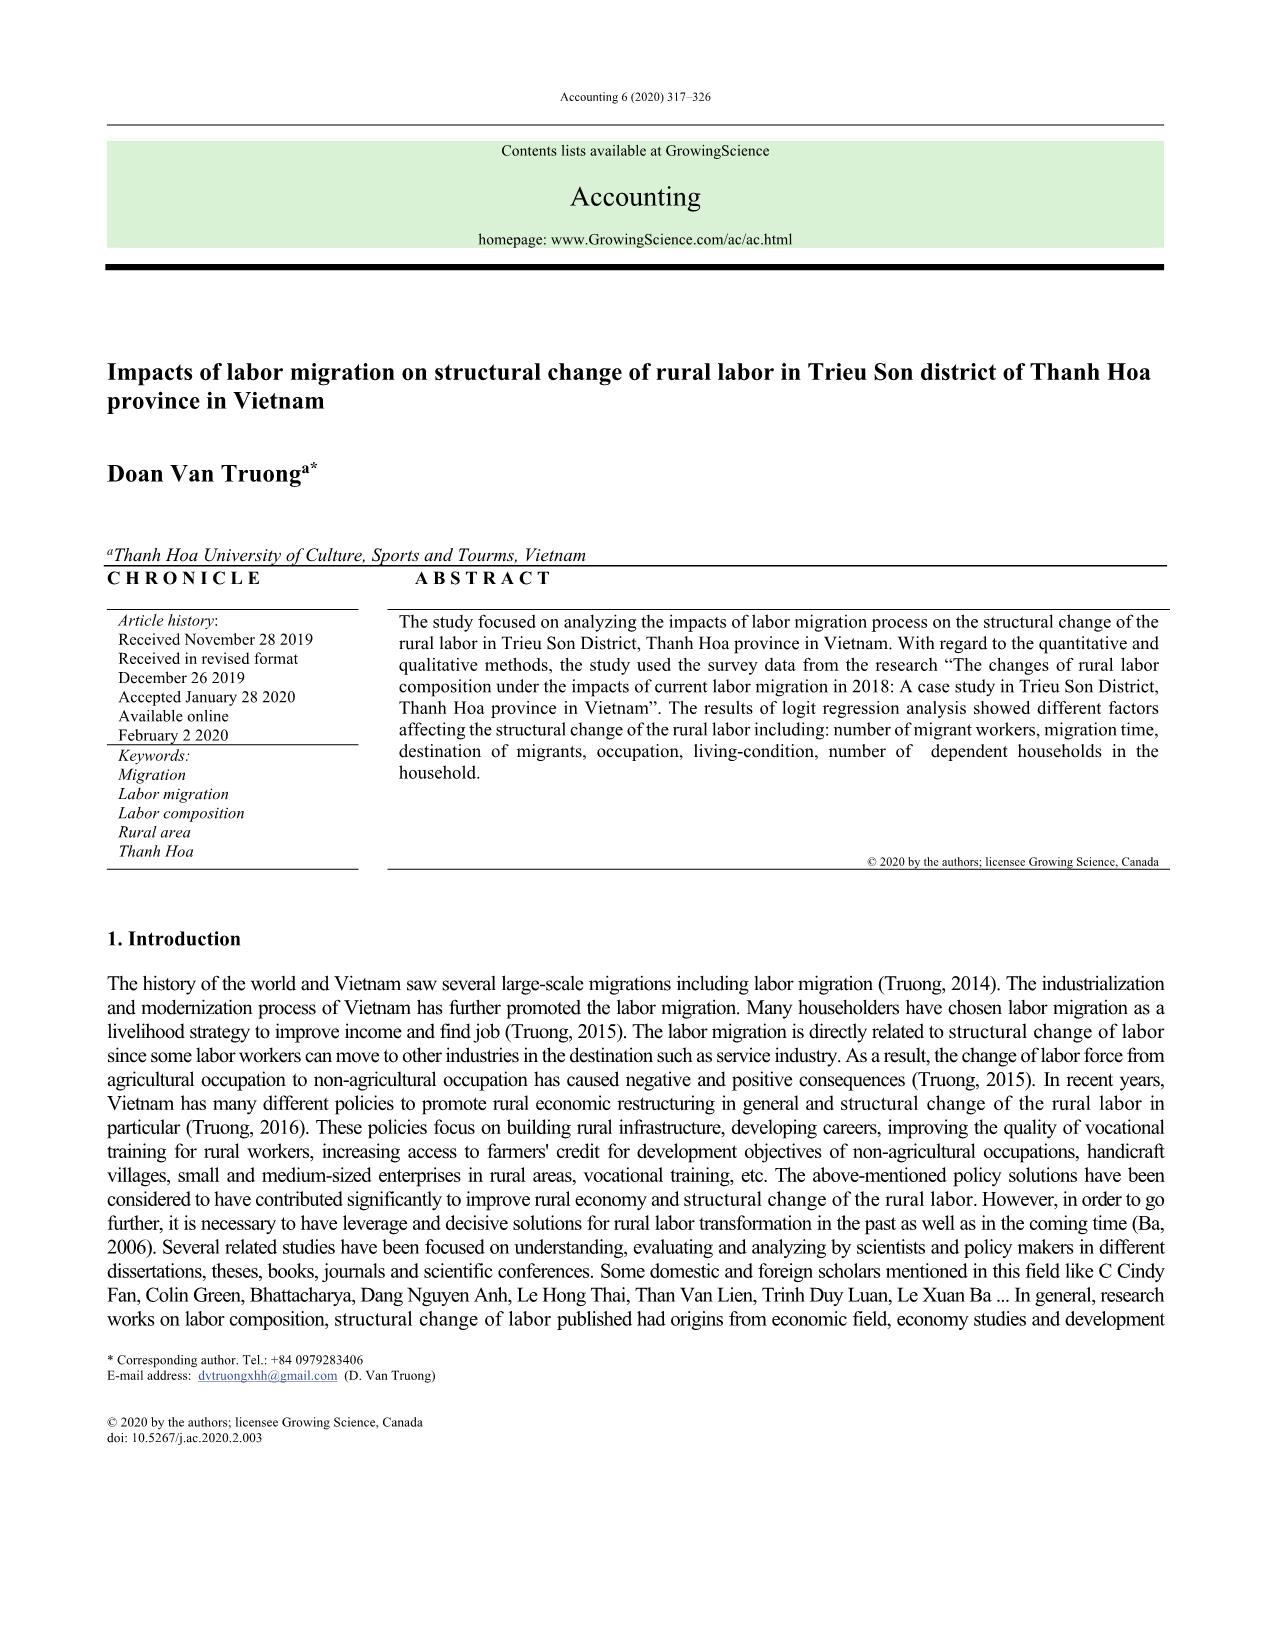
The study focused on analyzing the impacts of labor migration process on the structural change of the rural labor in Trieu Son District, Thanh Hoa province in Vietnam. With regard to the quantitative and qualitative methods, the study used the survey data from the research “The changes of rural labor composition under the impacts of current labor migration in 2018: A case study in Trieu Son District, Thanh Hoa province in Vietnam”. The results of logit regression analysis showed different factors affecting the structural change of the rural labor including: number of migrant workers, migration time, destination of migrants, occupation, living-Condition, number of dependent households in the household
Trang 1
Trang 2
Trang 3
Trang 4
Trang 5
Trang 6
Trang 7
Trang 8
Trang 9
Trang 10
Tóm tắt nội dung tài liệu: Impacts of labor migration on structural change of rural labor in Trieu Son district of Thanh Hoa province in Vietnam
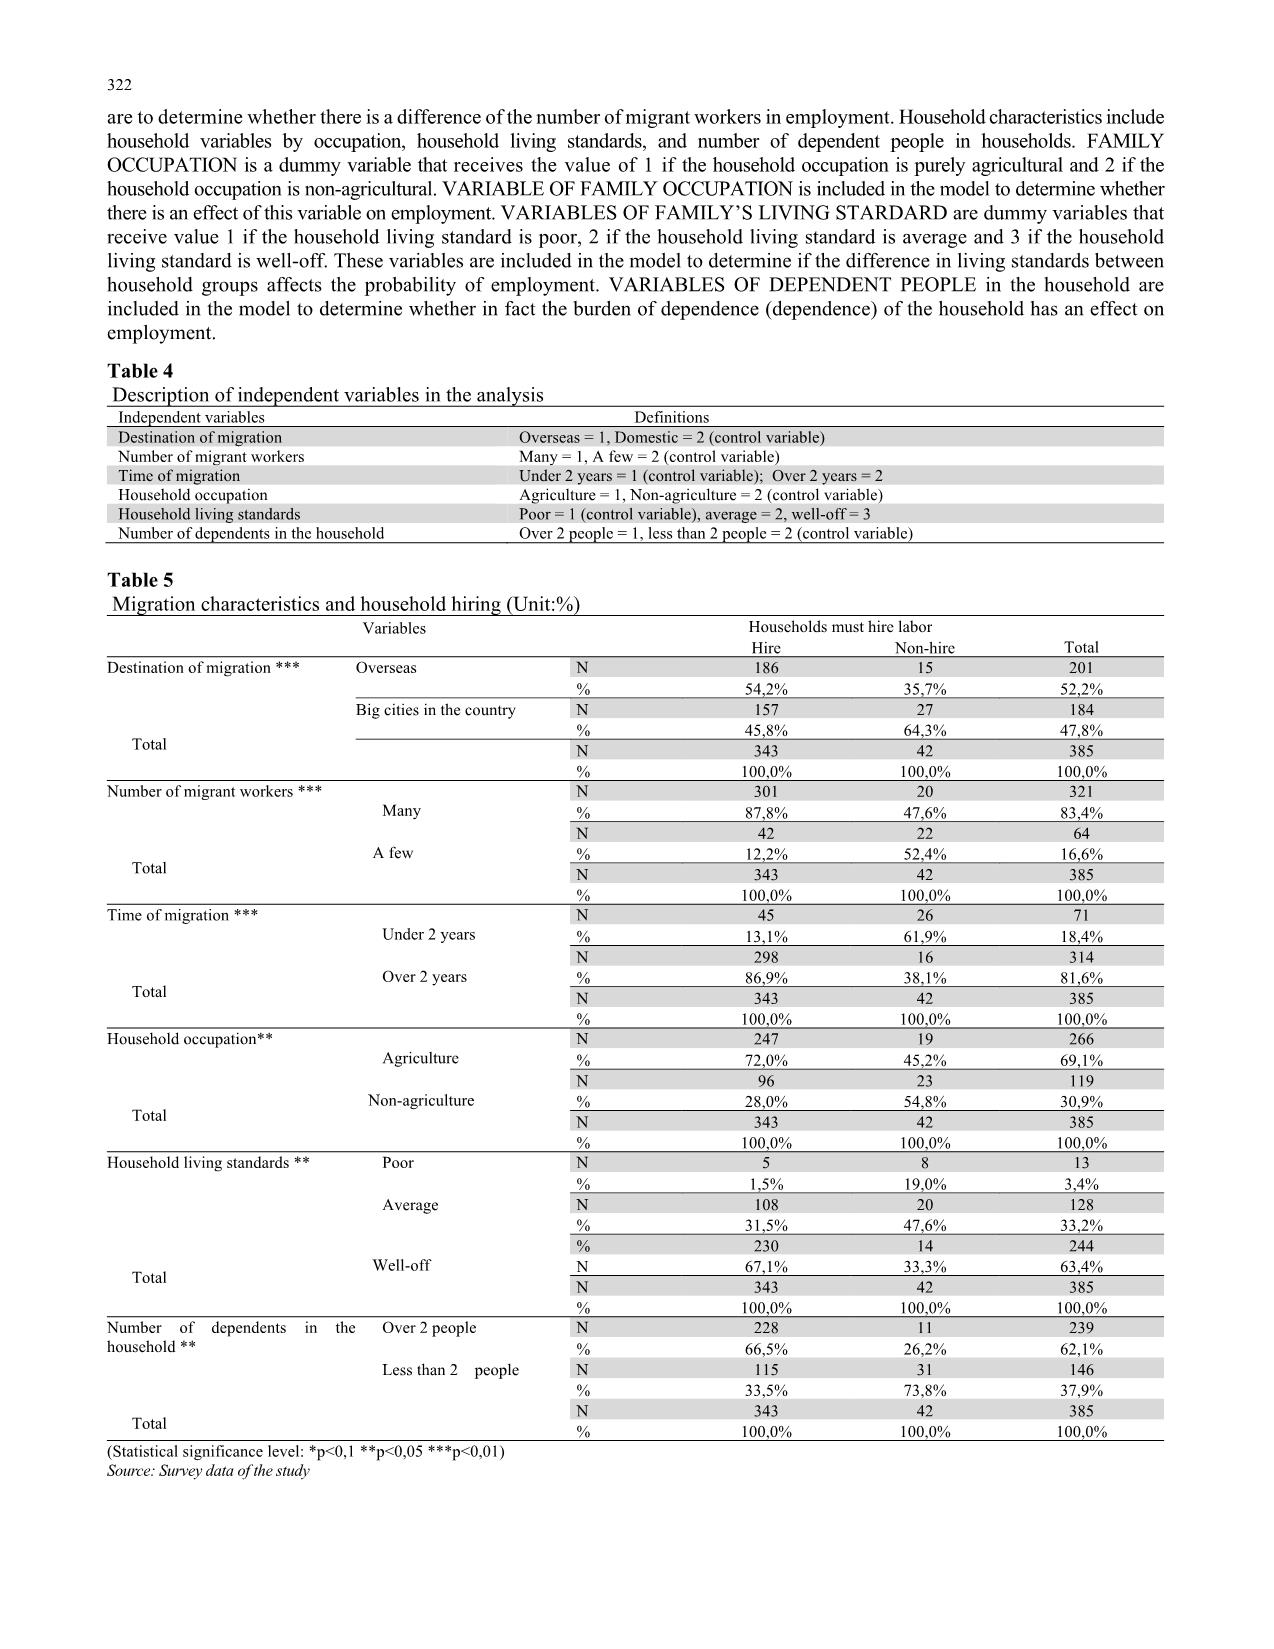
n variables through the correlation analysis between them and dependent variables. The necessary condition
in this analysis step is that if the independent variable is not correlated with the dependent variable, we exclude this independent
variable from the regression model. The results of our study indicated the correlation among independent variables. However,
based on VIF when performing multivariate regression, VIF (variance inflation factor) <2 does not occur in the collinearity case.
On the other hand, when considering the Tolerance value with the formula Tolerance = 1/VIF. Tolerance is greater than 0.5, so no
multicollinearity takes place. As shown in Tables 6 and 7 below about the results of correlation analysis between independent and
dependent variables through the correlation matrix. It can be seen that the household hiring variable was positively correlated with
the time of migration and the number of dependents in the household. On the contrary, Among the household living standard
variables and the hiring variables were negatively related. The overall assessment of the correlation analysis results reveal the
variables were related to one another that being included in the model to explain for the dependent variable.
Table 6
 Correlation matrix between factors of migration characteristics and household hiring
 Destination place Time of migration Number of migrants Hiring labor in the harvest
Destination place Pearson Correlation 1 ,240** -,246s ,116*
Sig. ,000 ,000 ,023
N 385 385 385 385
Time of migration Pearson Correlation ,240** 1 -,237** ,392**
Sig. ,000 ,000 ,000
N 385 385 385 385
Number of migrants Pearson Correlation -,246** -,237** 1 ,336**
Sig. ,000 ,000 ,000
N 385 385 385 385
 Hiring labor in the harvest Pearson Correlation ,116* ,392** ,336** 1
Sig. ,023 ,000 ,000
N 385 385 385 385
(Statistical significance level: *p<0,1 **p<0,05 ***p<0,01)
Source: Survey data of the study
Table 7
 Correlation matrix between household characteristics and hiring labor
Households
occupation
Living standard of
households
Number of dependents
in the household
Hiring labor in the
harvest
Household occupation Pearson Correlation 1 -,075 ,056 ,181**
Sig. ,142 ,269 ,000
N 385 385 385 385
Living standard of household Pearson Correlation -,075 1 -,653** -,288**
Sig. ,142 ,000 ,000
N 385 385 385 385
Number of dependents in the
household
Pearson Correlation ,056 -,653** 1 ,259**
Sig. ,269 ,000 ,000
N 385 385 385 385
Hiring labor in the harvest Pearson Correlation ,181** -,288** ,259** 1
Sig. ,000 ,000 ,000
N 385 385 385 385
(Statistical significance level: *p<0,1 **p<0,05 ***p<0,01)
Source: Survey data of the study
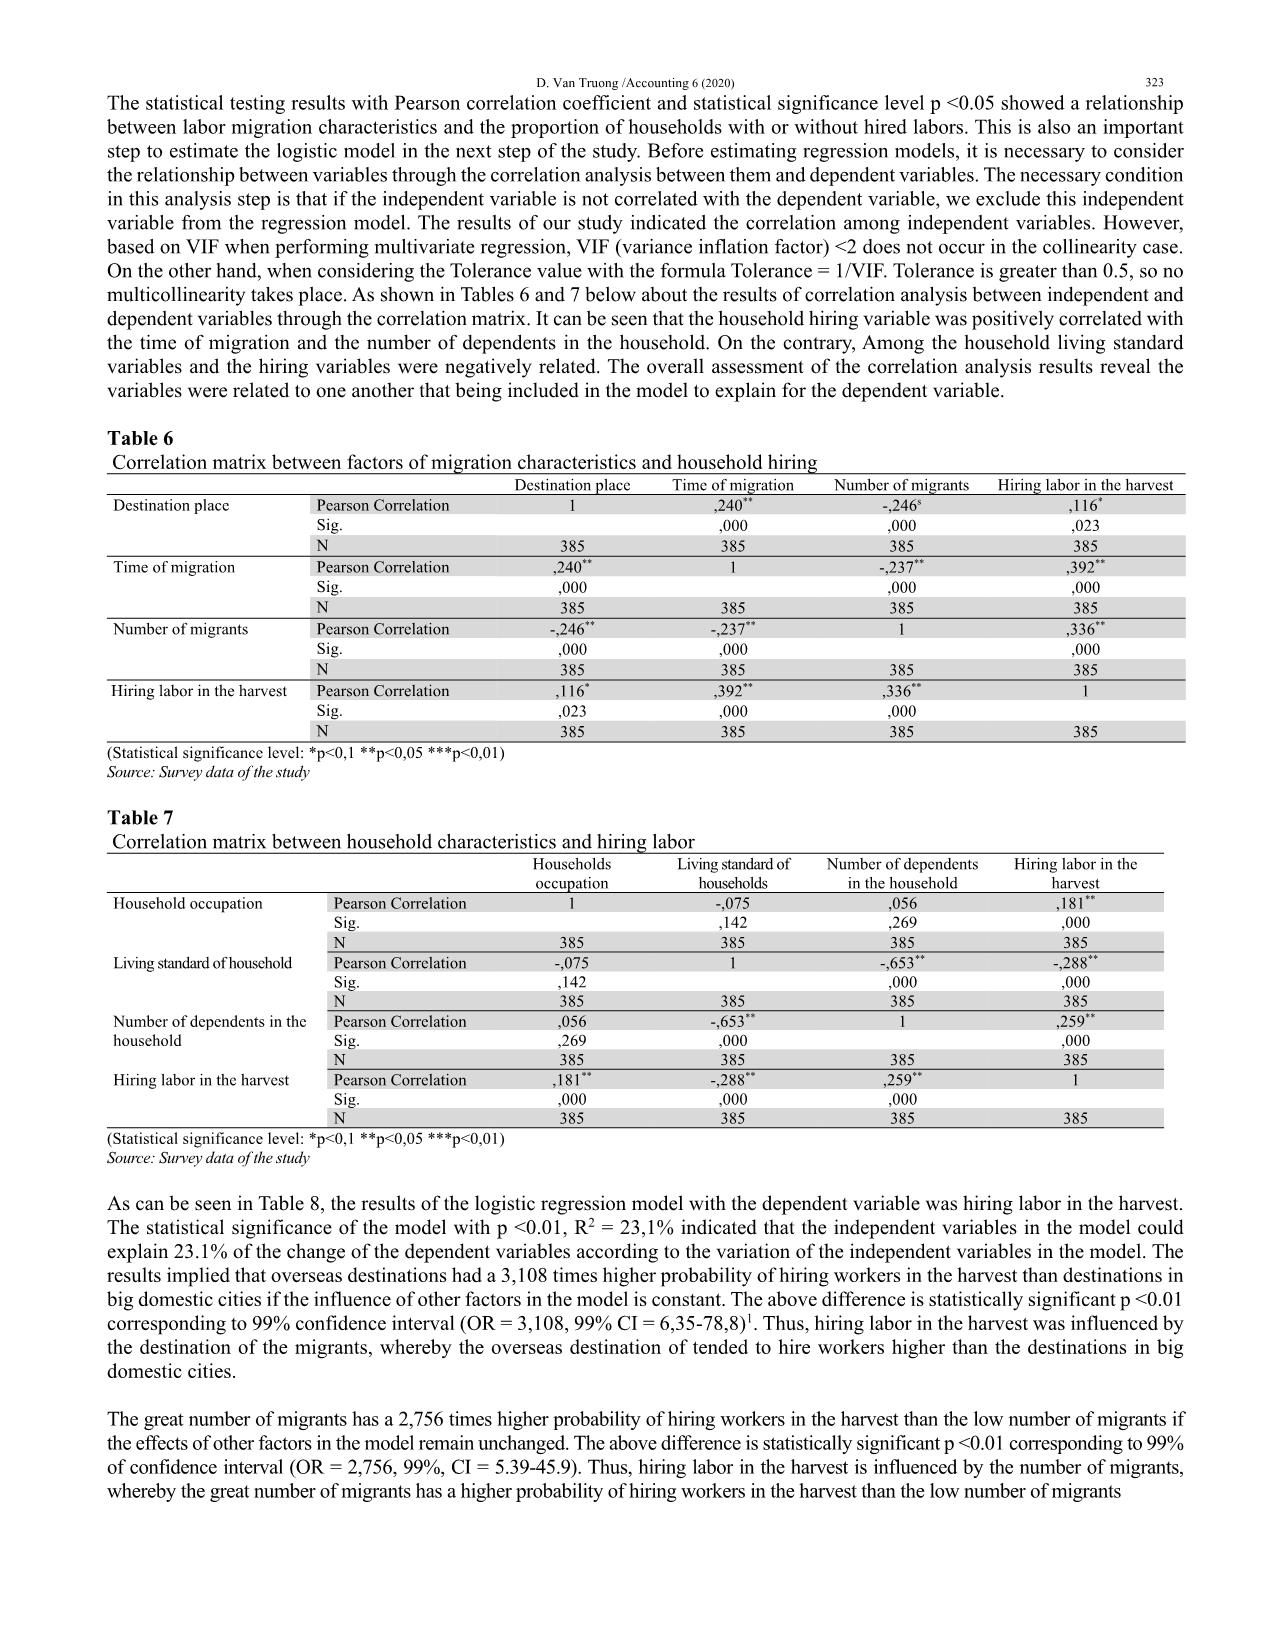
As can be seen in Table 8, the results of the logistic regression model with the dependent variable was hiring labor in the harvest.
The statistical significance of the model with p <0.01, R2 = 23,1% indicated that the independent variables in the model could
explain 23.1% of the change of the dependent variables according to the variation of the independent variables in the model. The
results implied that overseas destinations had a 3,108 times higher probability of hiring workers in the harvest than destinations in
big domestic cities if the influence of other factors in the model is constant. The above difference is statistically significant p <0.01
corresponding to 99% confidence interval (OR = 3,108, 99% CI = 6,35-78,8)1. Thus, hiring labor in the harvest was influenced by
the destination of the migrants, whereby the overseas destination of tended to hire workers higher than the destinations in big
domestic cities.
The great number of migrants has a 2,756 times higher probability of hiring workers in the harvest than the low number of migrants if
the effects of other factors in the model remain unchanged. The above difference is statistically significant p <0.01 corresponding to 99%
of confidence interval (OR = 2,756, 99%, CI = 5.39-45.9). Thus, hiring labor in the harvest is influenced by the number of migrants,
whereby the great number of migrants has a higher probability of hiring workers in the harvest than the low number of migrants
 324
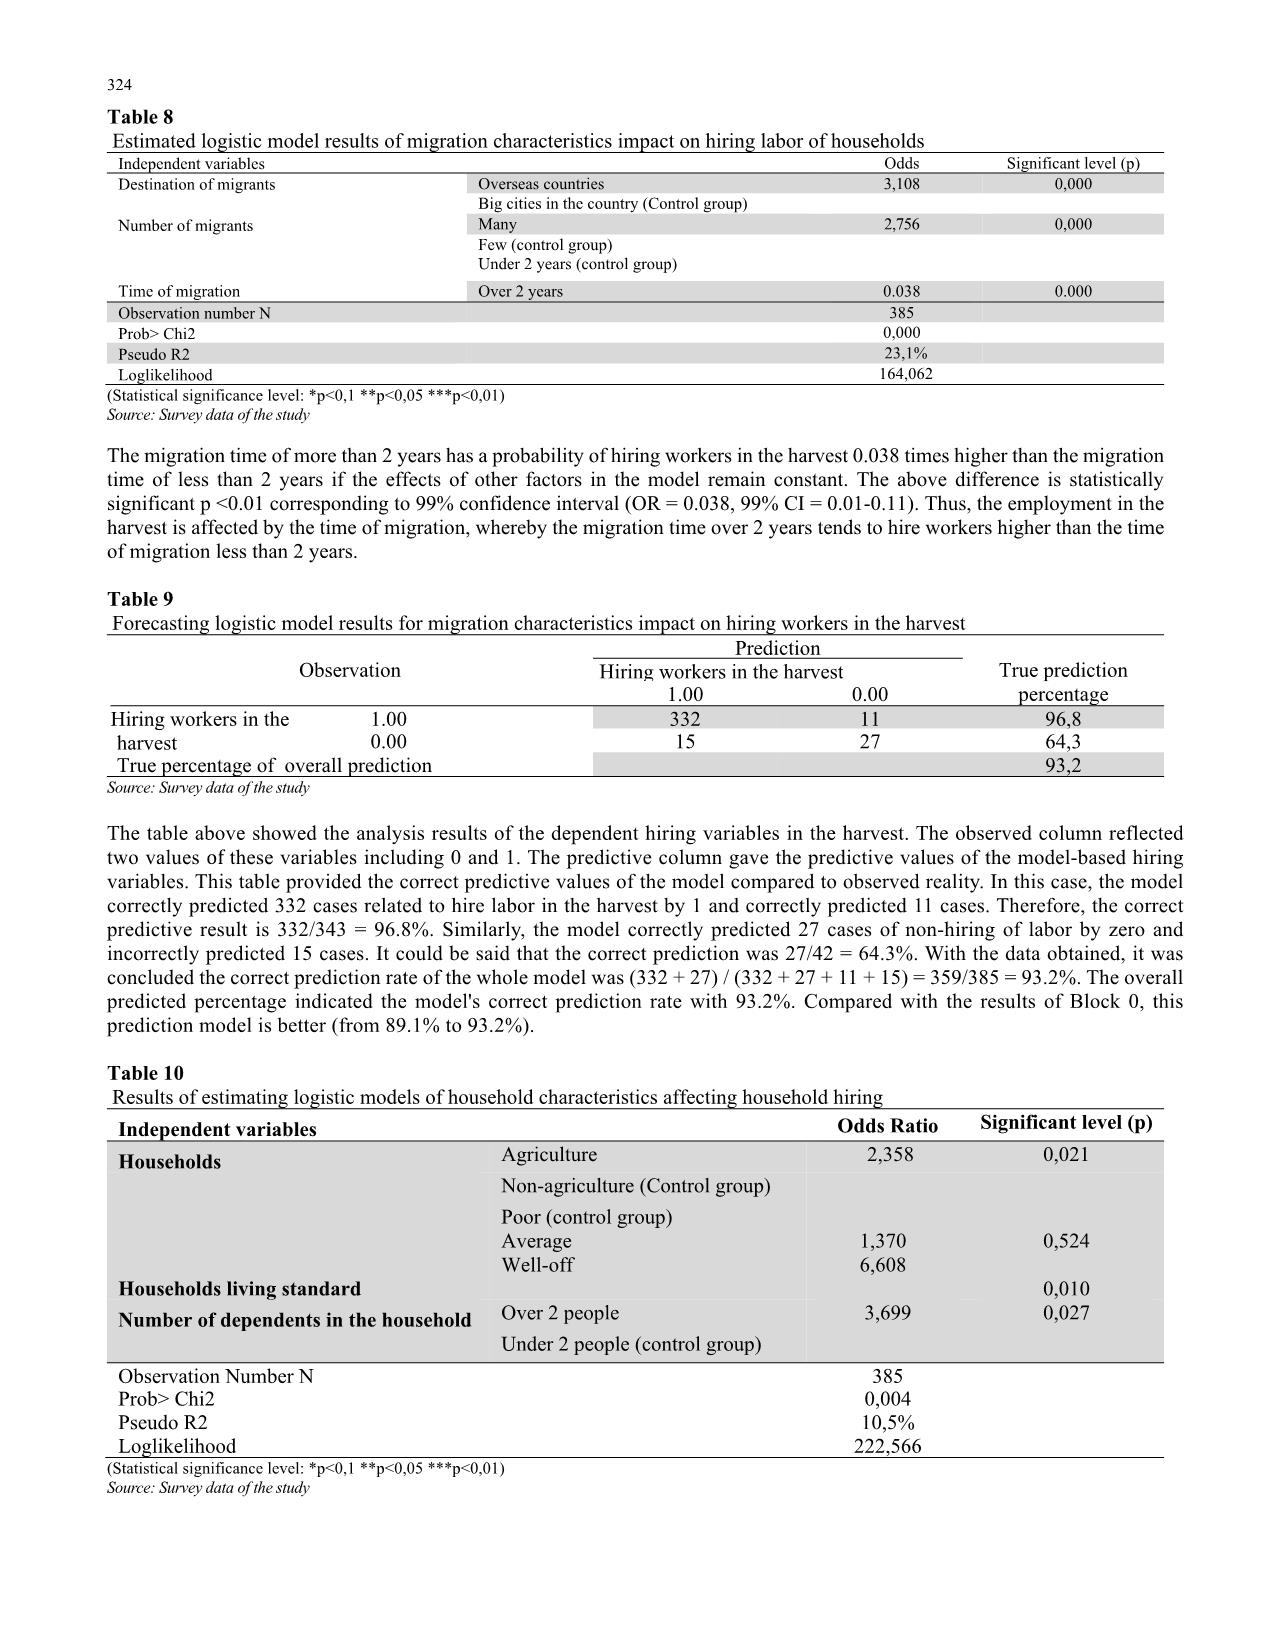
Table 8
 Estimated logistic model results of migration characteristics impact on hiring labor of households
Independent variables Odds Significant level (p)
Destination of migrants Overseas countries 3,108 0,000
 Big cities in the country (Control group)
Number of migrants Many 2,756 0,000
Few (control group)
Under 2 years (control group)
Time of migration Over 2 years 0.038 0.000
Observation number N
385
Prob> Chi2
0,000
Pseudo R2
 23,1%
Loglikelihood
 164,062
(Statistical significance level: *p<0,1 **p<0,05 ***p<0,01)
Source: Survey data of the study
The migration time of more than 2 years has a probability of hiring workers in the harvest 0.038 times higher than the migration
time of less than 2 years if the effects of other factors in the model remain constant. The above difference is statistically
significant p <0.01 corresponding to 99% confidence interval (OR = 0.038, 99% CI = 0.01-0.11). Thus, the employment in the
harvest is affected by the time of migration, whereby the migration time over 2 years tends to hire workers higher than the time
of migration less than 2 years.
Table 9
 Forecasting logistic model results for migration characteristics impact on hiring workers in the harvest
Observation
Prediction
True prediction
percentage
Hiring workers in the harvest
1.00 0.00
Hiring workers in the
harvest
1.00 332 11 96,8
0.00 15 27 64,3
True percentage of overall prediction 93,2
Source: Survey data of the study
The table above showed the analysis results of the dependent hiring variables in the harvest. The observed column reflected
two values of these variables including 0 and 1. The predictive column gave the predictive values of the model-based hiring
variables. This table provided the correct predictive values of the model compared to observed reality. In this case, the model
correctly predicted 332 cases related to hire labor in the harvest by 1 and correctly predicted 11 cases. Therefore, the correct
predictive result is 332/343 = 96.8%. Similarly, the model correctly predicted 27 cases of non-hiring of labor by zero and
incorrectly predicted 15 cases. It could be said that the correct prediction was 27/42 = 64.3%. With the data obtained, it was
concluded the correct prediction rate of the whole model was (332 + 27) / (332 + 27 + 11 + 15) = 359/385 = 93.2%. The overall
predicted percentage indicated the model's correct prediction rate with 93.2%. Compared with the results of Block 0, this
prediction model is better (from 89.1% to 93.2%).
Table 10
 Results of estimating logistic models of household characteristics affecting household hiring
Independent variables Odds Ratio Significant level (p)
Households Agriculture 2,358 0,021
 Non-agriculture (Control group)
Households living standard
Poor (control group)
Average
Well-off
 1,370
 6,608
0,524
0,010
Number of dependents in the household Over 2 people 3,699 0,027
 Under 2 people (control group)
Observation Number N
385
Prob> Chi2
0,004
Pseudo R2
10,5%
Loglikelihood
222,566
(Statistical significance level: *p<0,1 **p<0,05 ***p<0,01)
Source: Survey data of the study
D. Van Truong /Accounting 6 (2020) 325
It can be drawn out from the Table 10 that the results of the logistic regression model with the dependent variables were hiring labor in
the harvest. The statistical significant model with p <0.05, R2 = 10.5% said the independent variables in the model could explain 10.5%
of the change of the dependent variables according to the variation of the independent variables in the model. As for the results,
agricultural job has a 2.358 times higher probability of hiring workers than non-agricultural jobs if the effects of other factors in the model
remain constantly. The above difference is statistically significant with p <0.05 with 95% confidence interval (OR = 2,358, 95% CI =
1,14-4,89)2.
Thus, hiring labor in the harvest is influenced by household occupation, whereby agricultural jobs tend to hire workers higher than
non-farm jobs.
With respect to the estimating results of the logistic model, p of the household living standard is statistically significant with p
<0.05 corresponding to 95% of the confidence interval (OR = 6,608, 95% CI = 1.56-27,98). Thus, hiring of labor in the harvest
is affected by household living standards, whereby well-off households tend to have higher probability in hiring labor in the
harvest than average and poor households.
The number of dependents in a household affects the probability of hiring. Odd ratio is 3,699 times higher than that of households
with fewer dependents if the effects of other factors in the model remain constantly. The above difference is statistically
significant with p <0.05 with 95% confidence interval (OR = 3,699, 95% CI = 1.37-9.95). It can be believable that the trend of
hiring labor is influenced by the number of dependents in the household.
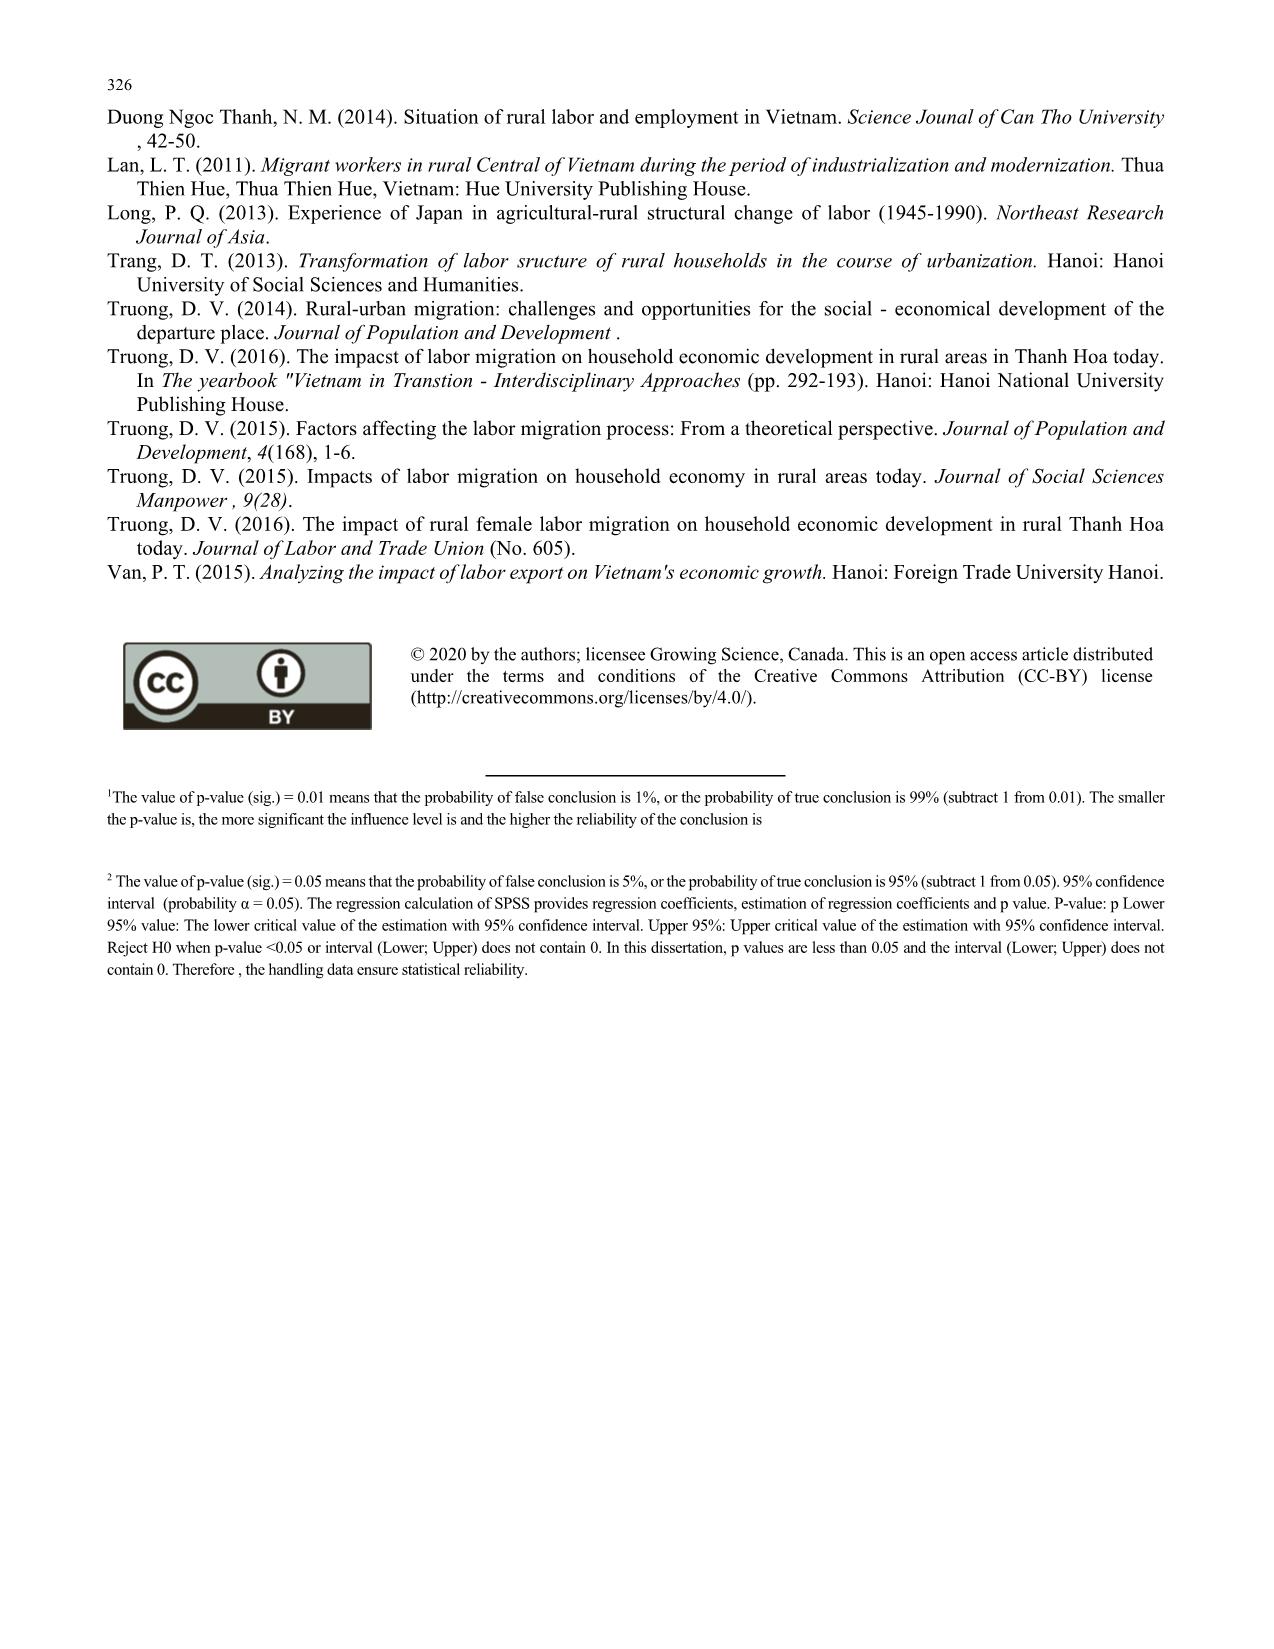
Table 11
 Forecasting results of logistic models of household characteristics affecting household hiring in the harvest
Observation
Prediction True
prediction
percentage
Hiring labor of household
1.00 0.00
Hiring labor in the harvest 1.00 338 5 98,5
0.00 36 6 14,3
True percentage of overall prediction 89,4
Source: Survey data of the study
The model correctly predicted 338 cases for hiring workers in the harvest (the dependent variable received a value of 1 and incorrectly
predicted 5 cases. Therefore, the correct prediction results with high probability (338/343 = 98.5%). Similarly, the model correctly
predicted 6 cases without hiring workers in the harvest with 0 and incorrectly predicted 36 cases. That meant that the correct prediction
was 6/42 = 14.3%. It can be inferred from the given data that the correct prediction percentage of the whole model is: (338 + 6) /
(338 + 6 + 36 + 5) = 344/385 = 89.4%. Compared with the results of Block 0, the results showed that the prediction model was better
(from 89.1% to 89.4%).
5. Conclusion
Based on both the theoretical basis of structural change of rural labor under the impacts of labor migration and applying empirical
research models, the analysis of data from the survey indicated that the transformation process of rural labor structure in Trieu
Son Distrct was influenced by the following factors: number of migrant workers, time of migration, destination of migrant
workers, occupation of migrants , migrants’ living standard, number of dependents in the household. The results of the study
were not only consistent with the theory but also consistent with the experimental results in some localities in the country, which
proves that under the impacts of labor migration process, occupational transition process of employees has been gradually
shifting towards industrialization and modernization in line with the market economy and the current trend of globalization.
The process of labor migration helped migrants accumulate knowledge from the reality of the labor market and gain some capital
that gave them more conditions to shift jobs from agriculture to non-agriculture. That made the movement of rural labor
composition in the studied area. In order to develop a sustainable rural labor structure, it is necessary to be aware and properly
assess the situation of labor migration and pay attention to the impact factors to have suitable solutions in managing and
developing sustainable human resources in rural areas.
References
Ba, L. X. (2006). Factors affecting the structural change process of rural labor in Vietnam. Hanoi: Ministry of Agriculture and
Rural Development.
 326
Duong Ngoc Thanh, N. M. (2014). Situation of rural labor and employment in Vietnam. Science Jounal of Can Tho University
, 42-50.
Lan, L. T. (2011). Migrant workers in rural Central of Vietnam during the period of industrialization and modernization. Thua
Thien Hue, Thua Thien Hue, Vietnam: Hue University Publishing House.
Long, P. Q. (2013). Experience of Japan in agricultural-rural structural change of labor (1945-1990). Northeast Research
Journal of Asia.
Trang, D. T. (2013). Transformation of labor sructure of rural households in the course of urbanization. Hanoi: Hanoi
University of Social Sciences and Humanities.
Truong, D. V. (2014). Rural-urban migration: challenges and opportunities for the social - economical development of the
departure place. Journal of Population and Development .
Truong, D. V. (2016). The impacst of labor migration on household economic development in rural areas in Thanh Hoa today.
In The yearbook "Vietnam in Transtion - Interdisciplinary Approaches (pp. 292-193). Hanoi: Hanoi National University
Publishing House.
Truong, D. V. (2015). Factors affecting the labor migration process: From a theoretical perspective. Journal of Population and
Development, 4(168), 1-6.
Truong, D. V. (2015). Impacts of labor migration on household economy in rural areas today. Journal of Social Sciences
Manpower , 9(28).
Truong, D. V. (2016). The impact of rural female labor migration on household economic development in rural Thanh Hoa
today. Journal of Labor and Trade Union (No. 605).
Van, P. T. (2015). Analyzing the impact of labor export on Vietnam's economic growth. Hanoi: Foreign Trade University Hanoi.
© 2020 by the authors; licensee Growing Science, Canada. This is an open access article distributed
under the terms and conditions of the Creative Commons Attribution (CC-BY) license
(
1The value of p-value (sig.) = 0.01 means that the probability of false conclusion is 1%, or the probability of true conclusion is 99% (subtract 1 from 0.01). The smaller
the p-value is, the more significant the influence level is and the higher the reliability of the conclusion is
2 The value of p-value (sig.) = 0.05 means that the probability of false conclusion is 5%, or the probability of true conclusion is 95% (subtract 1 from 0.05). 95% confidence
interval (probability α = 0.05). The regression calculation of SPSS provides regression coefficients, estimation of regression coefficients and p value. P-value: p Lower
95% value: The lower critical value of the estimation with 95% confidence interval. Upper 95%: Upper critical value of the estimation with 95% confidence interval.
Reject H0 when p-value <0.05 or interval (Lower; Upper) does not contain 0. In this dissertation, p values are less than 0.05 and the interval (Lower; Upper) does not
contain 0. Therefore , the handling data ensure statistical reliability.
File đính kèm:
 impacts_of_labor_migration_on_structural_change_of_rural_lab.pdf

