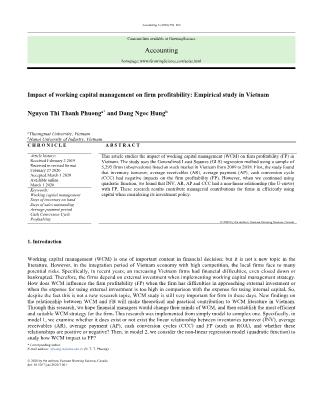
Impact of working capital management on firm profitability: Empirical study in Vietnam
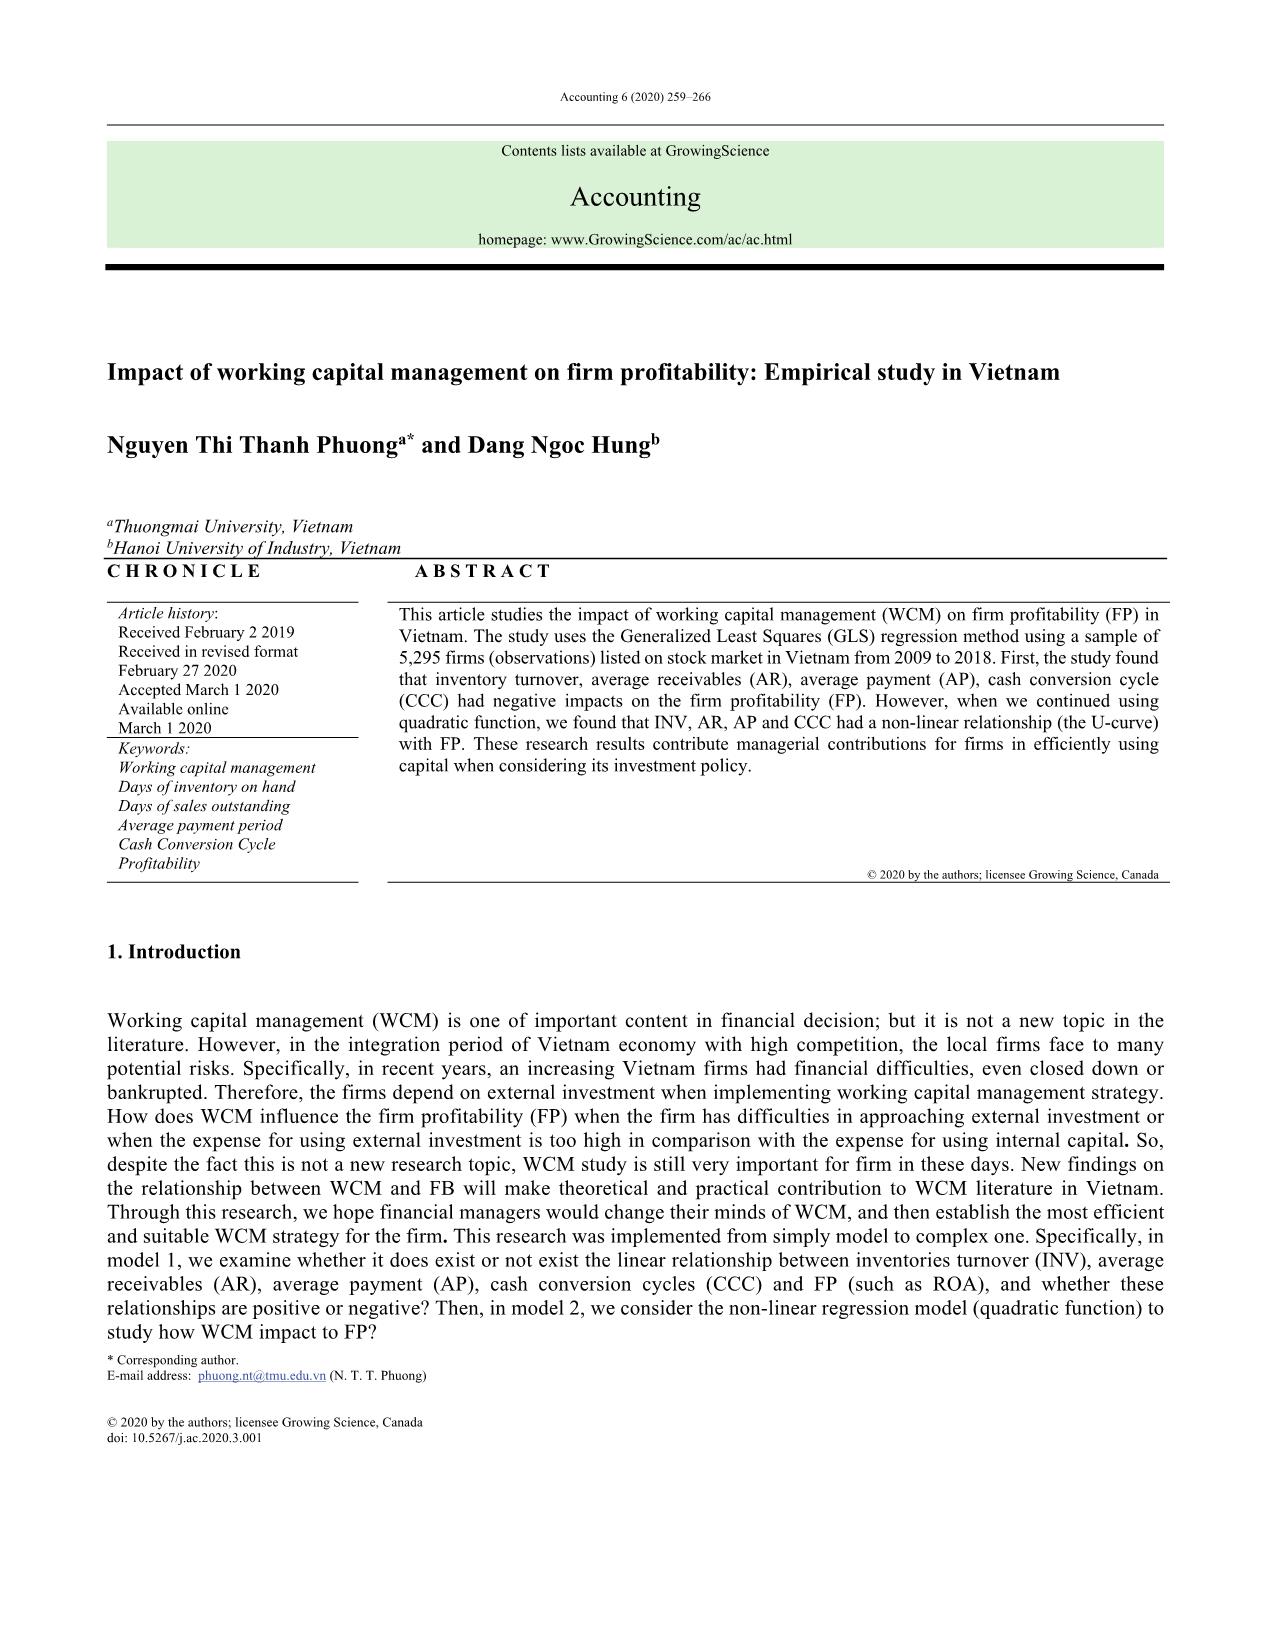
This article studies the impact of working capital management (WCM) on firm profitability (FP) in
Vietnam. The study uses the Generalized Least Squares (GLS) regression method using a sample of
5,295 firms (observations) listed on stock market in Vietnam from 2009 to 2018. First, the study found
that inventory turnover, average receivables (AR), average payment (AP), cash conversion cycle
(CCC) had negative impacts on the firm profitability (FP). However, when we continued using
quadratic function, we found that INV, AR, AP and CCC had a non-linear relationship (the U-curve)
with FP. These research results contribute managerial contributions for firms in efficiently using
capital when considering its investment policy.
Trang 1
Trang 2
Trang 3
Trang 4
Trang 5
Trang 6
Trang 7
Trang 8
Tóm tắt nội dung tài liệu: Impact of working capital management on firm profitability: Empirical study in Vietnam
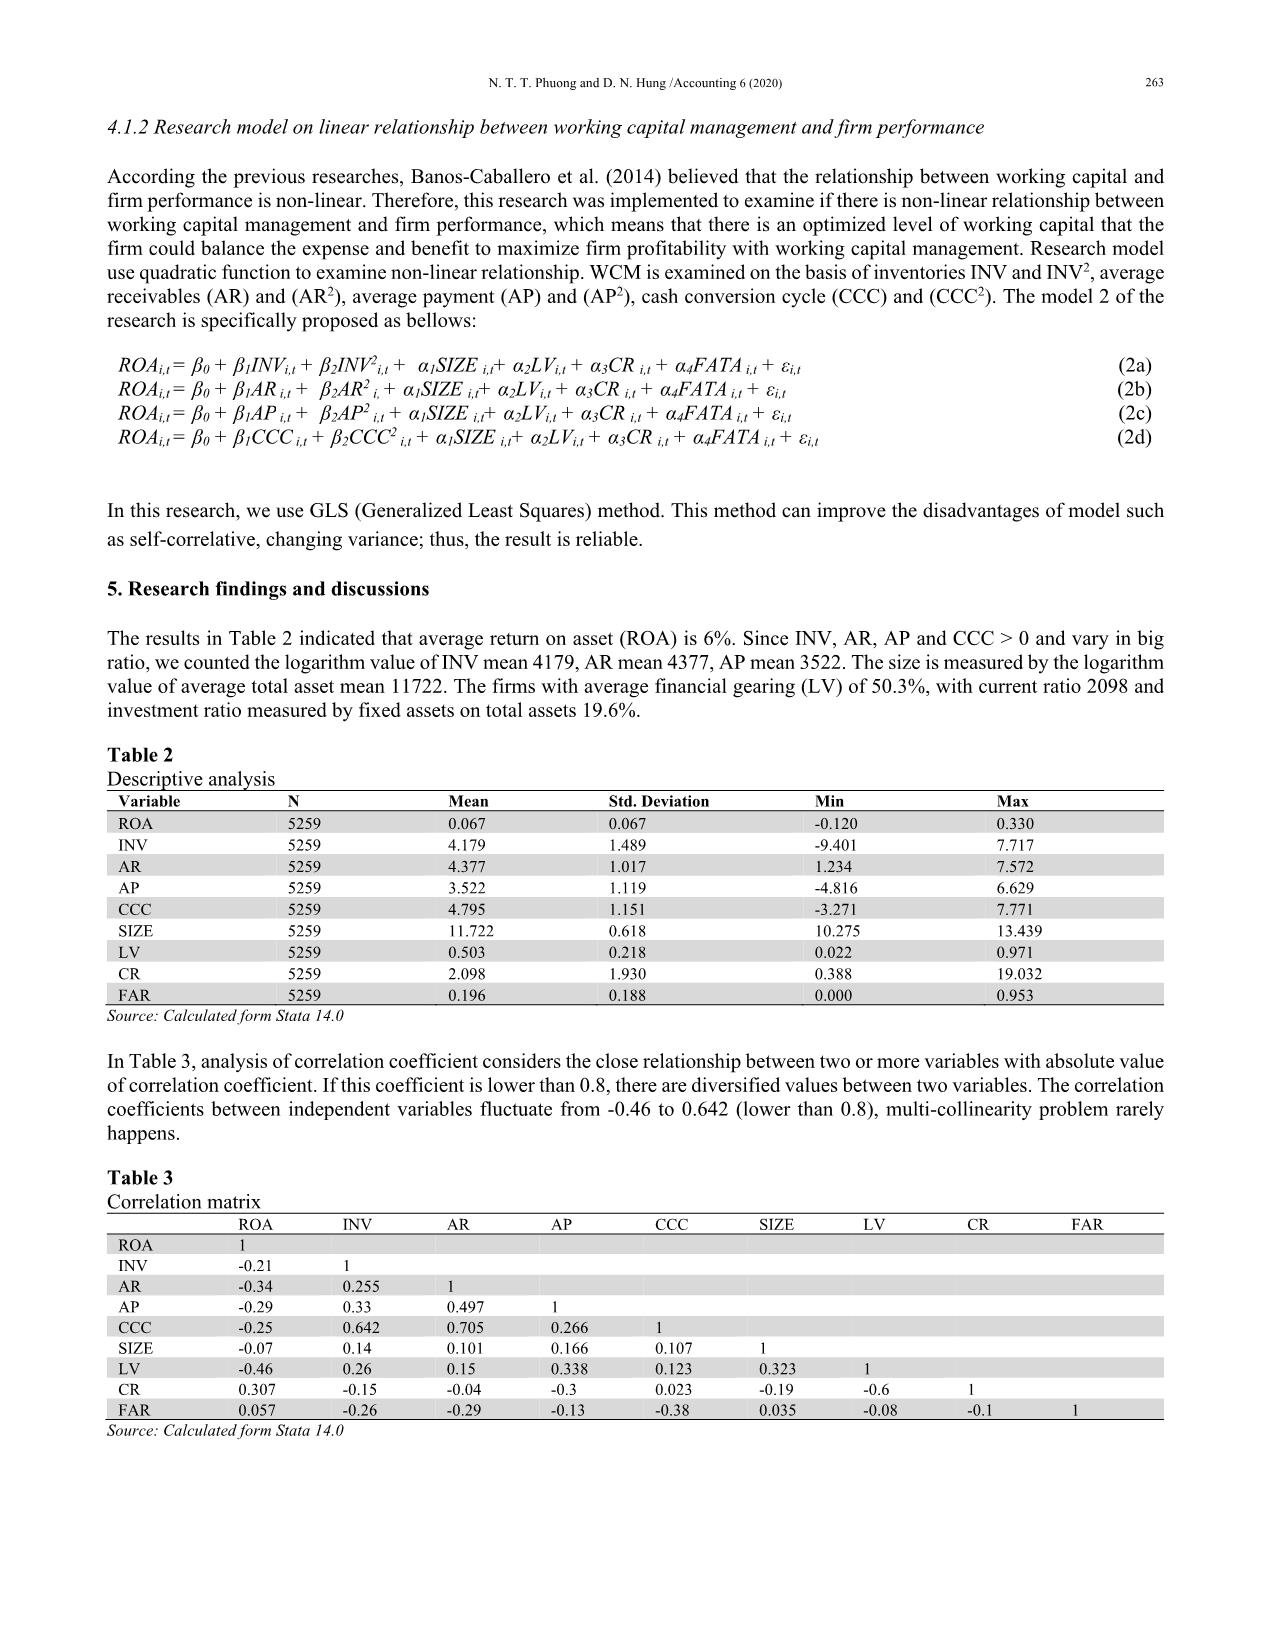
improve the disadvantages of model such
as self-correlative, changing variance; thus, the result is reliable.
5. Research findings and discussions
The results in Table 2 indicated that average return on asset (ROA) is 6%. Since INV, AR, AP and CCC > 0 and vary in big
ratio, we counted the logarithm value of INV mean 4179, AR mean 4377, AP mean 3522. The size is measured by the logarithm
value of average total asset mean 11722. The firms with average financial gearing (LV) of 50.3%, with current ratio 2098 and
investment ratio measured by fixed assets on total assets 19.6%.
Table 2
Descriptive analysis
Variable N Mean Std. Deviation Min Max
ROA 5259 0.067 0.067 -0.120 0.330
INV 5259 4.179 1.489 -9.401 7.717
AR 5259 4.377 1.017 1.234 7.572
AP 5259 3.522 1.119 -4.816 6.629
CCC 5259 4.795 1.151 -3.271 7.771
SIZE 5259 11.722 0.618 10.275 13.439
LV 5259 0.503 0.218 0.022 0.971
CR 5259 2.098 1.930 0.388 19.032
FAR 5259 0.196 0.188 0.000 0.953
Source: Calculated form Stata 14.0
In Table 3, analysis of correlation coefficient considers the close relationship between two or more variables with absolute value
of correlation coefficient. If this coefficient is lower than 0.8, there are diversified values between two variables. The correlation
coefficients between independent variables fluctuate from -0.46 to 0.642 (lower than 0.8), multi-collinearity problem rarely
happens.
Table 3
Correlation matrix
 ROA INV AR AP CCC SIZE LV CR FAR
ROA 1
INV -0.21 1
AR -0.34 0.255 1
AP -0.29 0.33 0.497 1
CCC -0.25 0.642 0.705 0.266 1
SIZE -0.07 0.14 0.101 0.166 0.107 1
LV -0.46 0.26 0.15 0.338 0.123 0.323 1
CR 0.307 -0.15 -0.04 -0.3 0.023 -0.19 -0.6 1
FAR 0.057 -0.26 -0.29 -0.13 -0.38 0.035 -0.08 -0.1 1
Source: Calculated form Stata 14.0
 264
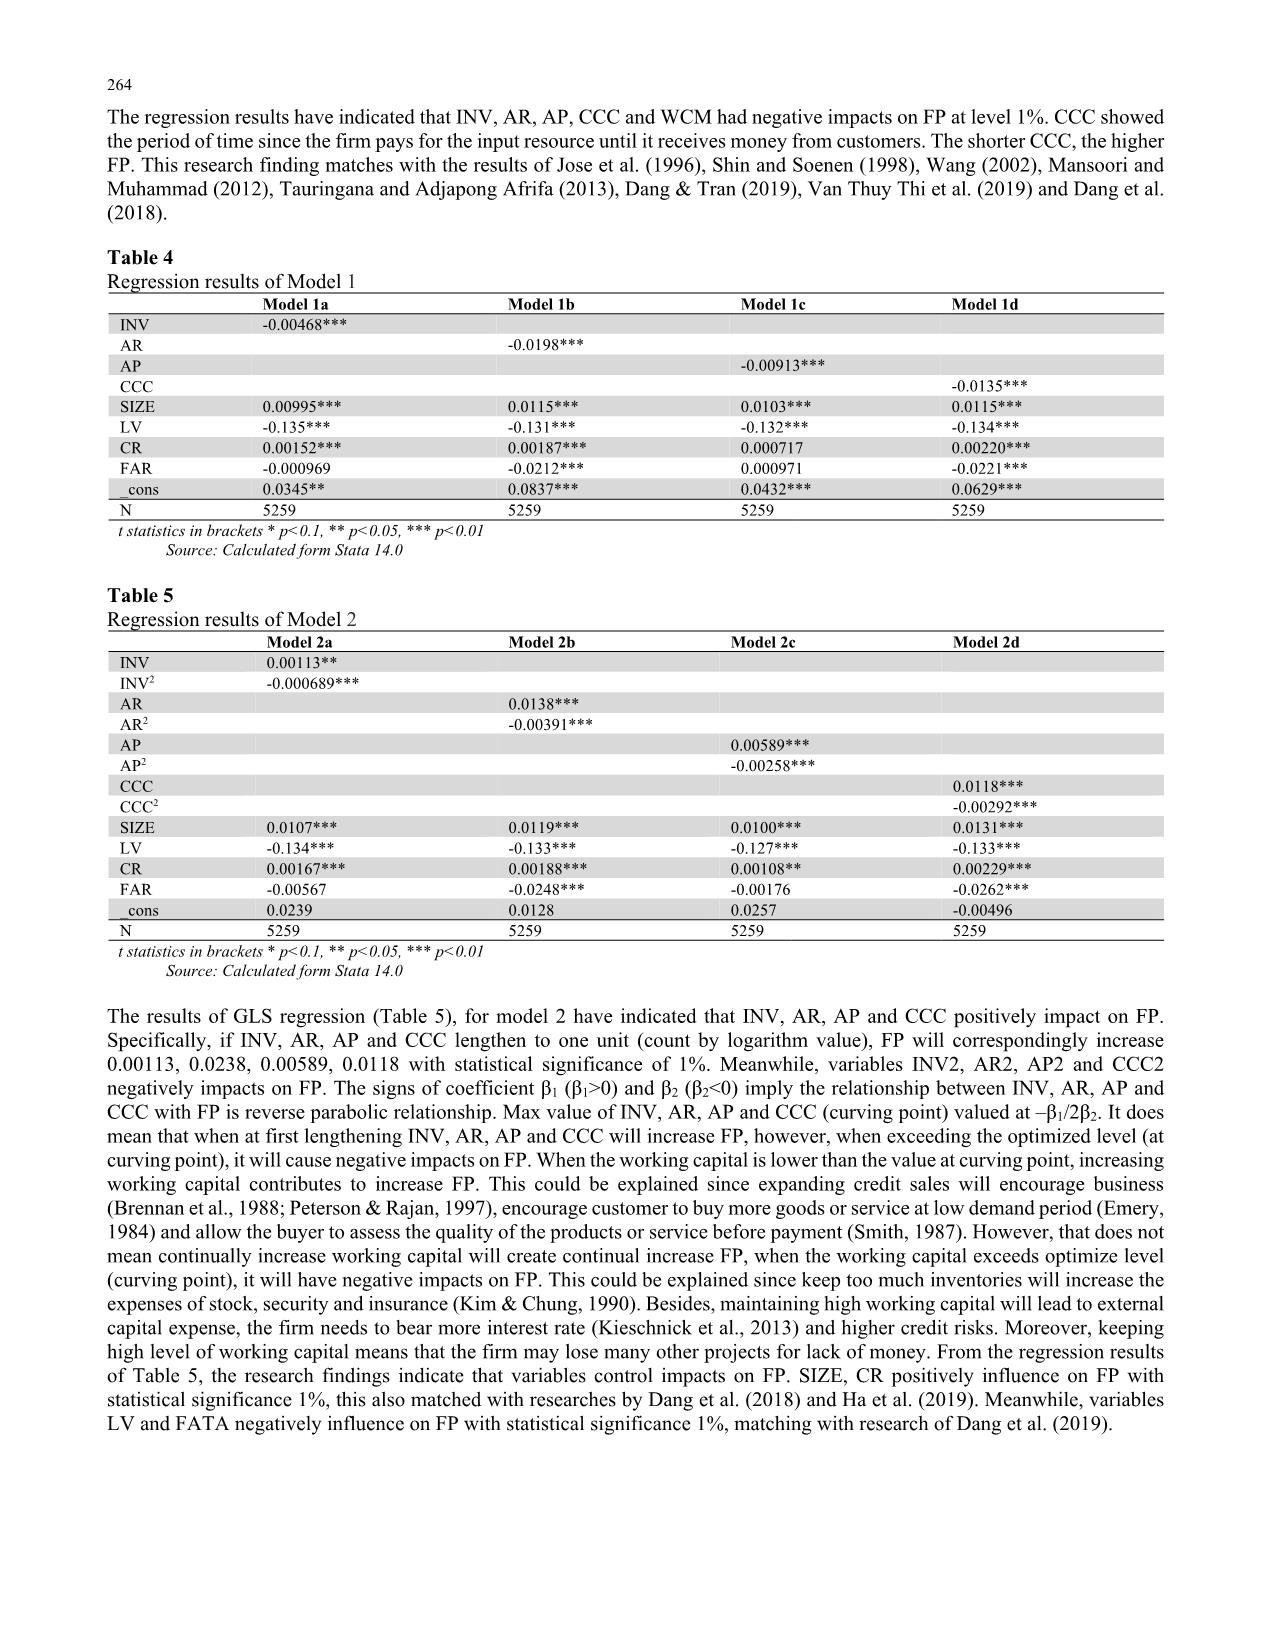
The regression results have indicated that INV, AR, AP, CCC and WCM had negative impacts on FP at level 1%. CCC showed
the period of time since the firm pays for the input resource until it receives money from customers. The shorter CCC, the higher
FP. This research finding matches with the results of Jose et al. (1996), Shin and Soenen (1998), Wang (2002), Mansoori and
Muhammad (2012), Tauringana and Adjapong Afrifa (2013), Dang & Tran (2019), Van Thuy Thi et al. (2019) and Dang et al.
(2018).
Table 4
Regression results of Model 1
 Model 1a Model 1b Model 1c Model 1d
INV -0.00468***
AR -0.0198***
AP -0.00913***
CCC -0.0135***
SIZE 0.00995*** 0.0115*** 0.0103*** 0.0115***
LV -0.135*** -0.131*** -0.132*** -0.134***
CR 0.00152*** 0.00187*** 0.000717 0.00220***
FAR -0.000969 -0.0212*** 0.000971 -0.0221***
_cons 0.0345** 0.0837*** 0.0432*** 0.0629***
N 5259 5259 5259 5259
t statistics in brackets * p<0.1, ** p<0.05, *** p<0.01
Source: Calculated form Stata 14.0
Table 5
Regression results of Model 2
 Model 2a Model 2b Model 2c Model 2d
INV 0.00113**
INV2 -0.000689***
AR 0.0138***
AR2 -0.00391***
AP 0.00589***
AP2 -0.00258***
CCC 0.0118***
CCC2 -0.00292***
SIZE 0.0107*** 0.0119*** 0.0100*** 0.0131***
LV -0.134*** -0.133*** -0.127*** -0.133***
CR 0.00167*** 0.00188*** 0.00108** 0.00229***
FAR -0.00567 -0.0248*** -0.00176 -0.0262***
_cons 0.0239 0.0128 0.0257 -0.00496
N 5259 5259 5259 5259
t statistics in brackets * p<0.1, ** p<0.05, *** p<0.01
Source: Calculated form Stata 14.0
The results of GLS regression (Table 5), for model 2 have indicated that INV, AR, AP and CCC positively impact on FP.
Specifically, if INV, AR, AP and CCC lengthen to one unit (count by logarithm value), FP will correspondingly increase
0.00113, 0.0238, 0.00589, 0.0118 with statistical significance of 1%. Meanwhile, variables INV2, AR2, AP2 and CCC2
negatively impacts on FP. The signs of coefficient β1 (β1>0) and β2 (β2<0) imply the relationship between INV, AR, AP and
CCC with FP is reverse parabolic relationship. Max value of INV, AR, AP and CCC (curving point) valued at –β1/2β2. It does
mean that when at first lengthening INV, AR, AP and CCC will increase FP, however, when exceeding the optimized level (at
curving point), it will cause negative impacts on FP. When the working capital is lower than the value at curving point, increasing
working capital contributes to increase FP. This could be explained since expanding credit sales will encourage business
(Brennan et al., 1988; Peterson & Rajan, 1997), encourage customer to buy more goods or service at low demand period (Emery,
1984) and allow the buyer to assess the quality of the products or service before payment (Smith, 1987). However, that does not
mean continually increase working capital will create continual increase FP, when the working capital exceeds optimize level
(curving point), it will have negative impacts on FP. This could be explained since keep too much inventories will increase the
expenses of stock, security and insurance (Kim & Chung, 1990). Besides, maintaining high working capital will lead to external
capital expense, the firm needs to bear more interest rate (Kieschnick et al., 2013) and higher credit risks. Moreover, keeping
high level of working capital means that the firm may lose many other projects for lack of money. From the regression results
of Table 5, the research findings indicate that variables control impacts on FP. SIZE, CR positively influence on FP with
statistical significance 1%, this also matched with researches by Dang et al. (2018) and Ha et al. (2019). Meanwhile, variables
LV and FATA negatively influence on FP with statistical significance 1%, matching with research of Dang et al. (2019).
N. T. T. Phuong and D. N. Hung /Accounting 6 (2020) 265
6. Conclusion and recommendations
6.1. Conclusion
Our research has studied the relationship between WCM and FP of non-financial firms listed on Vietnam stock exchanges in
the period 2009-2018. Our significant contribution consists in using GLS model to control the correlation and unchanged error
which could seriously impacts on the previous research in Vietnam. The above results ordinarily answer the questions. Firstly,
the study has indicated the relationship between WCM and FP which was not linear relationship as in many previous researches.
The relationship between them is non-linear (parabolic relationship). It does mean that there is an optimized level of working
capital which balance benefit, expense and maximizes the firm performance. The lower (or higher) the working capital in
comparison with the optimized level, the less profit the firm gets, matching with previous research of Bano Caballero et al.
(2010, 2014). When the working capital is lower than optimized level, it is suitable for the firm to invest more in working capital
to increase turnover. Business opportunities open with increasing credit sales for customers, increasing more inventories to
sustain the product price and keep the production line. Investing more in working capital is similar to reducing payment for
suppliers, collecting more payment discount; at the same time helping the firm reduce input expense and having good
relationship with suppliers. However, when the working capital exceeds the optimized level, it would negatively influence on
FP because of increasing expense such as: stocking, insurance, securities and expenses for mobilizing external capital. Keeping
too high working capital is similar to increasing interest rate, credit risk and bankruptcy, and at the same time losing other
investment opportunities of participating in other projects. Therefore, the firm managers should efficiently manage working
capital close to optimized level to avoid the negative influence of it.
6.2. Recommendations
Our findings are interesting for firm managers. Firstly, they should focus on working capital management, trying to keep the
optimize level of working capital, avoiding negative impact on the firm performance. Besides, they could increase FP by
optimizing INV, AR, AP and CCC. Besides, it is significant to manage working capital for better firm performance. On one
side, good WCM will increase liquidity and positive influence on the corporate finance. On the other side, good WCM will
increase other sponsorship since the credit organization will assess balance sheet of the firm to decide to invest in the corporate
business. However, the impacts of WCM on FP also depend on characteristics of each firm as above analysis, i.e. internal
investment, sponsor expenses when mobilizing external capital, ability to approach capital market and financial crisis of the
firm. Therefore, the firm managers should define the financial situation of the company to efficiently control working capital.
References
Afeef, M. (2011). Analyzing the Impact of Working Capital Management on the Profitability of SME's in Pakistan. International
Journal of Business and Social Science, 2(22), 173-183.
Akinlo, O., & Olufisayo, O. (2011). The effect of working capital on profitability of firms in Nigeria: Evidence from general
method of moments (GMM). Asian Journal of Business and Management Sciences, 1(2), 130-135.
Baños-Caballero, S., García-Teruel, P. J., & Martínez-Solano, P. (2012). How does working capital management affect the
profitability of Spanish SMEs? Small business economics, 39(2), 517-529. doi: https://doi.org/10.1007/s11187-011-9317-8
Baños-Caballero, S., García-Teruel, P. J., & Martínez-Solano, P. (2014). Working capital management, corporate performance,
and financial constraints. Journal of Business Research, 67(3), 332-338.
Baños‐Caballero, S., García‐Teruel, P. J., & Martínez‐Solano, P. (2010). Working capital management in SMEs. Accounting &
Finance, 50(3), 511-527. doi: https://doi.org/10.1111/j.1467-629X.2009.00331.x
Baveld, M. B. (2012). Impact of working capital management on the profitability of public listed firms in The Netherlands
during the financial crisis. University of Twente.
Brealey, & Myers, A. (2006). Corporate Finance. New York: Irwin Mc Graw-Hill.
Brennan, M. J., Maksimovics, V., & Zechner, J. (1988). Vendor financing. The Journal of Finance, 43(5), 1127-1141.
Ching, H. Y., Novazzi, A., & Gerab, F. (2011). Relationship between working capital management and profitability in Brazilian
listed companies. Journal of Global Business and Economics, 3(1), 74-86.
Dang, H. N., Pham, C. D., & Hoang, H. T. V. (2018). An analysis of the effects of profit to security return: An empirical study
of Vietnam. International Journal of Research in Business, Economics and Management, 2(5), 188-201.
Dang, H. N., & Tran, D. M. (2019). Relationship between Accrual Anomaly and Stock Return: The Case of Vietnam. The
Journal of Asian Finance, Economics and Business (JAFEB), 6(4), 19-26.
Dang, H. N., Vu, V. T. T., Ngo, X. T., & Hoang, H. T. V. (2019). Study the impact of growth, firm size, capital structure, and
profitability on enterprise value: Evidence of enterprises in Vietnam. Journal of Corporate Accounting & Finance, 30(1),
144-160.
Dang, N. H., Pham, D. C., & Vu, T. B. H. (2018). Effects of financial statements information on firms’ value: evidence from
Vietnamese listed firms. Investment Management and Financial Innovations, 15(4), 210-218.
 266
Deloof, M. (2003). Does working capital management affect profitability of Belgian firms? Journal of Business Finance &
Accounting, 30(3‐4), 573-588.
Emery, G. W. (1984). A pure financial explanation for trade credit. Journal of Financial and Quantitative analysis, 19(3), 271-
285.
Filbeck, G., & Krueger, T. M. (2005). An analysis of working capital management results across industries. American Journal
of Business, 20(2), 11-20.
Gill, A., Biger, N., & Mathur, N. (2010). The relationship between working capital management and profitability: Evidence
from the United States. Business and Economics Journal, 10(1), 1-9.
Ha, T. V., Dang, N. H., Tran, M. D., Van Vu, T. T., & Trung, Q. (2019). Determinants Influencing Financial Performance of
Listed Firms: Quantile Regression Approach. Asian Economic and Financial Review, 9(1), 78-90.
Jose, M. L., Lancaster, C., & Stevens, J. L. (1996). Corporate returns and cash conversion cycles. Journal of Economics and
finance, 20(1), 33-46.
Juan García-Teruel, P., & Martinez-Solano, P. (2007). Effects of working capital management on SME profitability.
International Journal of Managerial Finance, 3(2), 164-177.
Kieschnick, R., Laplante, M., & Moussawi, R. (2013). Working capital management and shareholders’ wealth. Review of
Finance, 17(5), 1827-1852.
Kim, Y. H., & Chung, K. H. (1990). An integrated evaluation of investment in inventory and credit: a cash flow approach.
Journal of Business Finance & Accounting, 17(3), 381-389.
Lazaridis, I., & Tryfonidis, D. (2006). Relationship between working capital management and profitability of listed companies
in the Athens stock exchange. Journal of Financial Management and Analysis, 19(1), 1-12.
Mansoori, D. E., & Muhammad, D. (2012). The effect of working capital management on firm’s profitability: evidence from
Singapore. Interdisciplinary Journal of Contemporary Research in Business, 4(5), 472-486.
Mathuva, D. (2010). The Influence of working capital management components on corporate profitability. Research Journal of
Business Management, 4(1), 1-11.
Nobanee, H., Abdullatif, M., & AlHajjar, M. (2011). Cash conversion cycle and firm's performance of Japanese firms. Asian
Review of Accounting, 19(2), 147-156.
Petersen, M. A., & Rajan, R. G. (1997). Trade credit: theories and evidence. The review of financial studies, 10(3), 661-691.
Sharma, A., & Kumar, S. (2011). Effect of working capital management on firm profitability: Empirical evidence from India.
Global Business Review, 12(1), 159-173.
Shin, H.-H., & Soenen, L. (1998). Efficiency of working capital management and corporate profitability. Financial Practice
and education, 8(1), 37-45.
Smith, J. K. (1987). Trade credit and informational asymmetry. The journal of finance, 42(4), 863-872.
Tauringana, V., & Adjapong Afrifa, G. (2013). The relative importance of working capital management and its components to
SMEs' profitability. Journal of Small Business and Enterprise Development, 20(3), 453-469.
Van Thuy Thi, V., Nhung Hong, D., & Hung Ngoc, D. (2019). Profitability and the Distance to Default: Evidence from Vietnam
Securities Market. The Journal of Asian Finance, Economics and Business, 6(4), 53-63.
Wang, Y.-J. (2002). Liquidity management, operating performance, and corporate value: evidence from Japan and Taiwan.
Journal of Multinational Financial Management, 12(2), 159-169.
© 2020 by the authors; licensee Growing Science, Canada. This is an open access article distributed
under the terms and conditions of the Creative Commons Attribution (CC-BY) license
(
File đính kèm:
 impact_of_working_capital_management_on_firm_profitability_e.pdf

