Impact of different factors on Vietnam's trade balance
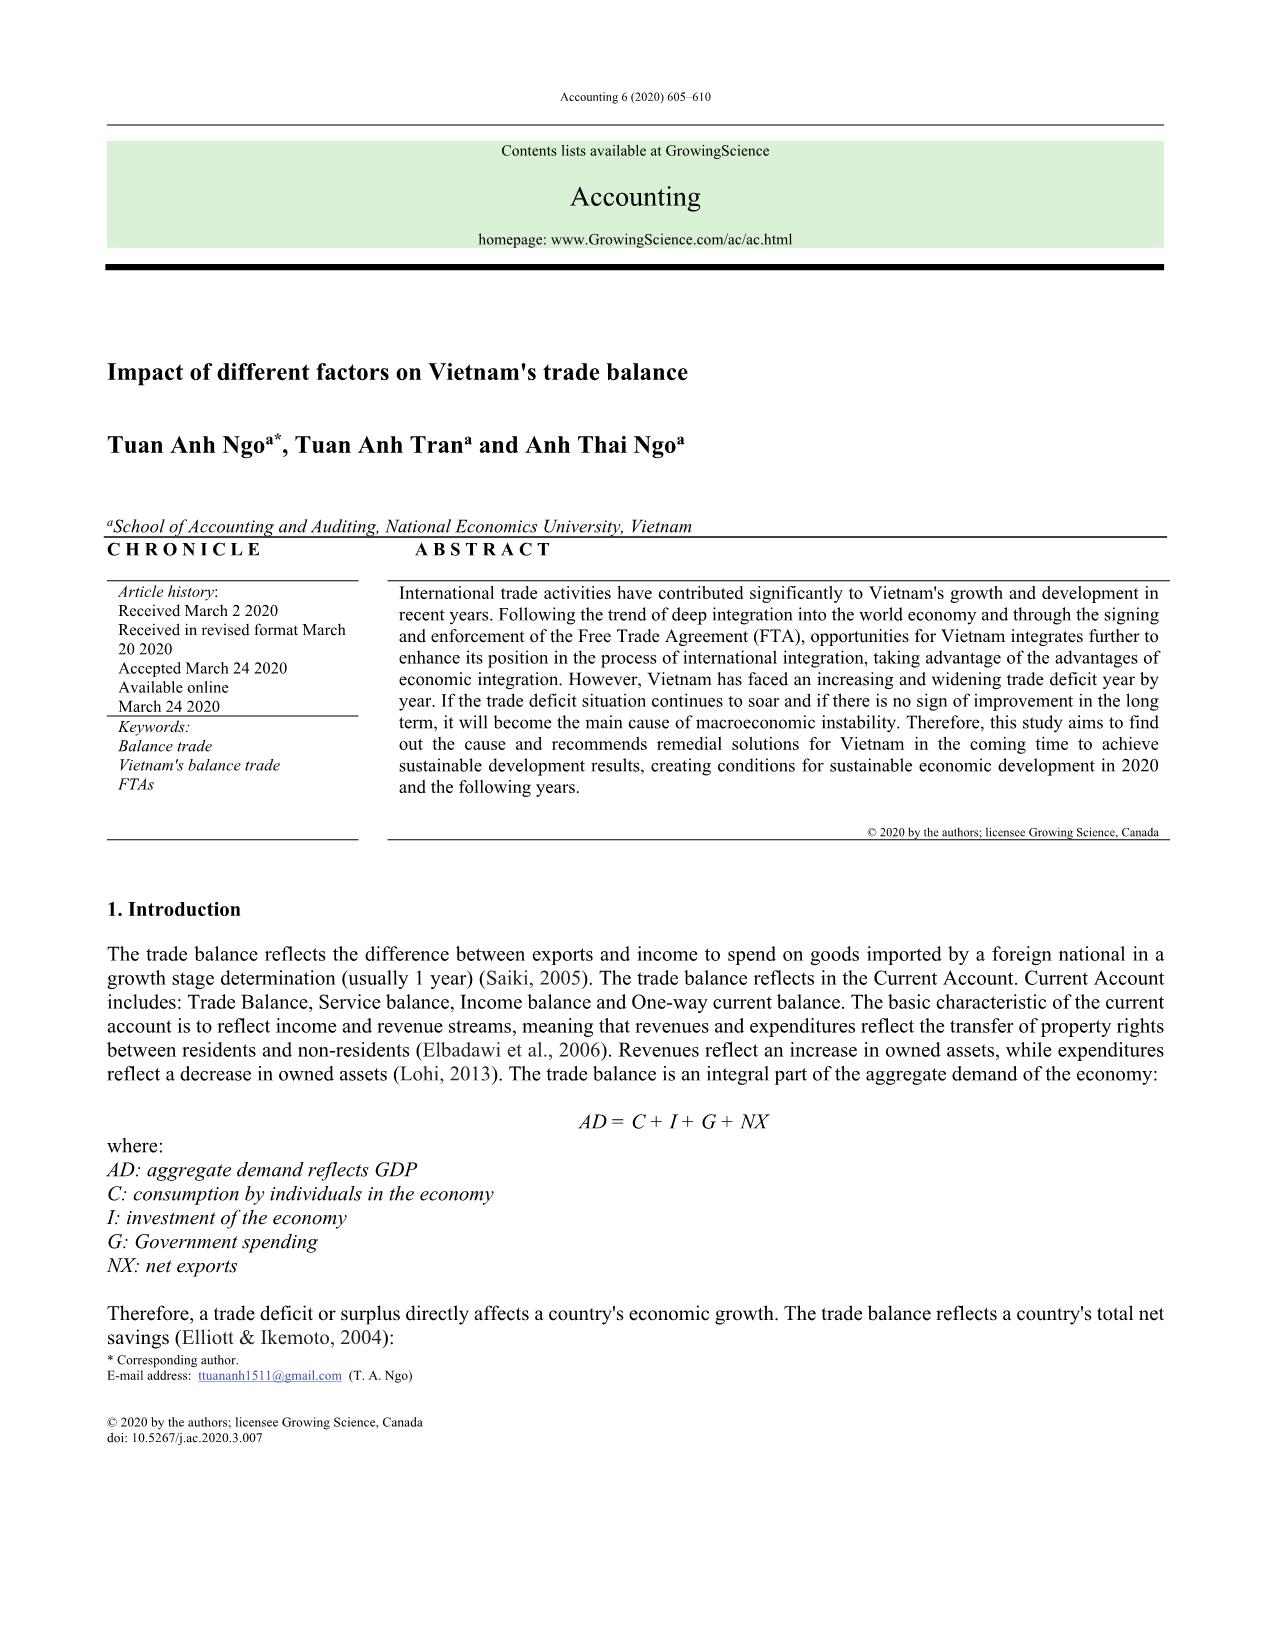
International trade activities have contributed significantly to Vietnam's growth and development in
recent years. Following the trend of deep integration into the world economy and through the signing
and enforcement of the Free Trade Agreement (FTA), opportunities for Vietnam integrates further to
enhance its position in the process of international integration, taking advantage of the advantages of
economic integration. However, Vietnam has faced an increasing and widening trade deficit year by
year. If the trade deficit situation continues to soar and if there is no sign of improvement in the long
term, it will become the main cause of macroeconomic instability. Therefore, this study aims to find
out the cause and recommends remedial solutions for Vietnam in the coming time to achieve
sustainable development results, creating conditions for sustainable economic development in 2020
and the following years.
Trang 1
Trang 2
Trang 3
Trang 4
Trang 5
Trang 6
Tóm tắt nội dung tài liệu: Impact of different factors on Vietnam's trade balance
 of 0 if they do not share
the border
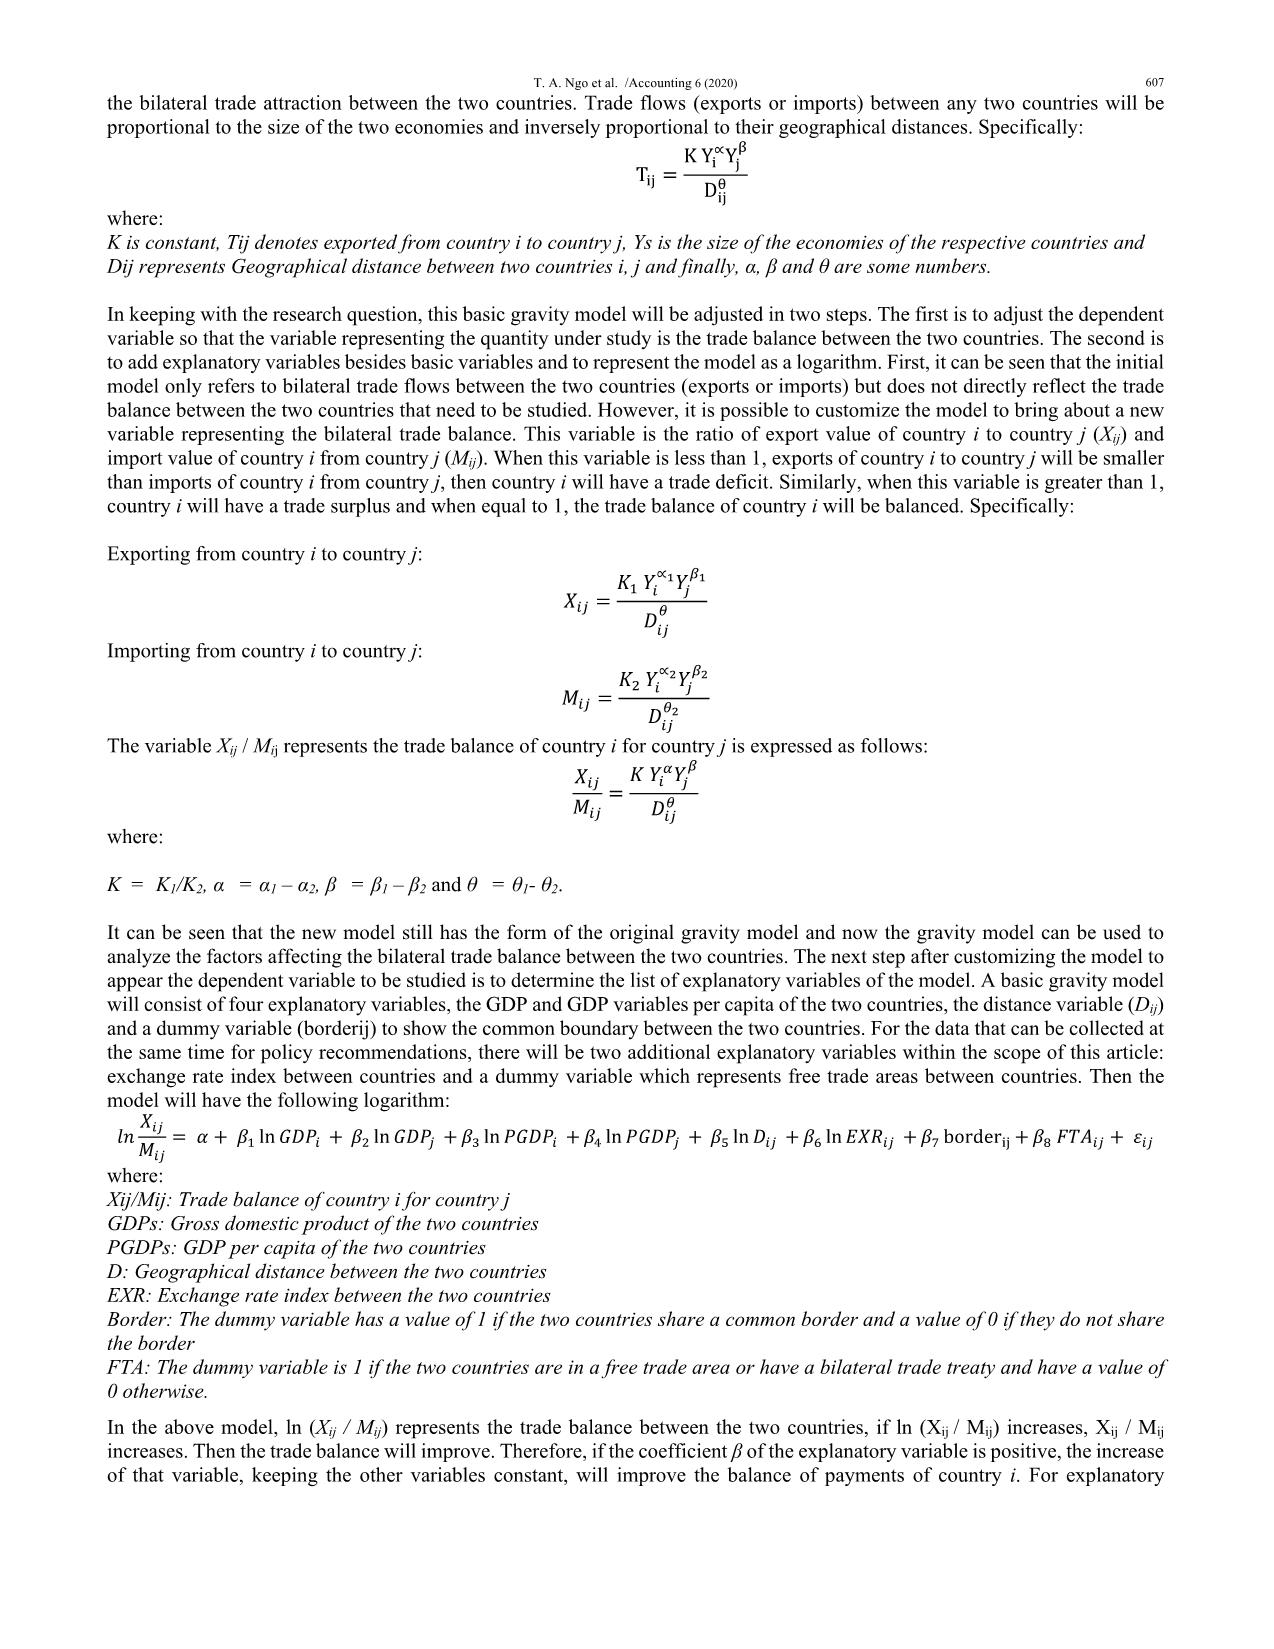
FTA: The dummy variable is 1 if the two countries are in a free trade area or have a bilateral trade treaty and have a value of
0 otherwise.
In the above model, ln (Xij / Mij) represents the trade balance between the two countries, if ln (Xij / Mij) increases, Xij / Mij
increases. Then the trade balance will improve. Therefore, if the coefficient β of the explanatory variable is positive, the increase
of that variable, keeping the other variables constant, will improve the balance of payments of country i. For explanatory
 608
variables, except EXR coefficients β of all these variables can be positive or negative, which can affect the balance of payments
in opposite directions. The first four variables are standard variables of the basic gravity model, in which GDP and PGDP
represent the size of the economy or the production and purchasing power of the two countries while D and the border represent
trade costs. The impact of these variables on individual imports or exports is quite obvious. The explanatory variables
representing the size of the economy have a positive effect (with a positive β coefficient) while the variables representing the
trade costs have a negative impact (a negative coefficient) to the dependent variable (Tinbergen). However, since the dependent
variable is no longer an individual activity but a combination of both activities (the trade balance), it depends on the correlation
between the impact of the explanatory variable on imports and exports. whose coefficients β can be negative or positive. For
example, if the increase in Vietnam's GDP increases exports to a level greater than the increase in imports, then the coefficient
of Vietnam's GDP variable will be positive, Vietnam's GDP variable will affect. It works in the same direction as the trade
balance and vice versa. Similar to the four basic variables, FTA variables can also affect dependent variables in both directions
(the coefficient β may be positive or negative) (Ncube et al., 2014). FTA is a dummy variable with a value of 1 when both
countries are located in a free trade area or have a bilateral trade treaty and have a value of 0 in the opposite case. Naturally,
when the FTA has a value of 1, the trade relations of both countries (both exports and imports) tend to increase compared to the
trade relations of those two countries when the FTA is zero. However, if joining a free trade area of both countries has the effect
of increasing exports of country i faster than country i's import growth from country j, this joint accession improves the balance
of payments of country i for country j. The EXR variable is predicted to have a negative impact (coefficient β with negative
sign) on the balance of payments of country i for country j. The EXR variable represents the country currency i listed in country
currency j. Thus, when EXR increases, the currency of country i will increase in price, causing the competitiveness of goods of
country i to decrease in the international market, then the export of country i tends to decrease to import tends to upward
direction. Combining the two effects will worsen the situation of the balance of payments of country i for country j. However,
it should be noted that, in some special cases, this effect will be in the same direction (the coefficient is positive), that is when
the total price elasticity of exports and imports of country i is less than 1 (Marshall - Lerner condition) (Johnson & Soenen,
2002).
3. Results
3.1. Data
To estimate the above model, the paper will use panel data. The advantage of using panel tables is the number of observed
variables, a study of the differences between cross-units and partly overcome the multi-collinear phenomenon. Besides, table
data contains more information than other types of data and allows the study of the dynamics of cross-unit changes over time.
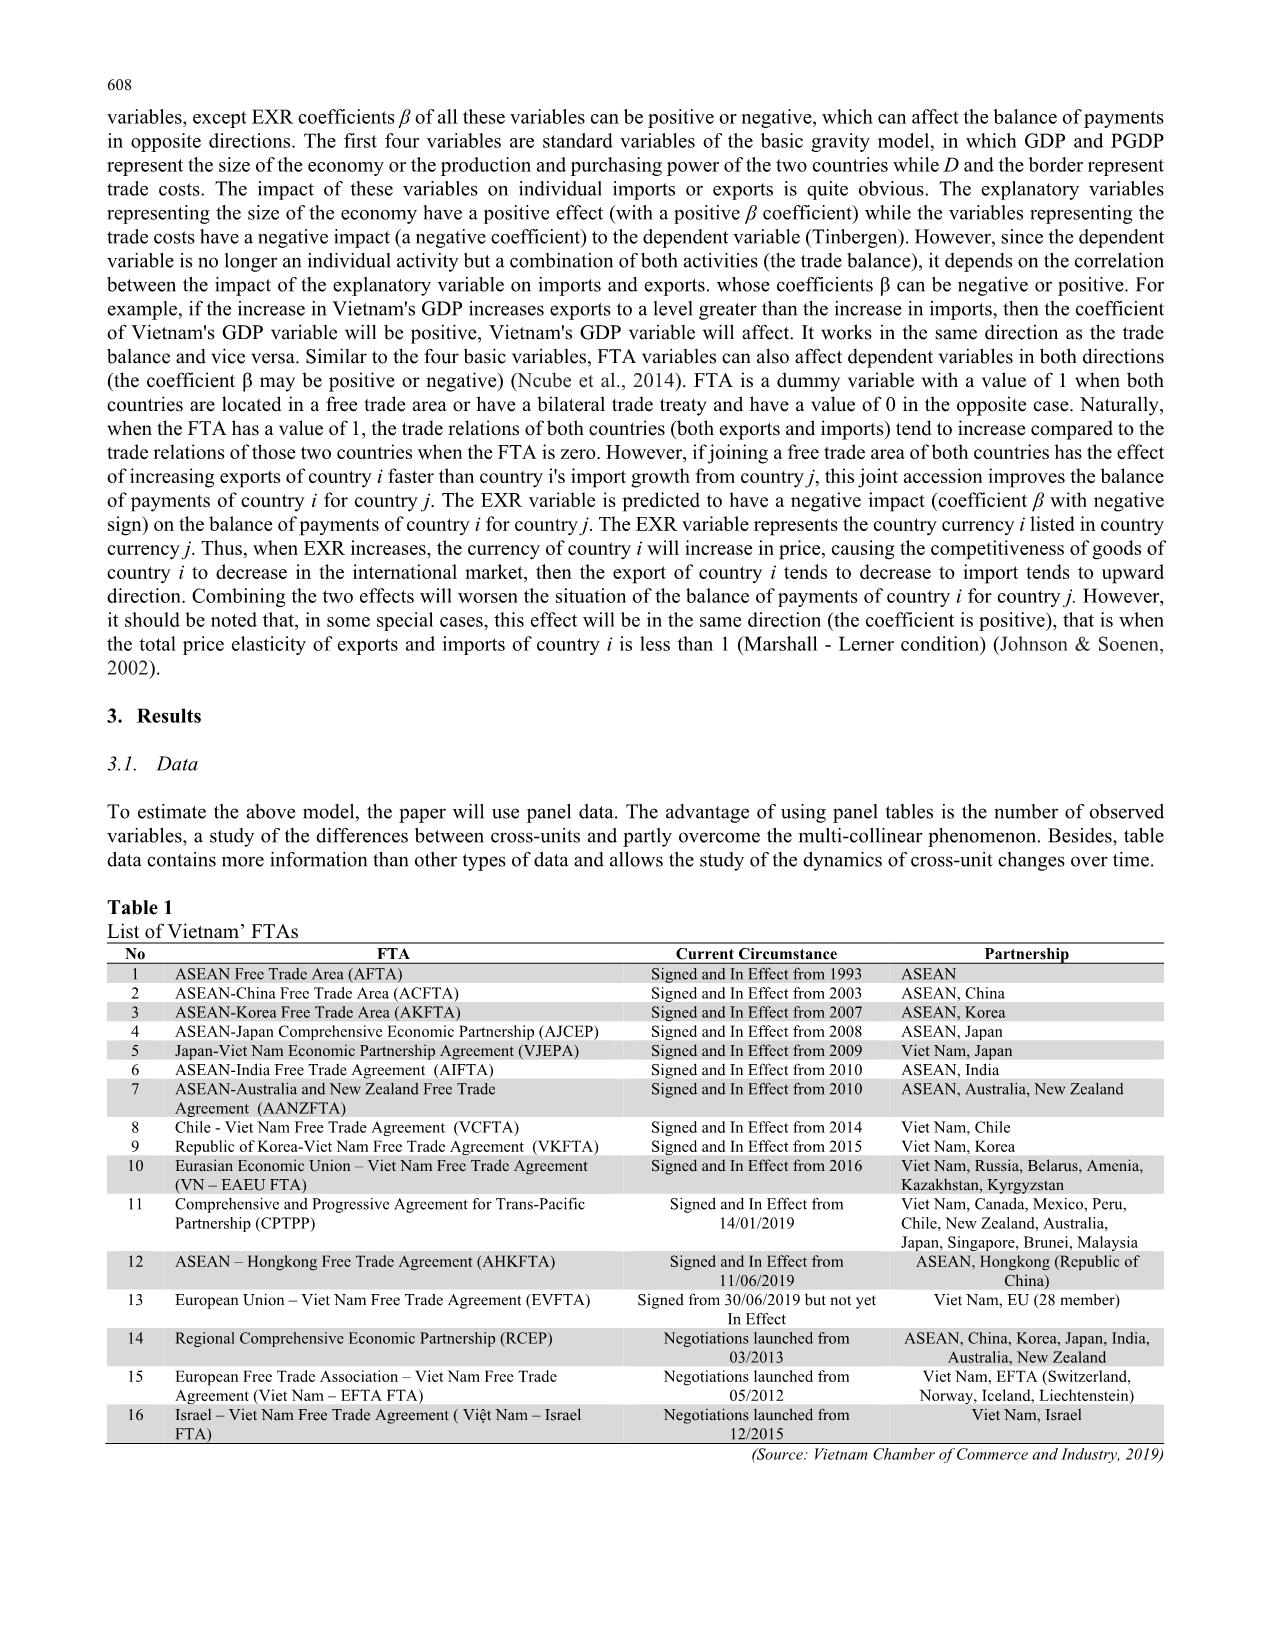
Table 1
List of Vietnam’ FTAs
No FTA Current Circumstance Partnership
1 ASEAN Free Trade Area (AFTA) Signed and In Effect from 1993 ASEAN
2 ASEAN-China Free Trade Area (ACFTA) Signed and In Effect from 2003 ASEAN, China
3 ASEAN-Korea Free Trade Area (AKFTA) Signed and In Effect from 2007 ASEAN, Korea
4 ASEAN-Japan Comprehensive Economic Partnership (AJCEP) Signed and In Effect from 2008 ASEAN, Japan
5 Japan-Viet Nam Economic Partnership Agreement (VJEPA) Signed and In Effect from 2009 Viet Nam, Japan
6 ASEAN-India Free Trade Agreement (AIFTA) Signed and In Effect from 2010 ASEAN, India
7 ASEAN-Australia and New Zealand Free Trade
Agreement (AANZFTA)
Signed and In Effect from 2010 ASEAN, Australia, New Zealand
8 Chile - Viet Nam Free Trade Agreement (VCFTA) Signed and In Effect from 2014 Viet Nam, Chile
9 Republic of Korea-Viet Nam Free Trade Agreement (VKFTA) Signed and In Effect from 2015 Viet Nam, Korea
10 Eurasian Economic Union – Viet Nam Free Trade Agreement
(VN – EAEU FTA)
Signed and In Effect from 2016 Viet Nam, Russia, Belarus, Amenia,
Kazakhstan, Kyrgyzstan
11 Comprehensive and Progressive Agreement for Trans-Pacific
Partnership (CPTPP)
Signed and In Effect from
14/01/2019
Viet Nam, Canada, Mexico, Peru,
Chile, New Zealand, Australia,
Japan, Singapore, Brunei, Malaysia
12 ASEAN – Hongkong Free Trade Agreement (AHKFTA) Signed and In Effect from
11/06/2019
ASEAN, Hongkong (Republic of
China)
13 European Union – Viet Nam Free Trade Agreement (EVFTA) Signed from 30/06/2019 but not yet
In Effect
Viet Nam, EU (28 member)
14 Regional Comprehensive Economic Partnership (RCEP) Negotiations launched from
03/2013
ASEAN, China, Korea, Japan, India,
Australia, New Zealand
15 European Free Trade Association – Viet Nam Free Trade
Agreement (Viet Nam – EFTA FTA)
Negotiations launched from
05/2012
Viet Nam, EFTA (Switzerland,
Norway, Iceland, Liechtenstein)
16 Israel – Viet Nam Free Trade Agreement ( Việt Nam – Israel
FTA)
Negotiations launched from
12/2015
Viet Nam, Israel
(Source: Vietnam Chamber of Commerce and Industry, 2019)
T. A. Ngo et al. /Accounting 6 (2020) 609
Data will be collected within 18 key trading partners of Vietnam over 5 years from 2010 to 2015. The above figures have been
compiled from various sources. Data on imports and export were compiled from the Ministry of Industry and Trade. GDP data
and GDP per capita data are extracted from the World Development Indicator of World Bank. Data on distances and borders of
countries are referenced from French Institute for Research on the International Economy (CEPII), in which the distance
between the two countries is calculated by the weighted average distance between the two main cities of two country.
Particularly, the exchange rate data (EXR) will be processed to convert to the index form with the base year as 2010. The source
of exchange rate data will be the official exchange rate of partner countries and Vietnam for US dollars extracted from IFS and
WDI. These rates will be converted through cross rates with the US dollar to form the currency of each country / Vietnam Dong.
Then, these rates will be returned to the index form with the base year as 2010.
3.2. Model regression results
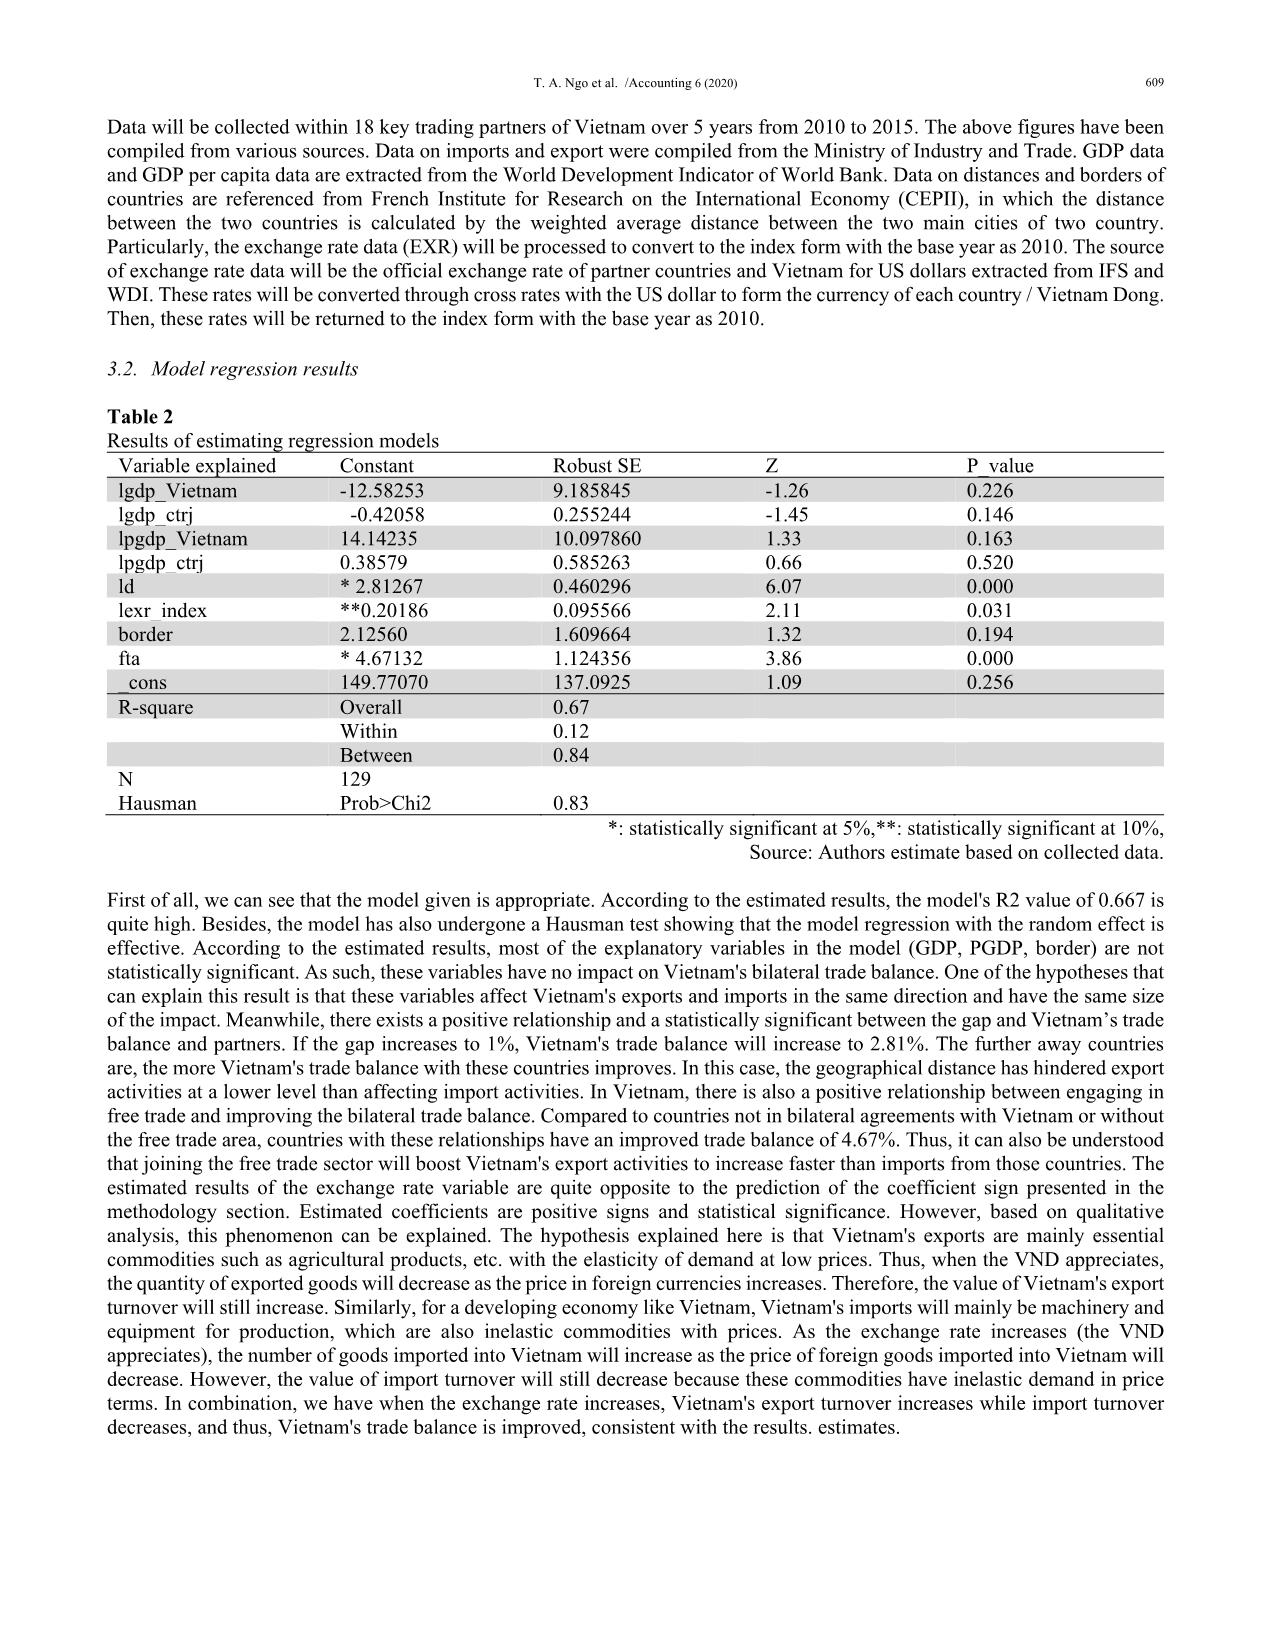
Table 2
Results of estimating regression models
Variable explained Constant Robust SE Z P_value
lgdp_Vietnam -12.58253 9.185845 -1.26 0.226
lgdp_ctrj -0.42058 0.255244 -1.45 0.146
lpgdp_Vietnam 14.14235 10.097860 1.33 0.163
lpgdp_ctrj 0.38579 0.585263 0.66 0.520
ld * 2.81267 0.460296 6.07 0.000
lexr_index **0.20186 0.095566 2.11 0.031
border 2.12560 1.609664 1.32 0.194
fta * 4.67132 1.124356 3.86 0.000
_cons 149.77070 137.0925 1.09 0.256
R-square Overall 0.67
 Within 0.12
 Between 0.84
N 129
Hausman Prob>Chi2 0.83
*: statistically significant at 5%,**: statistically significant at 10%,
Source: Authors estimate based on collected data.
First of all, we can see that the model given is appropriate. According to the estimated results, the model's R2 value of 0.667 is
quite high. Besides, the model has also undergone a Hausman test showing that the model regression with the random effect is
effective. According to the estimated results, most of the explanatory variables in the model (GDP, PGDP, border) are not
statistically significant. As such, these variables have no impact on Vietnam's bilateral trade balance. One of the hypotheses that
can explain this result is that these variables affect Vietnam's exports and imports in the same direction and have the same size
of the impact. Meanwhile, there exists a positive relationship and a statistically significant between the gap and Vietnam’s trade
balance and partners. If the gap increases to 1%, Vietnam's trade balance will increase to 2.81%. The further away countries
are, the more Vietnam's trade balance with these countries improves. In this case, the geographical distance has hindered export
activities at a lower level than affecting import activities. In Vietnam, there is also a positive relationship between engaging in
free trade and improving the bilateral trade balance. Compared to countries not in bilateral agreements with Vietnam or without
the free trade area, countries with these relationships have an improved trade balance of 4.67%. Thus, it can also be understood
that joining the free trade sector will boost Vietnam's export activities to increase faster than imports from those countries. The
estimated results of the exchange rate variable are quite opposite to the prediction of the coefficient sign presented in the
methodology section. Estimated coefficients are positive signs and statistical significance. However, based on qualitative
analysis, this phenomenon can be explained. The hypothesis explained here is that Vietnam's exports are mainly essential
commodities such as agricultural products, etc. with the elasticity of demand at low prices. Thus, when the VND appreciates,
the quantity of exported goods will decrease as the price in foreign currencies increases. Therefore, the value of Vietnam's export
turnover will still increase. Similarly, for a developing economy like Vietnam, Vietnam's imports will mainly be machinery and
equipment for production, which are also inelastic commodities with prices. As the exchange rate increases (the VND
appreciates), the number of goods imported into Vietnam will increase as the price of foreign goods imported into Vietnam will
decrease. However, the value of import turnover will still decrease because these commodities have inelastic demand in price
terms. In combination, we have when the exchange rate increases, Vietnam's export turnover increases while import turnover
decreases, and thus, Vietnam's trade balance is improved, consistent with the results. estimates.
 610
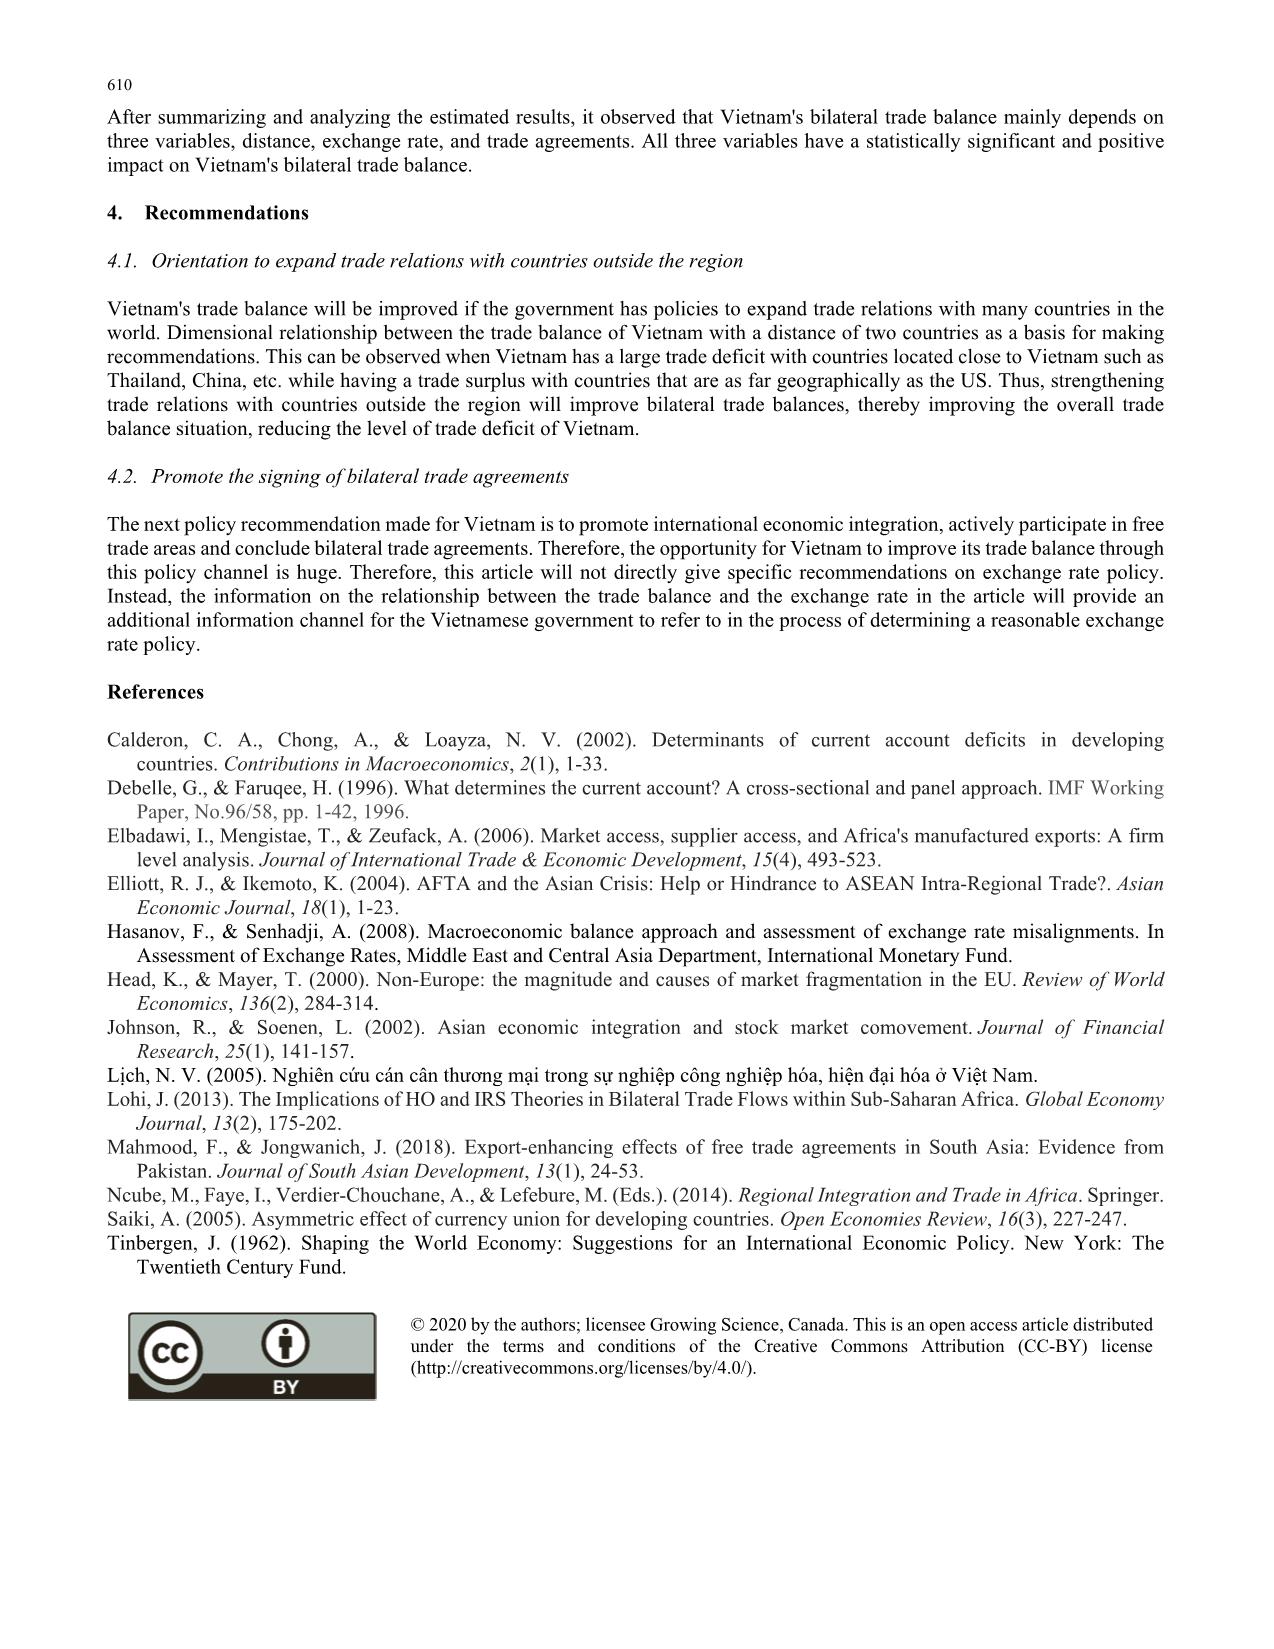
After summarizing and analyzing the estimated results, it observed that Vietnam's bilateral trade balance mainly depends on
three variables, distance, exchange rate, and trade agreements. All three variables have a statistically significant and positive
impact on Vietnam's bilateral trade balance.
4. Recommendations
4.1. Orientation to expand trade relations with countries outside the region
Vietnam's trade balance will be improved if the government has policies to expand trade relations with many countries in the
world. Dimensional relationship between the trade balance of Vietnam with a distance of two countries as a basis for making
recommendations. This can be observed when Vietnam has a large trade deficit with countries located close to Vietnam such as
Thailand, China, etc. while having a trade surplus with countries that are as far geographically as the US. Thus, strengthening
trade relations with countries outside the region will improve bilateral trade balances, thereby improving the overall trade
balance situation, reducing the level of trade deficit of Vietnam.
4.2. Promote the signing of bilateral trade agreements
The next policy recommendation made for Vietnam is to promote international economic integration, actively participate in free
trade areas and conclude bilateral trade agreements. Therefore, the opportunity for Vietnam to improve its trade balance through
this policy channel is huge. Therefore, this article will not directly give specific recommendations on exchange rate policy.
Instead, the information on the relationship between the trade balance and the exchange rate in the article will provide an
additional information channel for the Vietnamese government to refer to in the process of determining a reasonable exchange
rate policy.
References
Calderon, C. A., Chong, A., & Loayza, N. V. (2002). Determinants of current account deficits in developing
countries. Contributions in Macroeconomics, 2(1), 1-33.
Debelle, G., & Faruqee, H. (1996). What determines the current account? A cross-sectional and panel approach. IMF Working
Paper, No.96/58, pp. 1-42, 1996.
Elbadawi, I., Mengistae, T., & Zeufack, A. (2006). Market access, supplier access, and Africa's manufactured exports: A firm
level analysis. Journal of International Trade & Economic Development, 15(4), 493-523.
Elliott, R. J., & Ikemoto, K. (2004). AFTA and the Asian Crisis: Help or Hindrance to ASEAN Intra‐Regional Trade?. Asian
Economic Journal, 18(1), 1-23.
Hasanov, F., & Senhadji, A. (2008). Macroeconomic balance approach and assessment of exchange rate misalignments. In
Assessment of Exchange Rates, Middle East and Central Asia Department, International Monetary Fund.
Head, K., & Mayer, T. (2000). Non-Europe: the magnitude and causes of market fragmentation in the EU. Review of World
Economics, 136(2), 284-314.
Johnson, R., & Soenen, L. (2002). Asian economic integration and stock market comovement. Journal of Financial
Research, 25(1), 141-157.
Lịch, N. V. (2005). Nghiên cứu cán cân thương mại trong sự nghiệp công nghiệp hóa, hiện đại hóa ở Việt Nam.
Lohi, J. (2013). The Implications of HO and IRS Theories in Bilateral Trade Flows within Sub-Saharan Africa. Global Economy
Journal, 13(2), 175-202.
Mahmood, F., & Jongwanich, J. (2018). Export-enhancing effects of free trade agreements in South Asia: Evidence from
Pakistan. Journal of South Asian Development, 13(1), 24-53.
Ncube, M., Faye, I., Verdier-Chouchane, A., & Lefebure, M. (Eds.). (2014). Regional Integration and Trade in Africa. Springer.
Saiki, A. (2005). Asymmetric effect of currency union for developing countries. Open Economies Review, 16(3), 227-247.
Tinbergen, J. (1962). Shaping the World Economy: Suggestions for an International Economic Policy. New York: The
Twentieth Century Fund.
© 2020 by the authors; licensee Growing Science, Canada. This is an open access article distributed
under the terms and conditions of the Creative Commons Attribution (CC-BY) license
(
File đính kèm:
 impact_of_different_factors_on_vietnams_trade_balance.pdf

