Effect of moisture content and frequency variation on dielectric properties of bamboo (Phyllostachys heterocycla cv. pubescens)
Moisture content of bamboo and frequency are the most important factors that affects dielectric properties of bamboo material. Dielectric properties of bamboo is one of the most important factors to determine the highfrequency hot pressing process parameters of glued laminated bamboo. Therefore, study on dielectric properties of bamboo has important significance. Bamboo was adjusted moisture content under laboratory conditions for 0-18%. Effect of moisture content and frequency variation on dielectric properties of bamboo was determined by using the 4294A Precision Impedance Analyzer with the 16451B. Dielectric properties including dielectric constant (e’) and dielectric loss tangent (tan d) have been done in the moisture content range from 0% to 18% and in the frequency range from 60 Hz to 6 MHz. The results showed that the dielectric constant (e’) and tan d increase with the increasing moisture content and decrease with the increasing frequency. Dielectric constant and tan d increased slowly with the moisture content below fiber saturation point (FSP), increased sharply with the moisture content around the FSP. Dielectric constant and tan d decreased obviously with the frequency below 6 kHz, but changed slowly when it above 6 kHz
Trang 1
Trang 2
Trang 3
Trang 4
Trang 5
Trang 6
Trang 7
Tóm tắt nội dung tài liệu: Effect of moisture content and frequency variation on dielectric properties of bamboo (Phyllostachys heterocycla cv. pubescens)
s, every time was
the cell walls (Sugimoto et al., 2004). 3 days. Moisture content adjustment
 At present, study on dielectric properties of parameters of bamboo samples in Table 1.
 Table 1. Moisture content adjustment parameters of Bamboo
 Moisture Adjustment parameters
 content Time 1 Time 2
 (%) Temperature (0C) Humidity (%) Temperature (0C) Salt solution
 0 100 2 0 ÷ 2 20 -
 6 35 40 20 KNO3
 12 35 78 20 NaCl
 18 35 98 20 MgCl2
 JOURNAL OF FORESTRY SCIENCE AND TECHNOLOGY NO. 5 - 2017 127
 Forest Industry
 The moisture content (MC) of the samples immediately after drying.
were calculated according to the following 2.1.2. Experimentalmethod
formula: MC (%) = [(m1-m0)/m0]×100, where Figure 1 displays the flow chart when using
m1 is the weight of the sample before drying, the 16451B for permittivity measurements.
and m0 is the weight of the sample
 Prepare the Attach the guarded Connect the 16451B Cable length
 dielectric material electrode compensation
 Compensate the Set the measurement Adjust the electrodes Compensation
 residual impedance conditions for adjustment
 Insert the material Cp-D measurement Calculate permittivity
 Figure 1. Measurement procedure flow chart for the 16451B
 When using an impedance-measuring capacitor. The measured capacitance is then
instrument to measure permittivity, the parallel used to calculate permittivity. In an actual test
plate method is usually employed. An setup, two electrodes are configured with a test
overview of the parallel plate method is shown fixture sandwiching dielectric material. The
in Figure 2. impedance- measuring instrument would
 The parallel plate method, also called the measure vector components of capacitance (C)
three terminal method in ASTM D150, and dissipation (D) and a software program
involves sandwiching a thin sheet of material would calculate permittivity and loss tangent.
or liquid between two electrodes to form a
 Figure 2. Parallel plate method
2.1.3. Measurement of Dielectric frequency range from 60 Hz to 6 MHz.
 The measurements of dielectric constant e’ was calculated by using the following
(e’) and tan (d) values of bamboo samples equations: e’ = (ta×Cp)/(A×e0), where Cp (F) is
were made by using a Agilent 4294A Precision equivalent parallel capacitance, ta (m) is
Impedance Analyze with the 16451B, in the average thickness of test sample, A (m2) is area
 -12
moisture content range from 0% to 18% and of Guarded electrode, and e0 = 8.854×10
128 JOURNAL OF FORESTRY SCIENCE AND TECHNOLOGY NO. 5 - 2017
 Forest Industry
[F/m]. Each sample had tested with 3 times. bamboo sample increased in the order of the
Value of e’ and tan d were averaged. treatment moisture contents
III. RESULTS AND DISCUSSION (0%<6%<12%<18%). Moisture content is the
3.1. Dielectric constant (e’) dominating factor over duration of adjusting in
 The change of dielectric constant as a increasing e’. The same dielectric constant can
function of moisture content at several be obtained at lower treatment frequency with
frequencies for bamboo is shown in Figure 3. lower moisture content or by using higher
It is visible that dielectric constant of bamboo treatment frequency with higher moisture
is directly related to treatment severity, which content. For example, with the same treatment
depends on the moisture content. e’ increased time were nine days, dielectric constant of
with increasing moisture content showing bamboo samples were about 6.0 0.5 when
anomaly at the transition MC from 0% to 18%. moisture content at 6% for 60Hz but only
e’ decreased with increasing frequency from required 20% at 6 MHz.
60 Hz to 6 MHz. e’ increased with increasing Dielectric constant of the bamboo in the dry
severity of moisture content treatment. With state has lowest value (2.0) and has highest
the same moisture content condition, in value 2.19 with different frequency.
general, e’ of treated bamboo sample decreased Dielectric constant of the bamboo at MC
in the order of the frequencies from small to 18% has the lowest value (6.68) with
large. It is quite the reverse, with different frequency at 6 MHz and it has the highest
moisture content conditions on the same value (61.34) with frequency at 60 Hz.
bamboo sample, in general, e’ of treated
 70.00
 60Hz 600Hz 6KHz 60KHz 600KHz 6MHz
 60.00
 50.00
 '
 e
 40.00
 30.00
 Dielectric constant constant Dielectric
 20.00
 10.00
 -
 0 2 4 6 8 10 12 14 16 18 20
 Moisture content (%)
 Figure 3. Variation of Dielectric constant e' for Bamboo at different moisture contents
 and frequencies
 Table 2 presents the two-way analysis of constant, (P-value < 0.0001). In addition, these
variance (ANOVA) results of the e’ of two factors showed significant interaction on
bamboo. Moisture content and frequency the dielectric constant of bamboo.
showed significant effects on dielectric
 JOURNAL OF FORESTRY SCIENCE AND TECHNOLOGY NO. 5 - 2017 129
 Forest Industry
 Table 2. Two-Factor Without Replication results of dielectric constant of bamboo
 Source df F-value P-value
 f 5 42.70 < 0.0001
 MC 3 158.29 < 0.0001
 f×MC 15 13.66 < 0.0001
 f – Frequency.
 MC – Moisture content.
 f×MC – Interaction of frequency and moisture content.
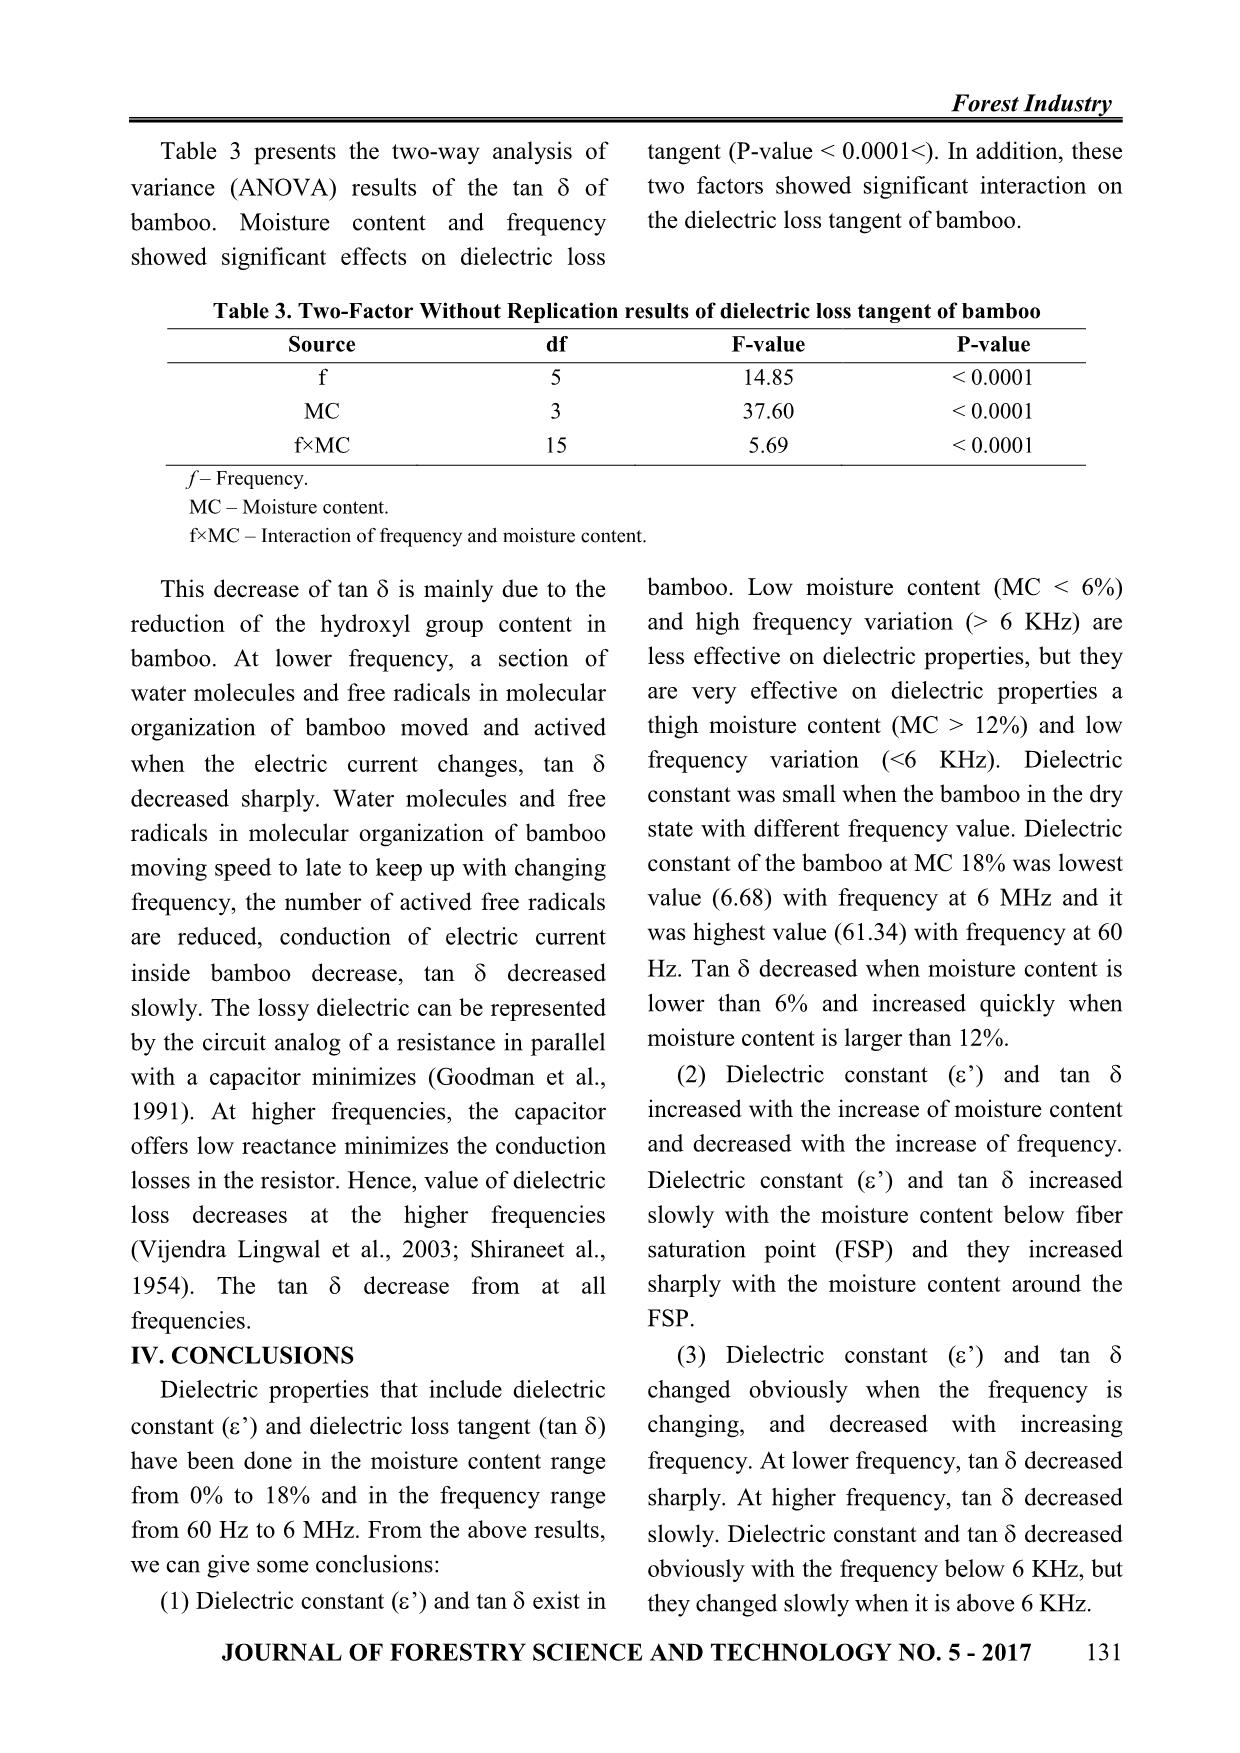
 This increase of e’ is due to the increased bamboo is near the fiber saturation point, the
mobility of water dipoles in bamboo. Water movement speed of molecules bamboo is
has OH molecules and OH of water acts as a faster, the electrical conductivity increased to
dipole (Chand et al., 1994). These dipoles make dielectric constant increased. At lower
contribute to the e’ behaviour of the bamboo. frequencies, because the water molecules's
The bound water content of bamboo gradually dipolar are absorbed, lead to e’ values in the
increased when the moisture content of bamboo is high.
bamboo increased, e’of water is relatively high 3.2. Dielectric loss tangent d
( 81) (Liu et al., 2004), lead to e’ increases The change of tan d value is shown in
with increasing of water in bamboo. When Figure 4. It is visible that dielectric loss
moisture content of bamboo is lower than the tangent of bamboo was observed increasing
fiber saturation point, the bound water of with increasing moisture constant and
bamboo fibers has not been in a saturated state. decreasing with increasing frequency. Tan d
Therefore, freedom degree of functional decreased when moisture content is lower than
groups in bamboo molecules are quite small, 6% and increased quickly when moisture
kinetic energy of molecule is small that effect content is larger than 12%. Tan d increased
the electrical conductivity, the dielectric
 slowly with the moisture content below fiber
constant increases quite slowly. Dielectric
 saturation point (FSP), increased sharply with
constant decreased when moisture content is
 the moisture content around the FSP. Tan d
lower than 6% with frequency variation and
 decreased sharply at the low frequency (< 6
which increased quickly when moisture
content is larger than 12% with high frequency KHz) and decreased slowly at the high
value (> 6 KHz). The moisture content of frequency (> 6 KHz).
 2.70
 60Hz 600Hz 6KHz
 2.40 60KHz 600KHz 6MHz
 2.10
 d
 1.80
 1.50
 1.20
 0.90
 Dielectric loss tangent lossDielectric tangent
 0.60
 0.30
 -
 0 2 4 6 8 10 12 14 16 18 20
 Moisture content (%)
 Figure 4. Variation of Dielectric loss tangent d for Bamboo sample at different moisture contents
 and frequencies
130 JOURNAL OF FORESTRY SCIENCE AND TECHNOLOGY NO. 5 - 2017
 Forest Industry
 Table 3 presents the two-way analysis of tangent (P-value < 0.0001<). In addition, these
variance (ANOVA) results of the tan d of two factors showed significant interaction on
bamboo. Moisture content and frequency the dielectric loss tangent of bamboo.
showed significant effects on dielectric loss
 Table 3. Two-Factor Without Replication results of dielectric loss tangent of bamboo
 Source df F-value P-value
 f 5 14.85 < 0.0001
 MC 3 37.60 < 0.0001
 f×MC 15 5.69 < 0.0001
 f – Frequency.
 MC – Moisture content.
 f×MC – Interaction of frequency and moisture content.
 This decrease of tan d is mainly due to the bamboo. Low moisture content (MC < 6%)
reduction of the hydroxyl group content in and high frequency variation (> 6 KHz) are
bamboo. At lower frequency, a section of less effective on dielectric properties, but they
water molecules and free radicals in molecular are very effective on dielectric properties a
organization of bamboo moved and actived thigh moisture content (MC > 12%) and low
when the electric current changes, tan d frequency variation (<6 KHz). Dielectric
decreased sharply. Water molecules and free constant was small when the bamboo in the dry
radicals in molecular organization of bamboo state with different frequency value. Dielectric
moving speed to late to keep up with changing constant of the bamboo at MC 18% was lowest
frequency, the number of actived free radicals value (6.68) with frequency at 6 MHz and it
are reduced, conduction of electric current was highest value (61.34) with frequency at 60
inside bamboo decrease, tan d decreased Hz. Tan d decreased when moisture content is
slowly. The lossy dielectric can be represented lower than 6% and increased quickly when
by the circuit analog of a resistance in parallel moisture content is larger than 12%.
with a capacitor minimizes (Goodman et al., (2) Dielectric constant (e’) and tan d
1991). At higher frequencies, the capacitor increased with the increase of moisture content
offers low reactance minimizes the conduction and decreased with the increase of frequency.
losses in the resistor. Hence, value of dielectric Dielectric constant (e’) and tan d increased
loss decreases at the higher frequencies slowly with the moisture content below fiber
(Vijendra Lingwal et al., 2003; Shiraneet al., saturation point (FSP) and they increased
1954). The tan d decrease from at all sharply with the moisture content around the
frequencies. FSP.
IV. CONCLUSIONS (3) Dielectric constant (e’) and tan d
 Dielectric properties that include dielectric changed obviously when the frequency is
constant (e’) and dielectric loss tangent (tan d) changing, and decreased with increasing
have been done in the moisture content range frequency. At lower frequency, tan d decreased
from 0% to 18% and in the frequency range sharply. At higher frequency, tan d decreased
from 60 Hz to 6 MHz. From the above results, slowly. Dielectric constant and tan d decreased
we can give some conclusions: obviously with the frequency below 6 KHz, but
 (1) Dielectric constant (e’) and tan d exist in they changed slowly when it is above 6 KHz.
 JOURNAL OF FORESTRY SCIENCE AND TECHNOLOGY NO. 5 - 2017 131
 Forest Industry
 REFERENCES 32(6), 18-21.
 1. Zhang, Q. S. (1995). Industrial utilization of 8. Chia, L.H.L., Chua, P.H., Hon, Y.S., and Lee, E.
bamboo in China (in Chinese). China Forestry (1986). A preliminary study on the dielectric constant of
Publishing House, Beijing. WPC based on some tropical woods. Int. J. Radiation
 2. Zhang, Q.S., Jiang, S.X., and Tang, Y.Y. (2001). Applications and Instrumentation C Radiation Phys.
Industrial utilization on bamboo (in Chinese). Chem, 27, 207-210.
International network for bamboo and rattan, Beijing. 9. Sugimoto, H., and Norimoto, M. (2004).
 3. Yin, S.C. (1996). Wood Science (in Chinese). Dielectric relaxation due to interfacial polarization for
China Forestry Publishing House, Beijing. heat-treated wood. Carbon, 42, 211-218.
 4. Khan, M.A., Blriss, K.M., and Wang, W. (1991). 10. Chand, N., and Joshi, S. K. (1994). Temperature
Electrical properties and X-ray diffraction of wood and dependence of dielectric behaviour of sisal fibre. J.
wood plastic composite (WPC). Int. J. Radiation Mater. Sci. Lett, 13, 156-158.
Applications and Instrumentation C Radiation Phys. 11. Liu, Y. X., and Zhao, G.J. (2004). Wood
Chem, 38, 303-306. Resource Materials Science. China Forestry Publishing
 5. Chand, N., Jain, D., and Nigrawal, A. (2006). House, Beijing, China.
Investigation on Gradient Dielectriec Characteristics of 12. Goodman, G., Buchanan, R.C., and Reynolds,
Bamboo (Dentroclamusstrictus). J. App.Polym. Sci. 102, T.G. (1991). In Ceramic Materials for electronics;
380-386. Processing, properties, and applications(ed.). Buchanan,
 6. Iliadis, L., Tachos, S., Avramidis, S., and R. C. , Marcel Dekker, New York, pp. 32.
Mansfield (2013). Hybrid e-regression and validation 13. Shirane, G., Newnham,R., and Pepinsky, R.
soft computing techniques: The case of wood dielectric (1954). Dielectric properties and phase transitions of
loss factor. Neurocomputing,107 (1), 33-39. NaNbO3 and (Na,K)NbO3. Phys. Rev, 96, 581-588.
 7. Xu, S.K., Tang, Y., Zhang, W.G., Yu, X.F., Pan, 14. Lingwal, V., Semwal, B.S., and Panwar, N.S.
E.Q., and Li, Y.J. (2012). Study on Dielectric (2003). Dielectric properties of Na1-xKxNbO3 in
Properties of Bamboo Culm. J. Zhejiang. Sci. technol. orthorhombic phase. Bull. Mater. Sci. 26(6), 619-625.
 ẢNH HƯỞNG CỦA ĐỘ ẨM VÀ TẦN SỐ ĐẾN ĐẶC TÍNH ĐIỆN MÔI
 CỦA TRE (Phyllostachys heterocycla cv. pubescens)
 Nguyễn Thị Hương Giang1, Trần Văn Chứ2
 1,2 Trường Đại học Lâm nghiệp
 TÓM TẮT
 Độ ẩm của tre và giá trị tần số là những nhân tố quan trọng nhất ảnh hưởng đến đặc tính điện môi của tre. Đặc
 tính điện môi lại là một trong những nhân tố quan trọng nhất dùng để xác định các thông số công nghệ của quá
 trình ép nhiệt cao tần ván ghép khối tre. Vì vậy, việc nghiên cứu đặc tính điện môi của tre có ý nghĩa vô cùng
 quan trọng... Trong bài viết này, độ ẩm của nguyên liệu tre được điều chỉnh từ 0 - 18% trong điều kiện phòng
 thí nghiệm. Sau đó sử dụng thiết bị 4294A kết nối với máy phân tích trở kháng 16451B để xác định ảnh hưởng
 của độ ẩm và tần số đến đặc tính điện môi của tre. Đặc tính điện môi bao gồm hằng số điện môi (e’) và góc tổn
 thất điện môi (tan d) được xác định trong phạm vi độ ẩm từ 0 - 18% và tần số từ 60 Hz - 6 MHz. Kết quả
 nghiên cứu cho thấy, hằng số điện môi (e’) và góc tổn thất điện môi (tan d) tăng khi độ ẩm của tre tăng và giảm
 khi tần số tăng. Hằng số điện môi (e’) và góc tổn thất điện môi (tan d) tăng chậm khi độ ẩm dưới điểm bão hòa
 thớ gỗ (FSP), tăng mạng khi độ ẩm tre gần với điểm bão hòa thớ gỗ FSP. Hằng số điện môi (e’) và góc tổn thất
 điện môi (tan d) không tăng rõ ràng khi tần số ở dưới 6 KHz, nhưng lại thay đổi chậm khi tần số trên 6 KHz.
 Từ khóa: Độ ẩm, góc tổn thất điện môi, hằng số điện môi, tần số, Tre.
 Received : 05/8/2017
 Revised : 24/9/2017
 Accepted : 05/10/2017
 132 JOURNAL OF FORESTRY SCIENCE AND TECHNOLOGY NO. 5 - 2017
File đính kèm:
 effect_of_moisture_content_and_frequency_variation_on_dielec.pdf

