Determinants influencing the profitability of listed food processing firms in Vietnam
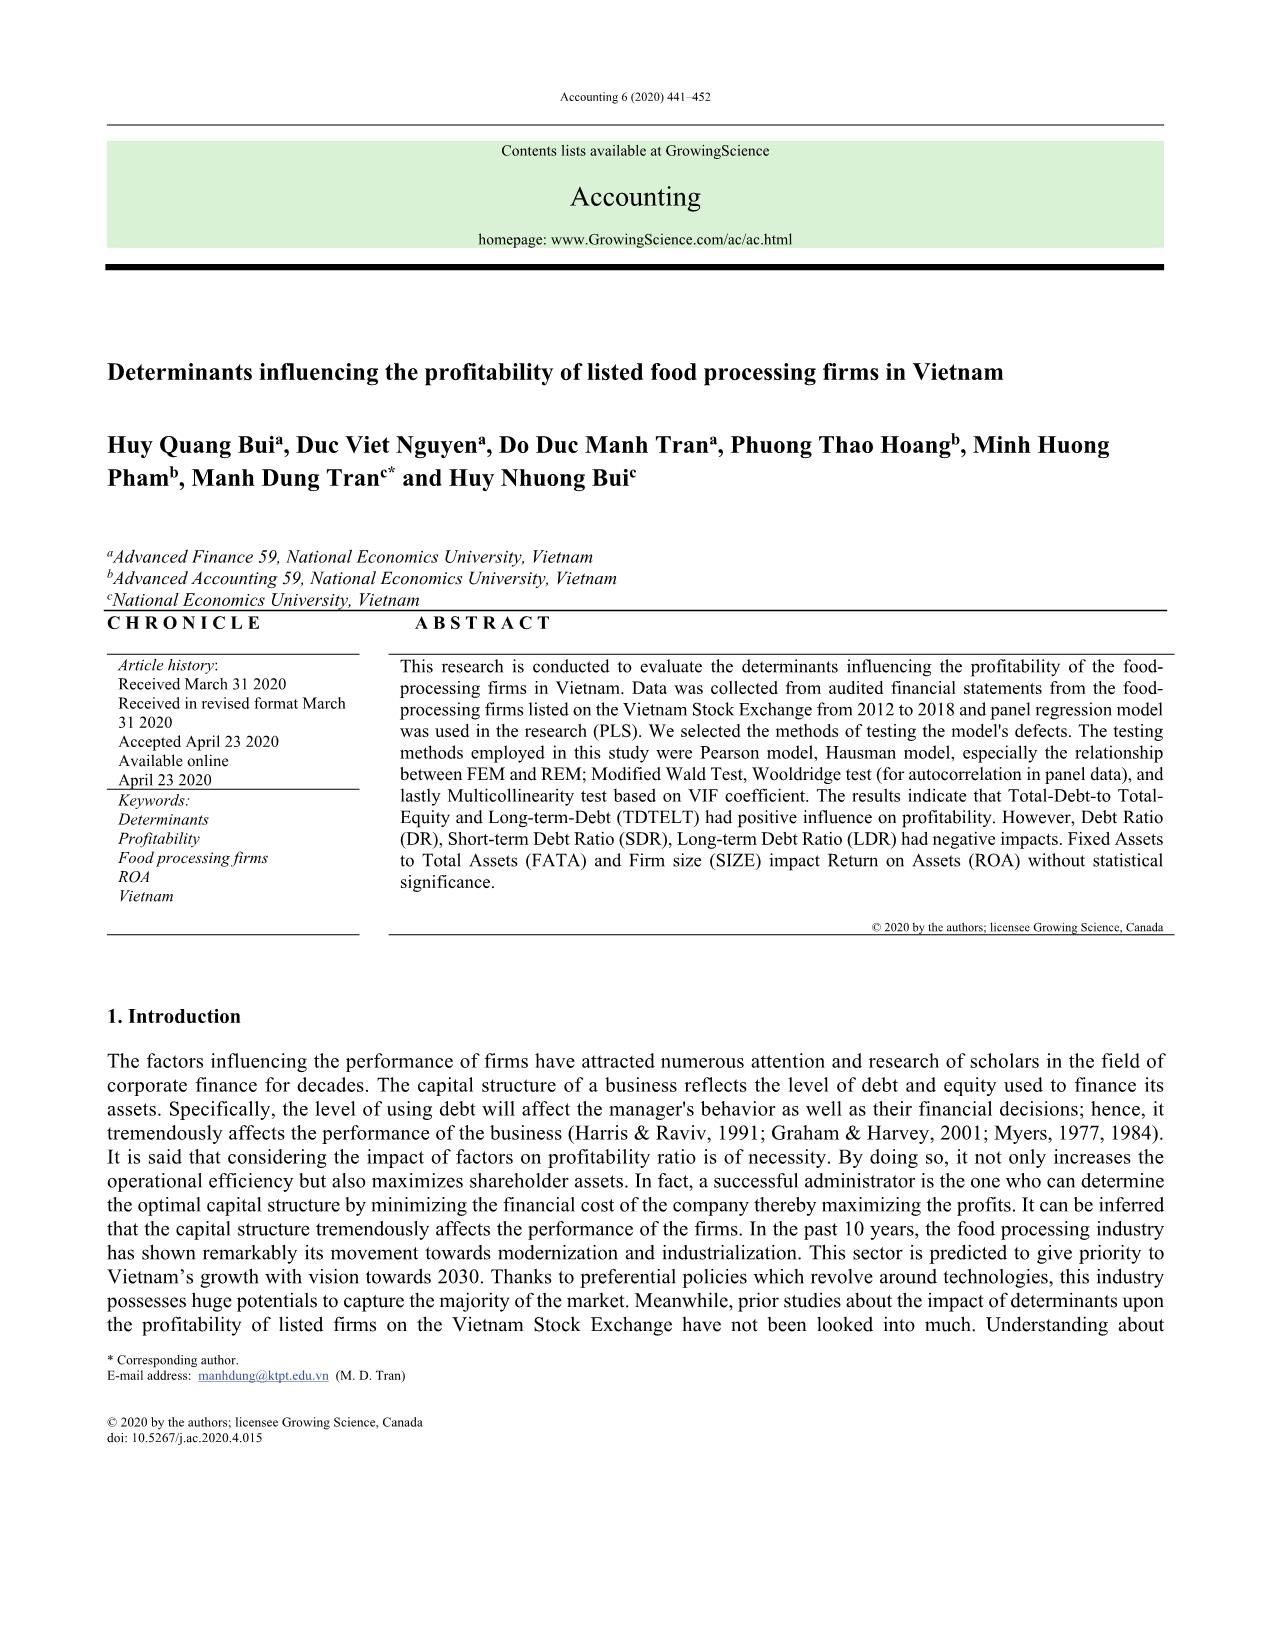
This research is conducted to evaluate the determinants influencing the profitability of the foodprocessing firms in Vietnam. Data was collected from audited financial statements from the foodprocessing firms listed on the Vietnam Stock Exchange from 2012 to 2018 and panel regression model
was used in the research (PLS). We selected the methods of testing the model's defects. The testing
methods employed in this study were Pearson model, Hausman model, especially the relationship
between FEM and REM; Modified Wald Test, Wooldridge test (for autocorrelation in panel data), and
lastly Multicollinearity test based on VIF coefficient. The results indicate that Total-Debt-to TotalEquity and Long-term-Debt (TDTELT) had positive influence on profitability. However, Debt Ratio
(DR), Short-term Debt Ratio (SDR), Long-term Debt Ratio (LDR) had negative impacts. Fixed Assets
to Total Assets (FATA) and Firm size (SIZE) impact Return on Assets (ROA) without statistical
significance
Trang 1
Trang 2
Trang 3
Trang 4
Trang 5
Trang 6
Trang 7
Trang 8
Trang 9
Trang 10
Tải về để xem bản đầy đủ
Tóm tắt nội dung tài liệu: Determinants influencing the profitability of listed food processing firms in Vietnam
heet.
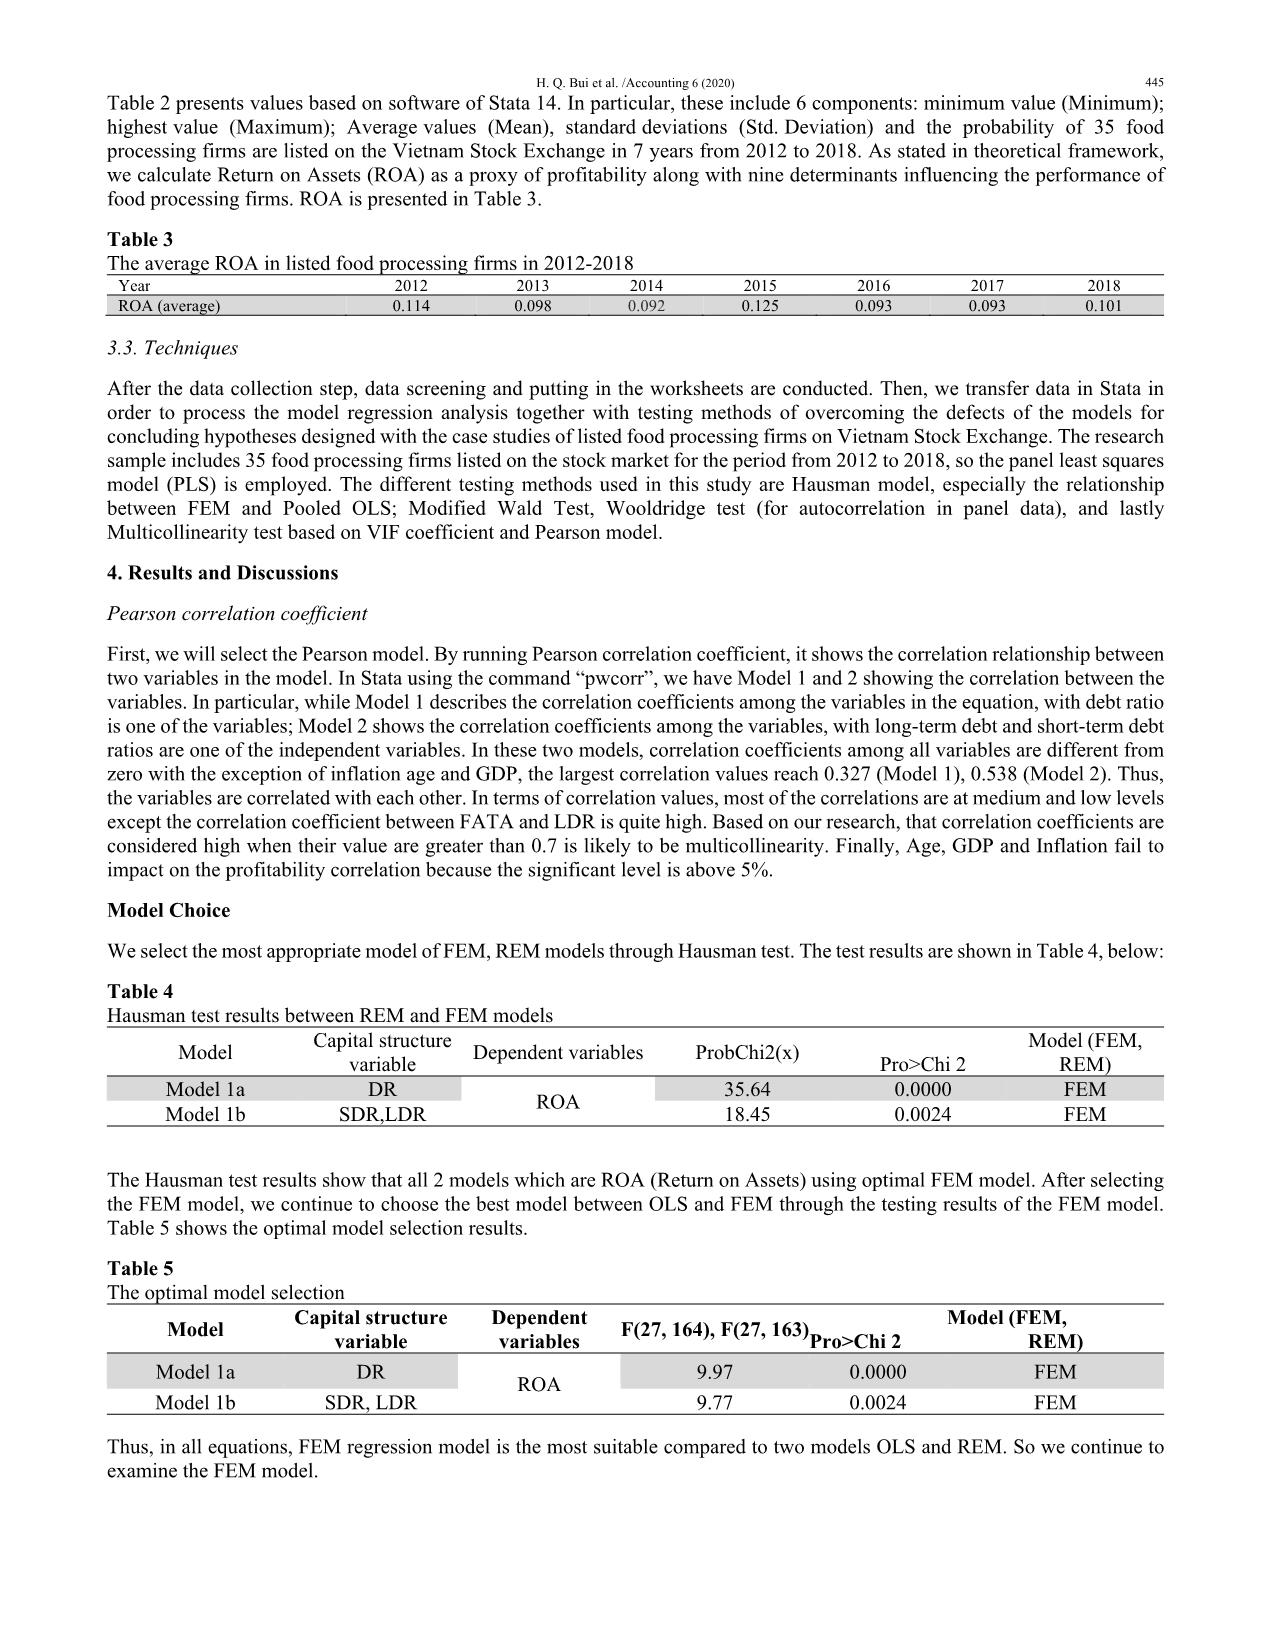
Total Debt to Total Equity and Long Term Debt (TDTELT)
TDTELT has a positive influence on dependent variables of ROA. TDTELT is a measurement of a firm's financial leverage. It
is calculated by taking the firm’s interest-bearing debt, both short and long-term liabilities and dividing it by the long-term debt
plus shareholders’ equity. TDTELT gives analysts and investors a better idea of a firm's capital structure and whether or not the
company is a suitable investment. All else being equal, the higher the TDTELT ratio, the riskier the firm to be invested in. This
finding has the same results with the research of Nguyen (2016) in Vietnam.
Fixed Assets to Total Assets (FATA) impacts on ROA but it has not been statistically significant on them.
Adjusted Model
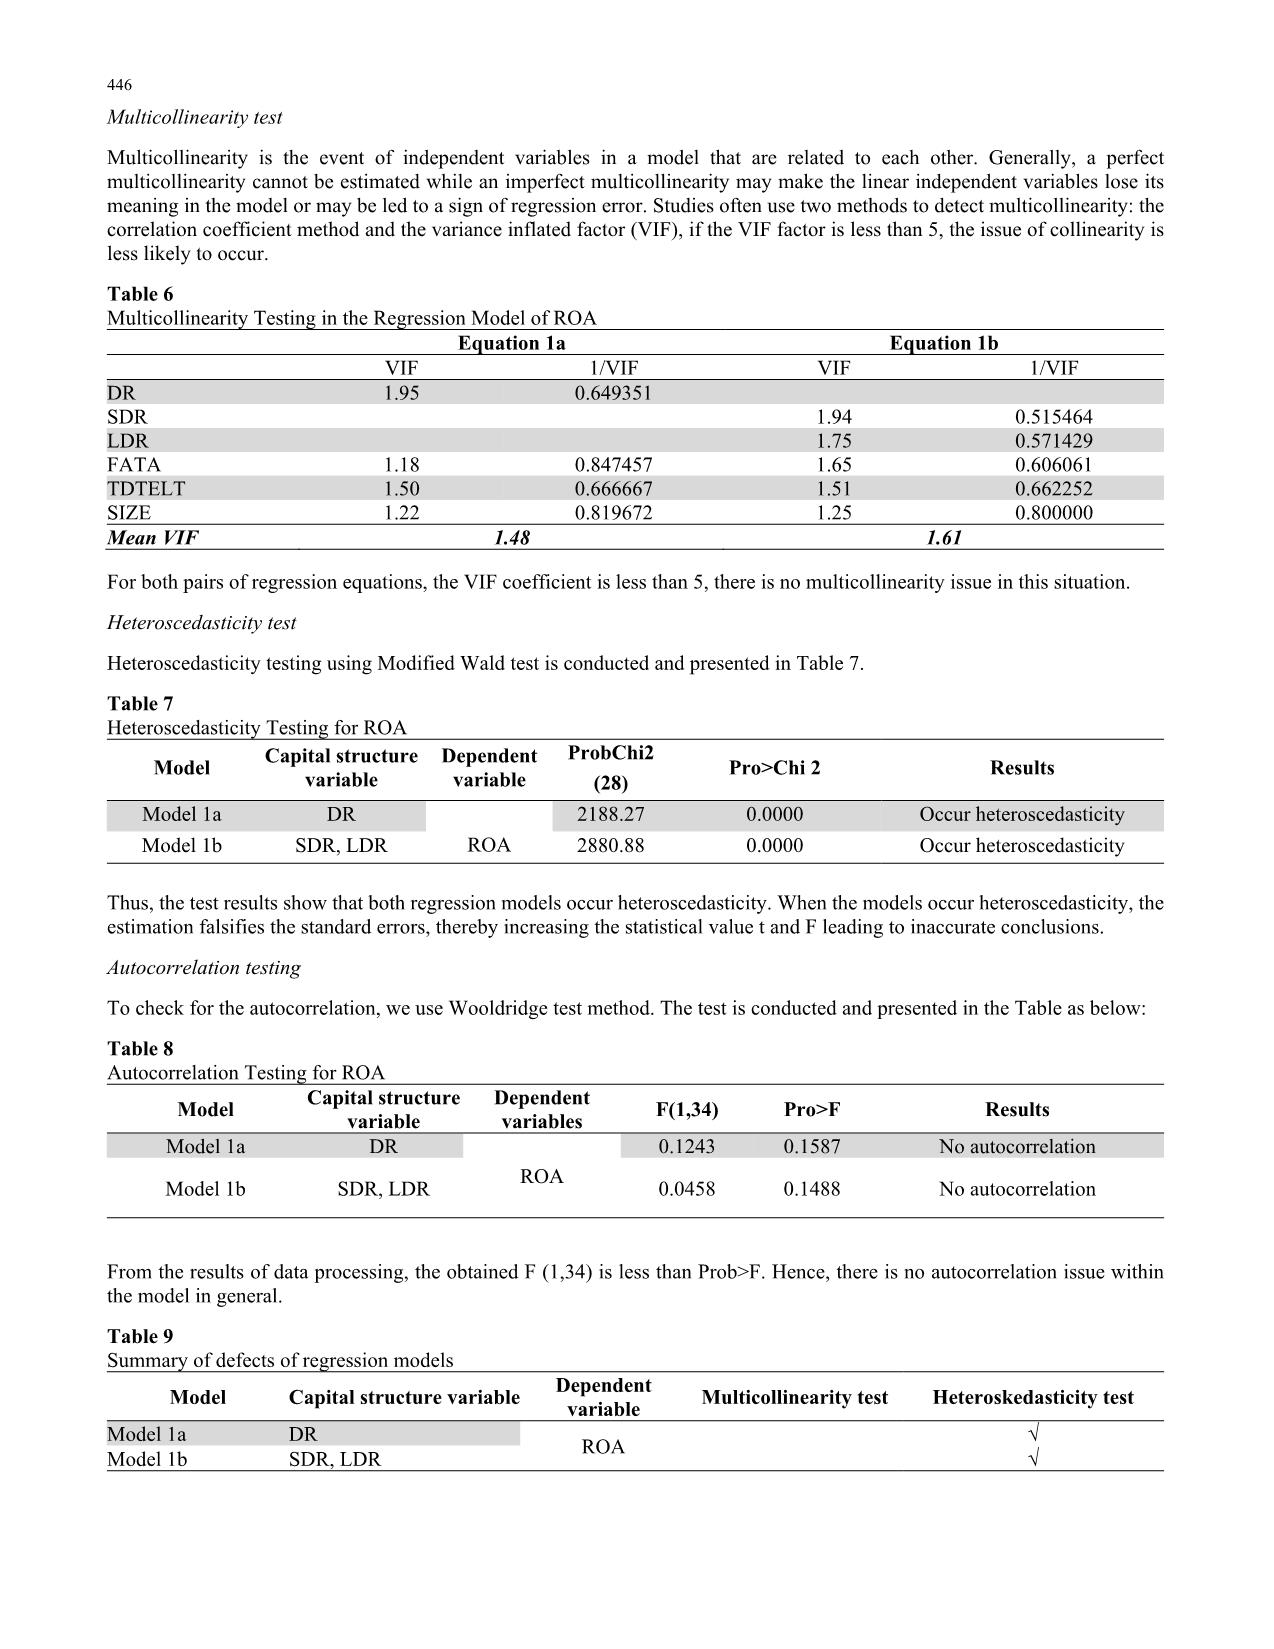
To overcome the above defects of the model, we employ different regression methods, depending on the type of defects. As for
models with dependent variable of Return on Assets (ROA) that heteroscedasticity exists, this error would be fixed by adding
the "robust" command to the end of the FEM regression statement. The results are obtained as shown in Table 10, below:
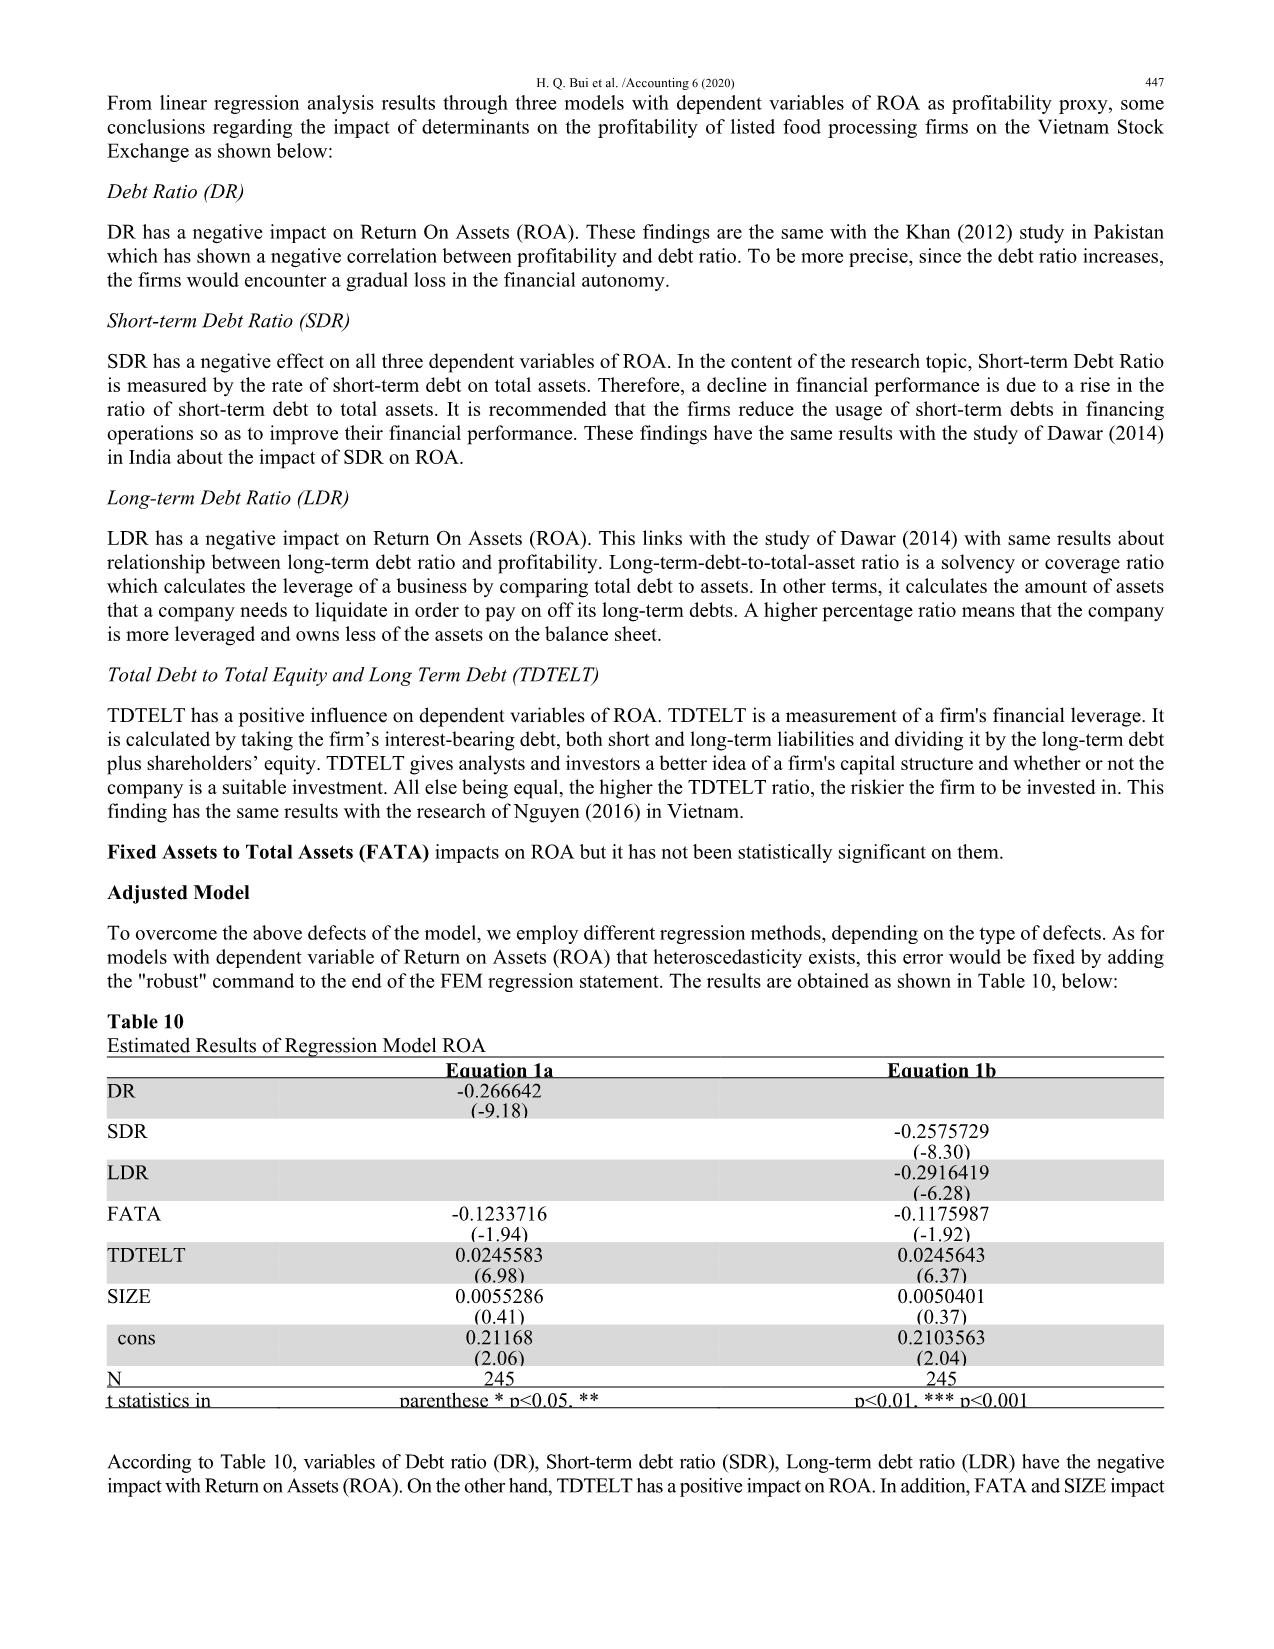
Table 10
Estimated Results of Regression Model ROA
 Equation 1a Equation 1b
DR -0.266642
 (-9.18)
SDR -0.2575729
 (-8.30)
LDR -0.2916419
 (-6.28)
FATA -0.1233716 -0.1175987
 (-1.94) (-1.92)
TDTELT 0.0245583 0.0245643
 (6.98) (6.37)
SIZE 0.0055286 0.0050401
 (0.41) (0.37)
cons 0.21168 0.2103563
 (2.06) (2.04)
N 245 245
t statistics in parenthese * p<0.05, ** p<0.01, *** p<0.001
According to Table 10, variables of Debt ratio (DR), Short-term debt ratio (SDR), Long-term debt ratio (LDR) have the negative
impact with Return on Assets (ROA). On the other hand, TDTELT has a positive impact on ROA. In addition, FATA and SIZE impact
 448
on ROA but have not statistically significant on it.
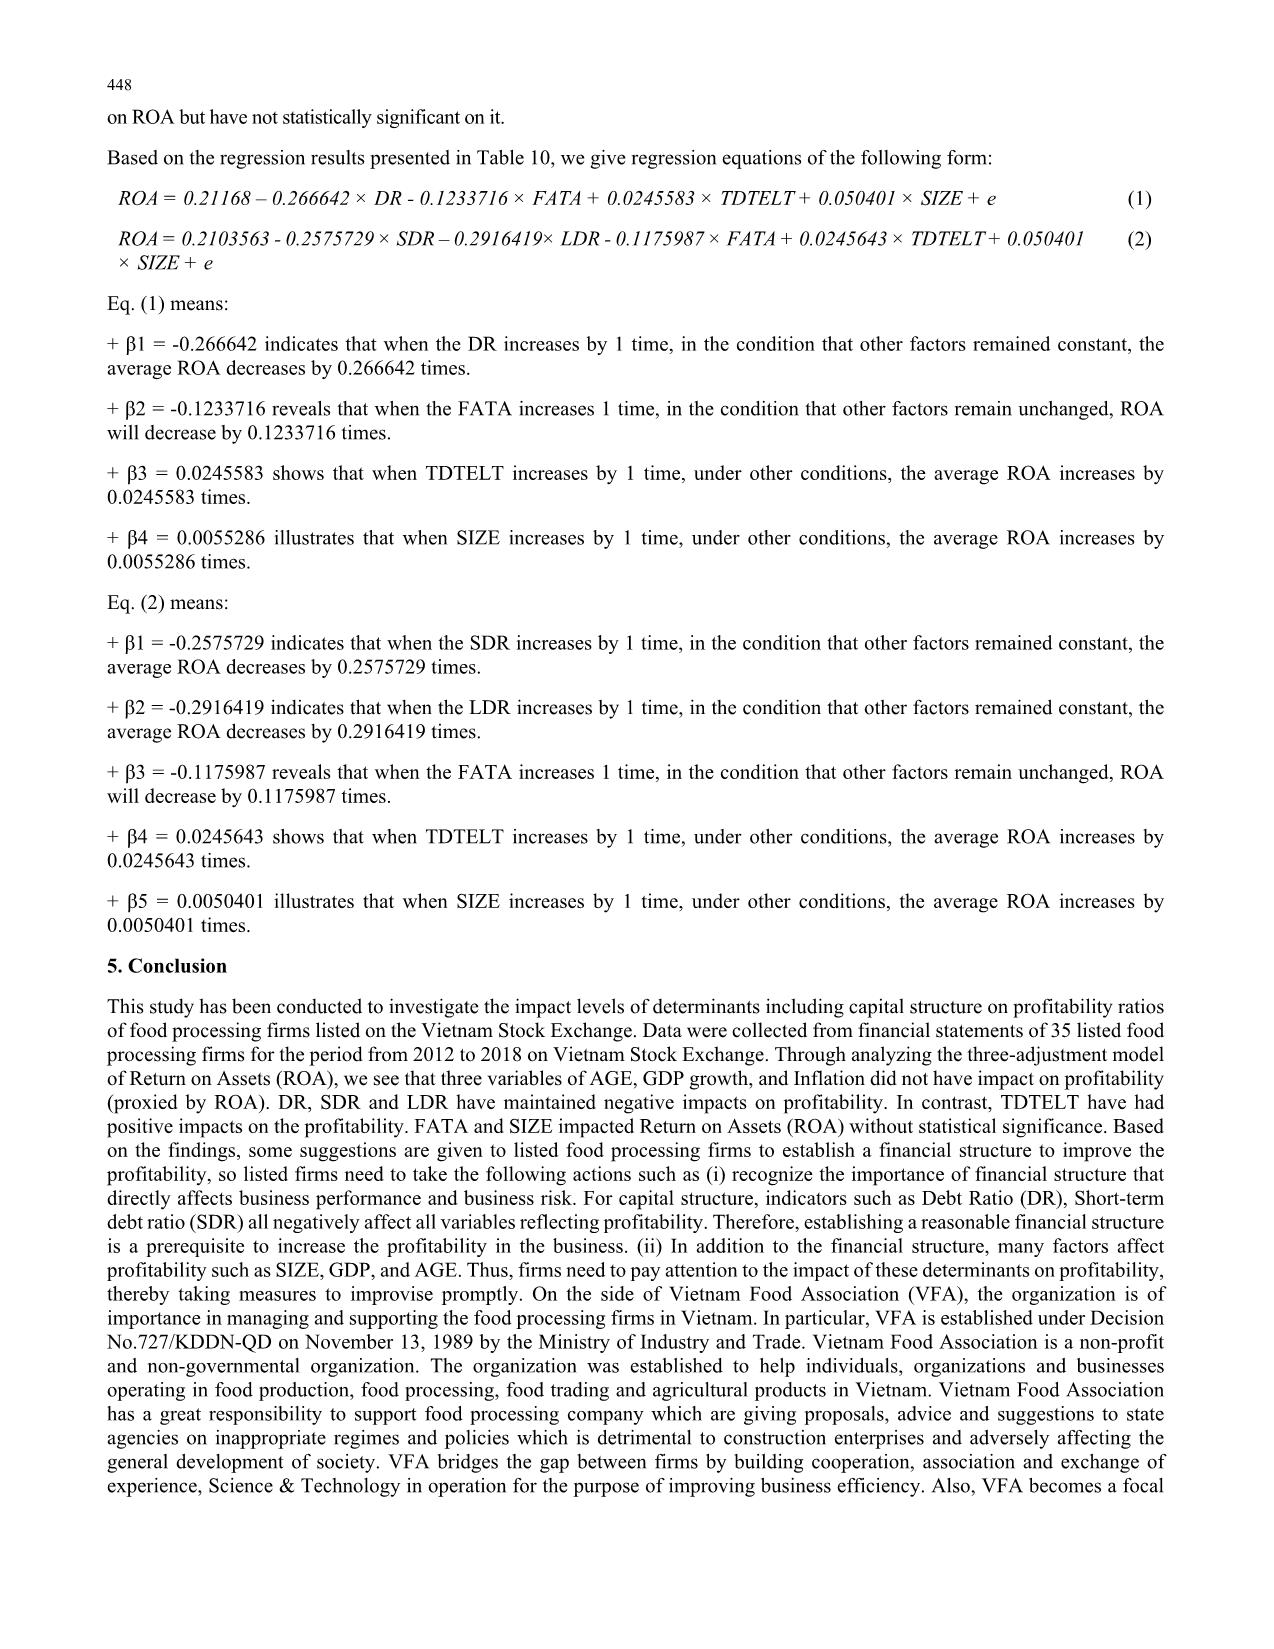
Based on the regression results presented in Table 10, we give regression equations of the following form:
ROA = 0.21168 – 0.266642 × DR - 0.1233716 × FATA + 0.0245583 × TDTELT + 0.050401 × SIZE + e (1)
ROA = 0.2103563 - 0.2575729 × SDR – 0.2916419× LDR - 0.1175987 × FATA + 0.0245643 × TDTELT + 0.050401
× SIZE + e
(2)
Eq. (1) means:
+ β1 = -0.266642 indicates that when the DR increases by 1 time, in the condition that other factors remained constant, the
average ROA decreases by 0.266642 times.
+ β2 = -0.1233716 reveals that when the FATA increases 1 time, in the condition that other factors remain unchanged, ROA
will decrease by 0.1233716 times.
+ β3 = 0.0245583 shows that when TDTELT increases by 1 time, under other conditions, the average ROA increases by
0.0245583 times.
+ β4 = 0.0055286 illustrates that when SIZE increases by 1 time, under other conditions, the average ROA increases by
0.0055286 times.
Eq. (2) means:
+ β1 = -0.2575729 indicates that when the SDR increases by 1 time, in the condition that other factors remained constant, the
average ROA decreases by 0.2575729 times.
+ β2 = -0.2916419 indicates that when the LDR increases by 1 time, in the condition that other factors remained constant, the
average ROA decreases by 0.2916419 times.
+ β3 = -0.1175987 reveals that when the FATA increases 1 time, in the condition that other factors remain unchanged, ROA
will decrease by 0.1175987 times.
+ β4 = 0.0245643 shows that when TDTELT increases by 1 time, under other conditions, the average ROA increases by
0.0245643 times.
+ β5 = 0.0050401 illustrates that when SIZE increases by 1 time, under other conditions, the average ROA increases by
0.0050401 times.
5. Conclusion
This study has been conducted to investigate the impact levels of determinants including capital structure on profitability ratios
of food processing firms listed on the Vietnam Stock Exchange. Data were collected from financial statements of 35 listed food
processing firms for the period from 2012 to 2018 on Vietnam Stock Exchange. Through analyzing the three-adjustment model
of Return on Assets (ROA), we see that three variables of AGE, GDP growth, and Inflation did not have impact on profitability
(proxied by ROA). DR, SDR and LDR have maintained negative impacts on profitability. In contrast, TDTELT have had
positive impacts on the profitability. FATA and SIZE impacted Return on Assets (ROA) without statistical significance. Based
on the findings, some suggestions are given to listed food processing firms to establish a financial structure to improve the
profitability, so listed firms need to take the following actions such as (i) recognize the importance of financial structure that
directly affects business performance and business risk. For capital structure, indicators such as Debt Ratio (DR), Short-term
debt ratio (SDR) all negatively affect all variables reflecting profitability. Therefore, establishing a reasonable financial structure
is a prerequisite to increase the profitability in the business. (ii) In addition to the financial structure, many factors affect
profitability such as SIZE, GDP, and AGE. Thus, firms need to pay attention to the impact of these determinants on profitability,
thereby taking measures to improvise promptly. On the side of Vietnam Food Association (VFA), the organization is of
importance in managing and supporting the food processing firms in Vietnam. In particular, VFA is established under Decision
No.727/KDDN-QD on November 13, 1989 by the Ministry of Industry and Trade. Vietnam Food Association is a non-profit
and non-governmental organization. The organization was established to help individuals, organizations and businesses
operating in food production, food processing, food trading and agricultural products in Vietnam. Vietnam Food Association
has a great responsibility to support food processing company which are giving proposals, advice and suggestions to state
agencies on inappropriate regimes and policies which is detrimental to construction enterprises and adversely affecting the
general development of society. VFA bridges the gap between firms by building cooperation, association and exchange of
experience, Science & Technology in operation for the purpose of improving business efficiency. Also, VFA becomes a focal
H. Q. Bui et al. /Accounting 6 (2020) 449
point to recognize the difficulties of listed firms and advising the government on programs to support business development and
increase production value. On the side of Stock Exchanges in Vietnam (Stock Exchange of Hanoi: HNX; and Stock Exchange
of Ho Chi Minh City: HOSE), they play a great role in managing, encouraging listed food processing firms to improve.
Therefore, the Stock Exchange should create conditions for businesses in the following aspects which are merging HOSE and
HNX in order to facilitate listed firms to have the same operating environment. Also, it strengthens the monitoring function for
listed firms, create strong sanctions against companies that intentionally cheat information. Based on the data of listed food
firms, the Stock Exchange should calculate more than the average economic indicators of the industry, from which businesses
can compare and position themselves.
References
Abor, J. (2005). The effect of capital structure on profitability: an empirical analysis of listed firms in Ghana. Journal of Risk
Finance, 6, 438-447.
Dawar, V. (2014). Agency Theory, Capital Structure and Firm Performance: Some Indian Evidence. Managerial Finance,
12(40), 1190-1206.
Graham, J.R., & Harvey, C.R. (2001). The theory and practice of corporate finance: Evidence from the field. Journal of
Financial Economics, 60, 187-243.
Harris, M., & Raviv, A. (1991). The theory of Capital Structure. Journal of Finance, 46, 297-355.
Kester, W. (1986). Capital and ownership structure: a comparison of United States and Japanese manufacturing corporations.
Financial Management, 15, 5-16.
Khan, A.G. (2012). The relationship of capital Structure decisions with firm performance: A study of the engineering sector of
Pakistan. International Journal of Accounting and Financial Reporting, 2(1), 245-262.
Myers, S.C. (1977). Determinants of Corporate Borrowing. Journal of Financial Economics, 5, 147-175.
Myers, S.C. (1984). The capital structure puzzle. Journal of Finance, 39, 575-592.
Nguyen, H.C. (2016). Capital Structure and Firm’s Performance: Evidence from HOSE. Master Thesis. Berlin School of
Economics and Law.
Serrasqueiro, Z., & Nunes, P. (2008). Performance and size: empirical evidence from Portuguese SMEs. Small Business
Economics, 31(2), 195-217.
Shepherd, W.G. (1972). The elements of market structure. Review of Economics and Statistics, 54, 25-35.
Tandelilin, E. (2010). Portofolio dan Investasi Teori dan Aplikasi (Edisi Pert). Yogyakarta: Kanisius. Indonesia.
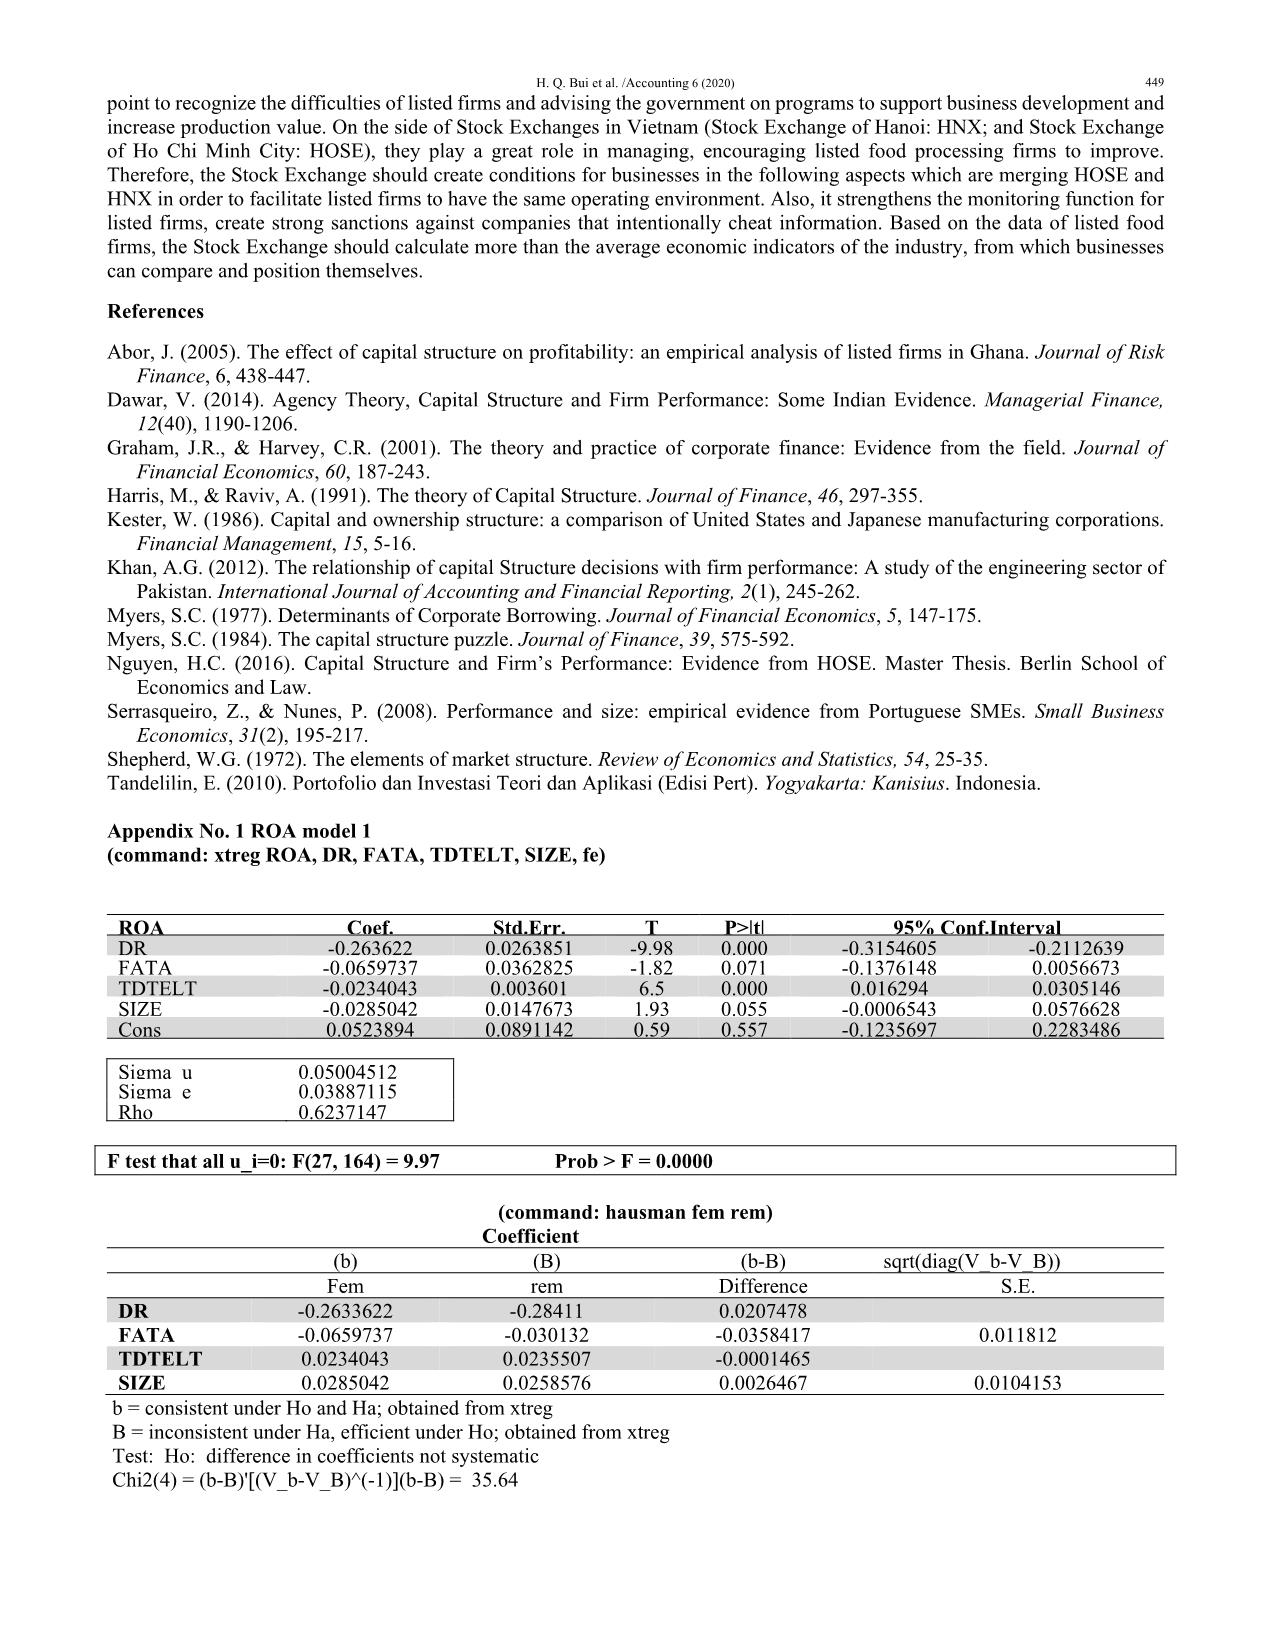
Appendix No. 1 ROA model 1
(command: xtreg ROA, DR, FATA, TDTELT, SIZE, fe)
ROA Coef. Std.Err. T P>|t| 95% Conf.Interval
DR -0.263622 0.0263851 -9.98 0.000 -0.3154605 -0.2112639
FATA -0.0659737 0.0362825 -1.82 0.071 -0.1376148 0.0056673
TDTELT -0.0234043 0.003601 6.5 0.000 0.016294 0.0305146
SIZE -0.0285042 0.0147673 1.93 0.055 -0.0006543 0.0576628
Cons 0.0523894 0.0891142 0.59 0.557 -0.1235697 0.2283486
Sigma u 0.05004512
Sigma e 0.03887115
Rho 0.6237147
F test that all u_i=0: F(27, 164) = 9.97 Prob > F = 0.0000
(command: hausman fem rem)
 Coefficient
 (b) (B) (b-B) sqrt(diag(V_b-V_B))
 Fem rem Difference S.E.
DR -0.2633622 -0.28411 0.0207478
FATA -0.0659737 -0.030132 -0.0358417 0.011812
TDTELT 0.0234043 0.0235507 -0.0001465
SIZE 0.0285042 0.0258576 0.0026467 0.0104153
 b = consistent under Ho and Ha; obtained from xtreg
 B = inconsistent under Ha, efficient under Ho; obtained from xtreg
 Test: Ho: difference in coefficients not systematic
 Chi2(4) = (b-B)'[(V_b-V_B)^(-1)](b-B) = 35.64
 450
 Prob>chi2 = 0.0000 (V_b-V_B is not positive definite)
(command: xttest3)
Modified Wald test for groupwise heteroskedasticity
in fixed effect regression model:
H0: sigma(i)^2 = sigma^2 for all i
chi2 (28) = 2188.27
Prob>chi2 = 0.0000
(command: xtserial ROA, DR, FATA, TDTELT, SIZE)
Wooldridge test for autocorrelation in panel data
H0: no first order autocorrelation
 F( 1, 34) = 0.1243
 Prob > F = 0.1587
(command: collin ROA, DR, FATA, TDTELT, SIZE)
Variables VIF SQRT VIF Tolerance R-squared
ROA 1.54 1.24 0.6511 0.3489
DR 1.95 1.40 0.5137 0.4863
FATA 1.18 1.09 0.8447 0.1533
TDTELT 1.50 1.23 0.6653 0.3347
SIZE 1.22 1.10 0.8213 0.1787
Mean VIF 1.48
 Eigenval Index
1 4.8212 1.0000
2 0.6058 2.8211
3 0.3787 3.5679
4 0.1446 5.7741
5 0.0438 10.4952
6 0.0059 28.5072
Condition Number 28.5072
Eigenvalues & Cond Index computed from scaled raw sscp (w/ intercept)
Det(correlation matrix) 0.4084
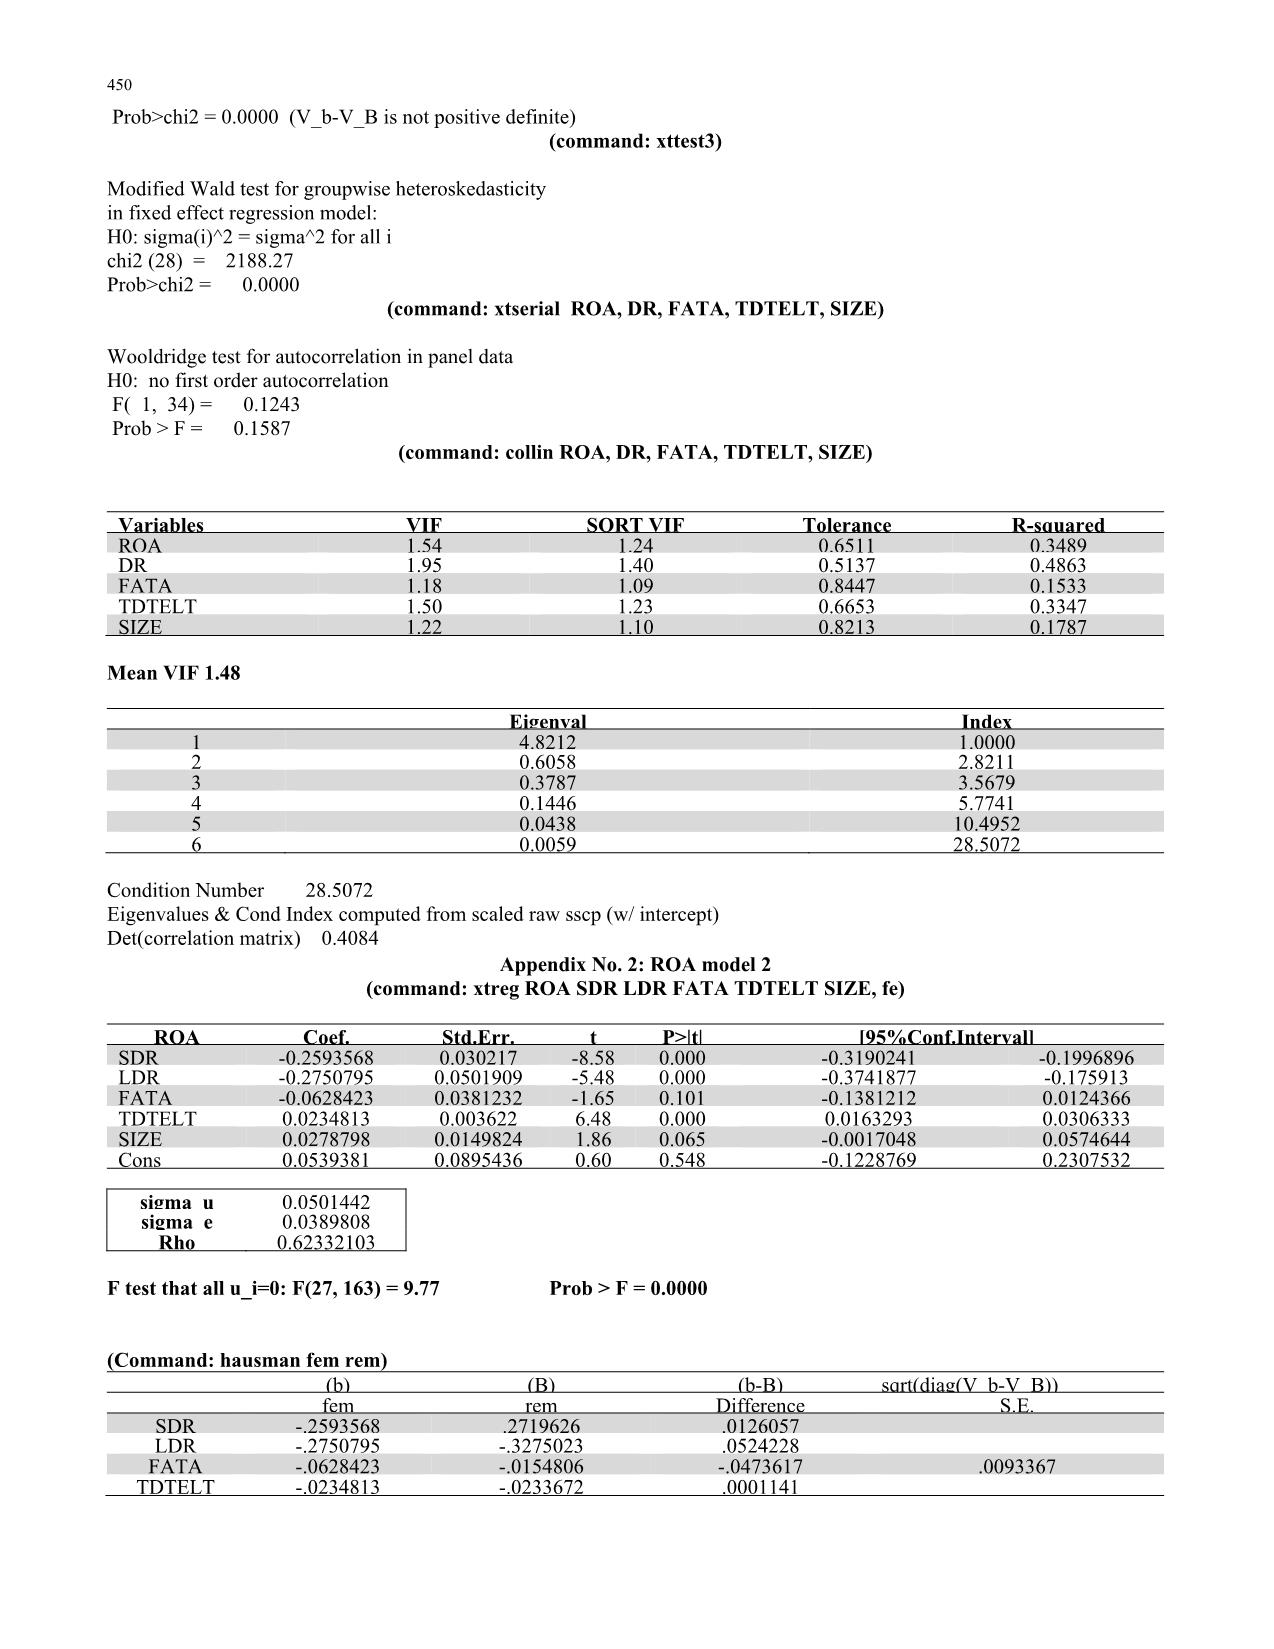
Appendix No. 2: ROA model 2
(command: xtreg ROA SDR LDR FATA TDTELT SIZE, fe)
ROA Coef. Std.Err. t P>|t| [95%Conf.Interval]
SDR -0.2593568 0.030217 -8.58 0.000 -0.3190241 -0.1996896
LDR -0.2750795 0.0501909 -5.48 0.000 -0.3741877 -0.175913
FATA -0.0628423 0.0381232 -1.65 0.101 -0.1381212 0.0124366
TDTELT 0.0234813 0.003622 6.48 0.000 0.0163293 0.0306333
SIZE 0.0278798 0.0149824 1.86 0.065 -0.0017048 0.0574644
Cons 0.0539381 0.0895436 0.60 0.548 -0.1228769 0.2307532
sigma u 0.0501442
sigma e 0.0389808
Rho 0.62332103
F test that all u_i=0: F(27, 163) = 9.77 Prob > F = 0.0000
(Command: hausman fem rem)
 (b) (B) (b-B) sqrt(diag(V b-V B))
 fem rem Difference S.E.
SDR -.2593568 .2719626 .0126057
LDR -.2750795 -.3275023 .0524228
FATA -.0628423 -.0154806 -.0473617 .0093367
TDTELT -.0234813 -.0233672 .0001141
H. Q. Bui et al. /Accounting 6 (2020) 451
SIZE .0278798 .0266708 .001209 .0108629
b = consistent under Ho and Ha; obtained from xtreg
B = inconsistent under Ha, efficient under Ho; obtained from xtreg
Test: Ho: difference in coefficients not systematic
chi2(5) = (b-B)'[(V_b-V_B)^(-1)](b-B) = 18.45 Prob>chi2 = 0.0024
(command:xttest3)
Modified Wald test for groupwise heteroskedasticity
in fixed effect regression model:
H0: sigma(i)^2 = sigma^2 for all i
chi2 (28) = 2180.88; Prob>chi2 = 0.0000
(command: xtserial ROA SDR LDR FATA TDTELT SIZE)
Wooldridge test for autocorrelation in panel data
H0: no first order autocorrelation
 F( 1, 34) = 0.0458 Prob > F = 0.1587
(Command: collin ROA SDR LDR FATA TDTELT SIZE)
Collinearity Diagnostics
 SQRT R-
Variable VIF VIF Tolerance Squared
ROA 1.57 1.25 0.6375 0.3625
SDR 1.94 1.39 0.5148 0.4852
LDR 1.75 1.32 0.5702 0.4298
FATA 1.65 1.28 0.6057 0.3943
TDTELT 1.51 1.23 0.6626 0.3374
SIZE 1.25 1.12 0.7970 0.2030
Mean VIF 1.61
 Eigenval Index
1 5.1170 1.0000
2 0.7993 2.5301
3 0.6167 2.8806
4 0.3077 4.0783
5 0.1090 6.8512
6 0.0447 10.6989
7 0.0056 30.2761
Condition Number 30.2761
 Eigenvalues & Cond Index computed from scaled raw sscp (w/ intercept)
 Det(correlation matrix) 0.2476
(Command:. xtreg ROA DR FATA TDTELT SIZE, fe robust)
Fixed-effects (within) regression Number of obs = 196
Group variable: firm1 Number of groups = 28
R-sq: Obs per group:
within = 0.5681 min = 7
between = 0.5747 avg = 7.0
overall = 0.5659 max = 7
F(4,27) = 238.26
corr(u_i, Xb) = 0.1454 Prob > F = 0.0000
 452
 (Std. Err. adjusted for 28 clusters in firm1)
ROA
Coef.
Robust
Std. Err.
t
P>|t|
[95% Conf. Interval]
DR -.266642 .0290556 -9.18 0.000 -.3256901 -.2075939
FATA -.1233716 .0630774 -1.96 0.059 -.2515603 .004817
TDTELT .0245583 .0035209 6.98 0.000 .017403 .0317136
SIZE .0055286 .0135332 0.41 0.685 -.0219741 .0330314
_cons .21168 .1029421 2.06 0.047 .0024765 .4208836
sigma_u .06397261
sigma_e .05935437
rho .53739436 (fraction of variance due to u_i)
(Command: xtreg ROA SDR LDR FATA TDTELT SIZE, fe robust)
Fixed-effects (within) regression Number of obs = 196
Group variable: firm1 Number of groups = 28
R-sq: Obs per group
within = 0.4683 min = 7
between = 0.4742 avg = 7.0
overall = 0.4651 max = 7
F(5,27) = 197.28
corr (u_i,Xb) = 0.1497 Prob > F = 0.0000
(Std. Err. adjusted for 28 clusters in firm1)
ROA
Coef.
Robust
Std. Err.
t
P>|t|
[95% Conf. Interval]
SDR -.2575729 .0310391 -8.30 0.000 -.320652 -.1944938
LDR -.2916491 .046469 -6.28 0.000 -.3860783 -.1972054
FATA -.1175987 .0612635 -1.92 0.063 -.2421011 .0069038
TDTELT .0245643 .0038555 6.37 0.000 .0167289 .0323997
SIZE .0050401 .0137663 0.37 0.717 -.0229365 .0330167
_cons .2103563 .1030976 2.04 0.049 .0008367 .4198758
sigma_u .06424692
sigma_e .05947044
rho .53855049 (fraction of variance due to u_i)
© 2020 by the authors; licensee Growing Science, Canada. This is an open access article distributed
under the terms and conditions of the Creative Commons Attribution (CC-BY) license
(
File đính kèm:
 determinants_influencing_the_profitability_of_listed_food_pr.pdf

