Concentration and performance in Vietnamese commercial banks
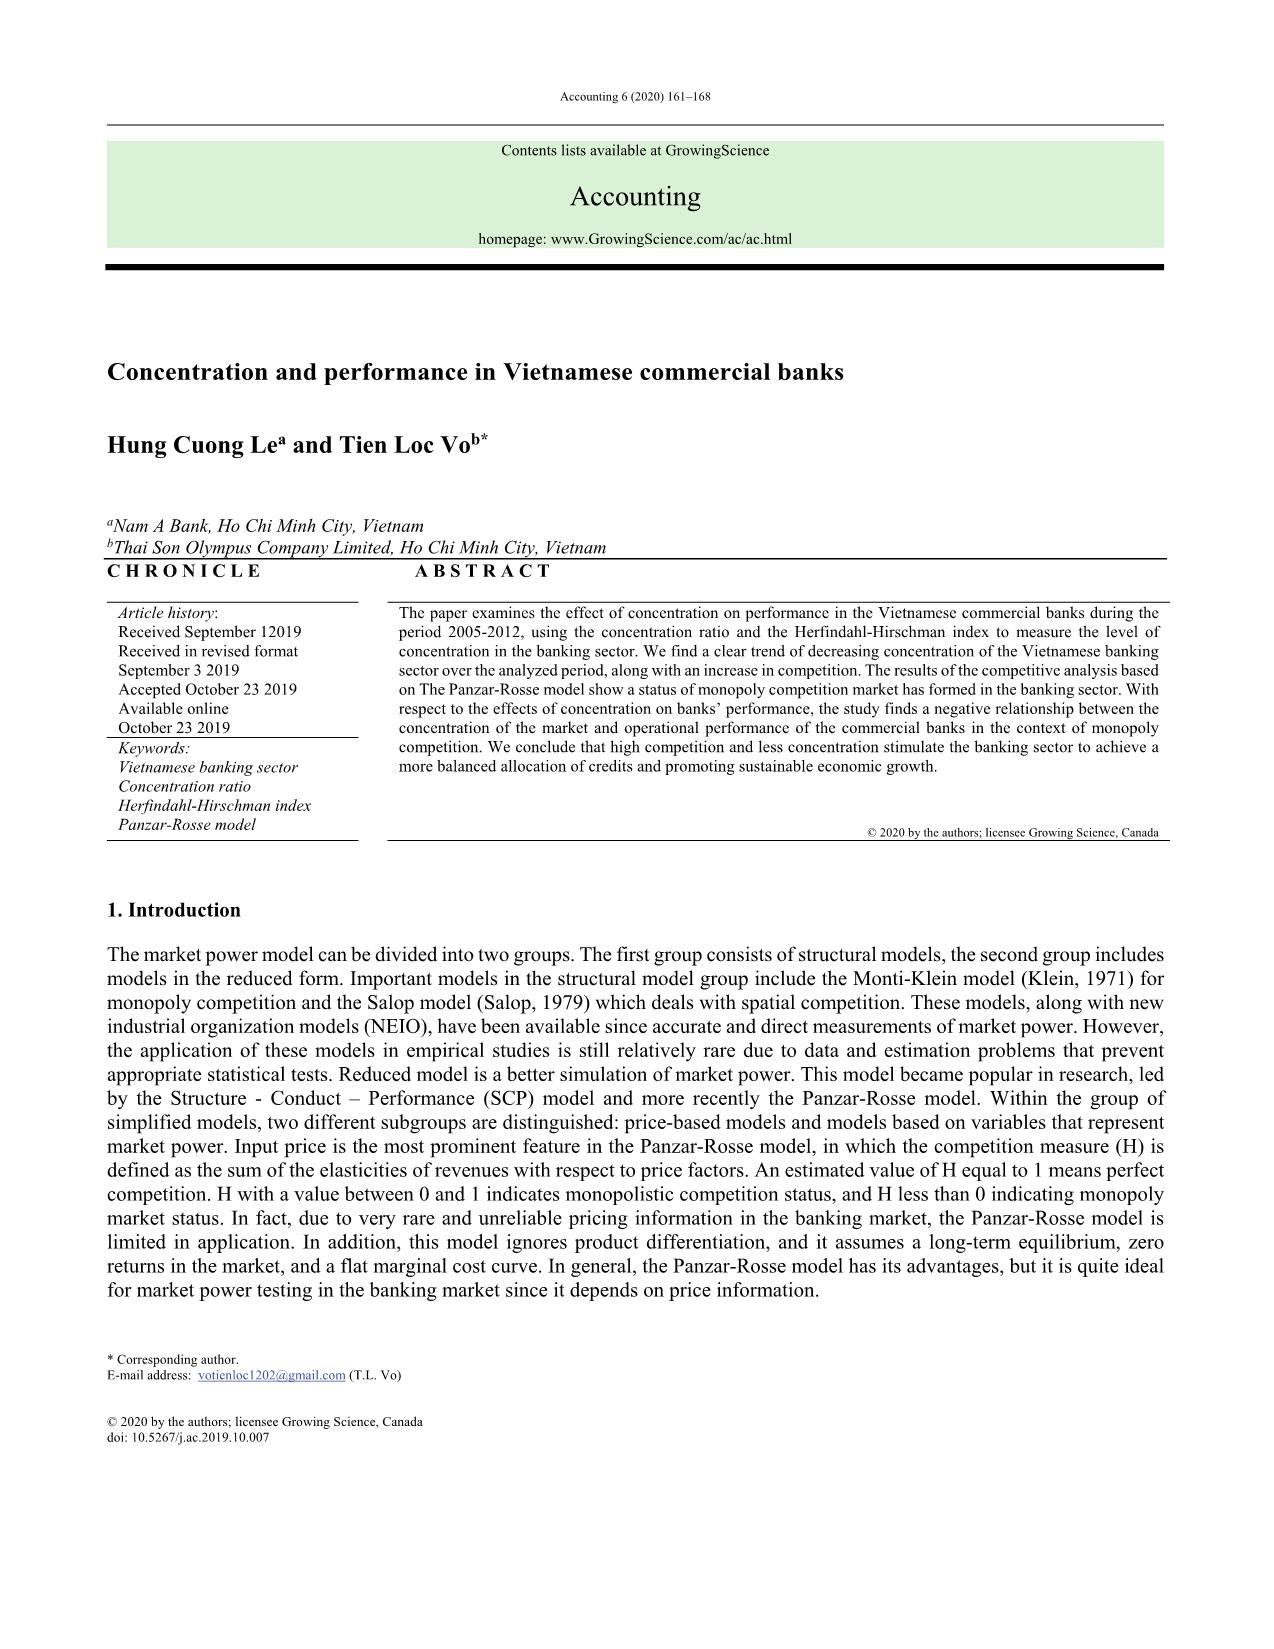
The paper examines the effect of concentration on performance in the Vietnamese commercial banks during the period 2005-2012, using the concentration ratio and the Herfindahl-Hirschman index to measure the level of concentration in the banking sector. We find a clear trend of decreasing concentration of the Vietnamese banking sector over the analyzed period, along with an increase in competition. The results of the competitive analysis based on The Panzar-Rosse model show a status of monopoly competition market has formed in the banking sector. With respect to the effects of concentration on banks’ performance, the study finds a negative relationship between the concentration of the market and operational performance of the commercial banks in the context of monopoly competition. We conclude that high competition and less concentration stimulate the banking sector to achieve a more balanced allocation of credits and promoting sustainable economic growth
Trang 1
Trang 2
Trang 3
Trang 4
Trang 5
Trang 6
Trang 7
Trang 8
Tóm tắt nội dung tài liệu: Concentration and performance in Vietnamese commercial banks
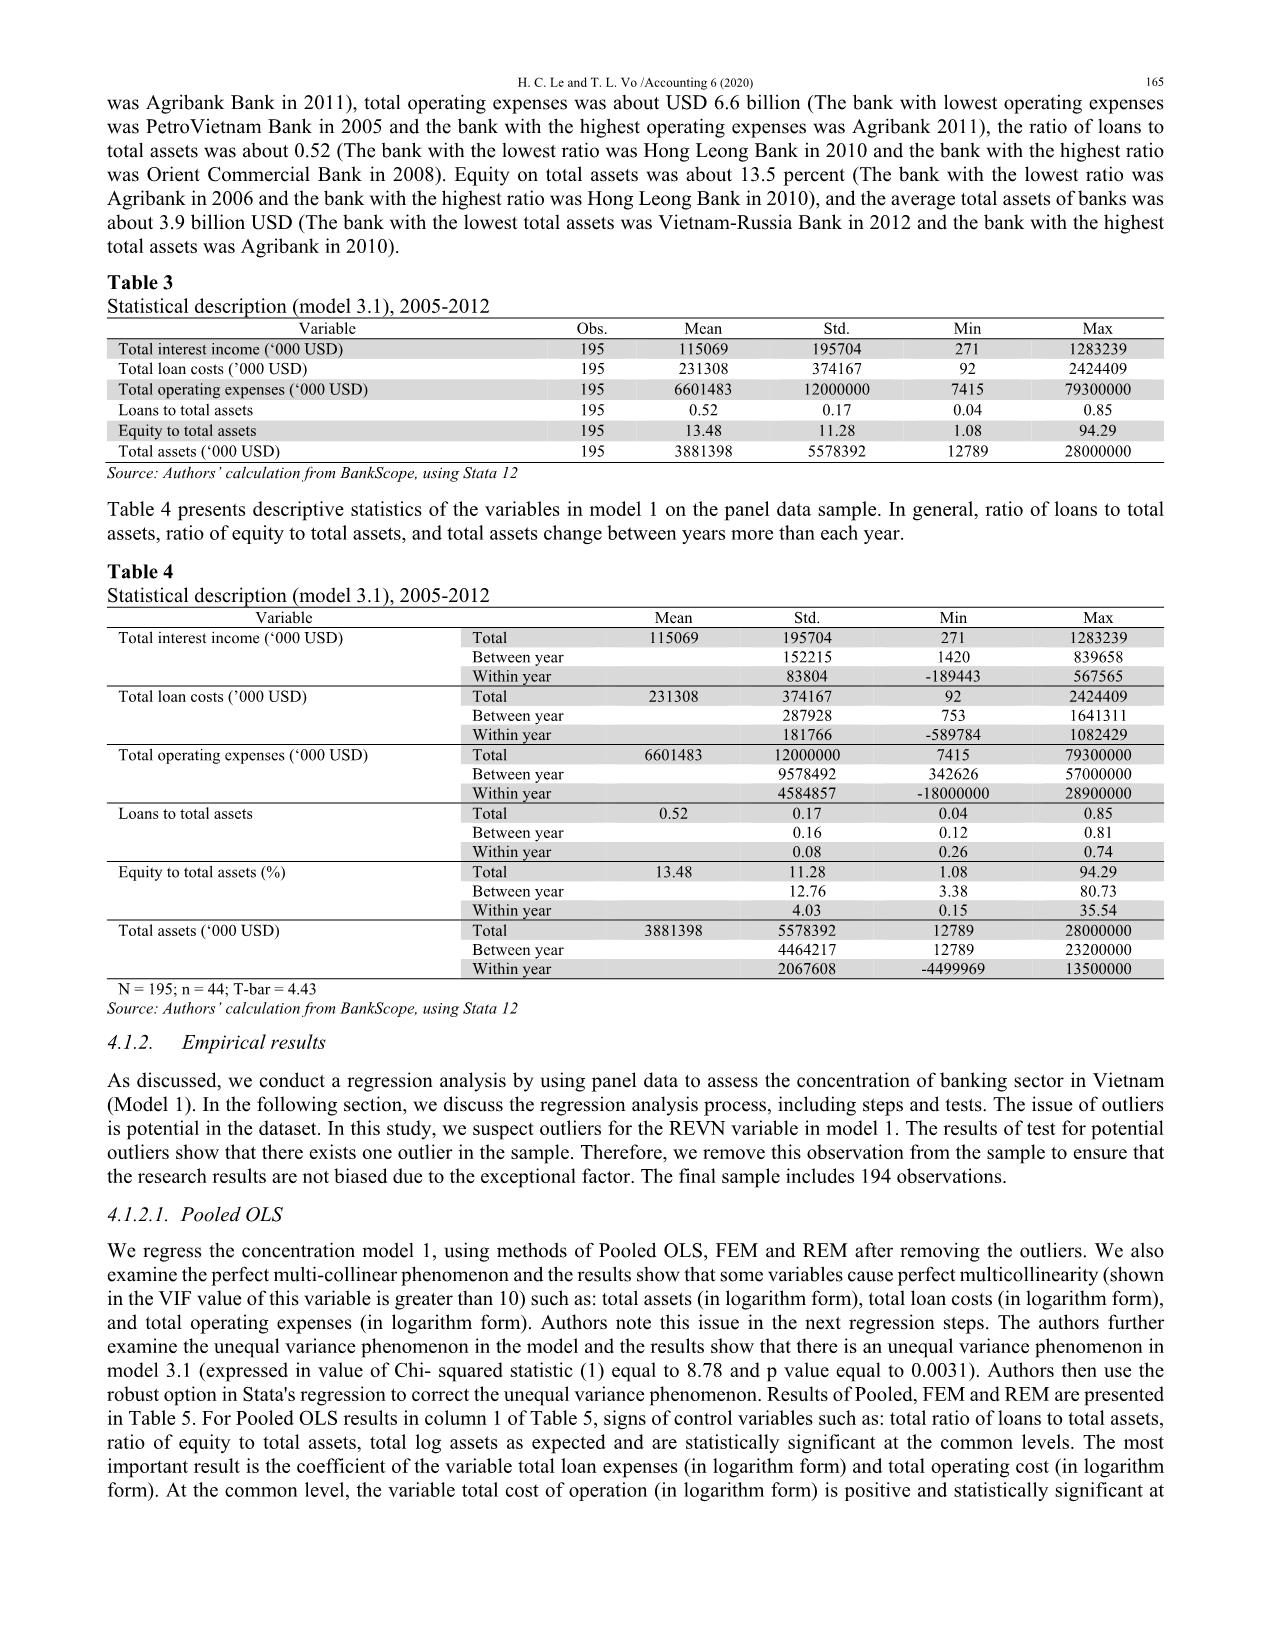
 and total operating cost (in logarithm
form). At the common level, the variable total cost of operation (in logarithm form) is positive and statistically significant at
 166
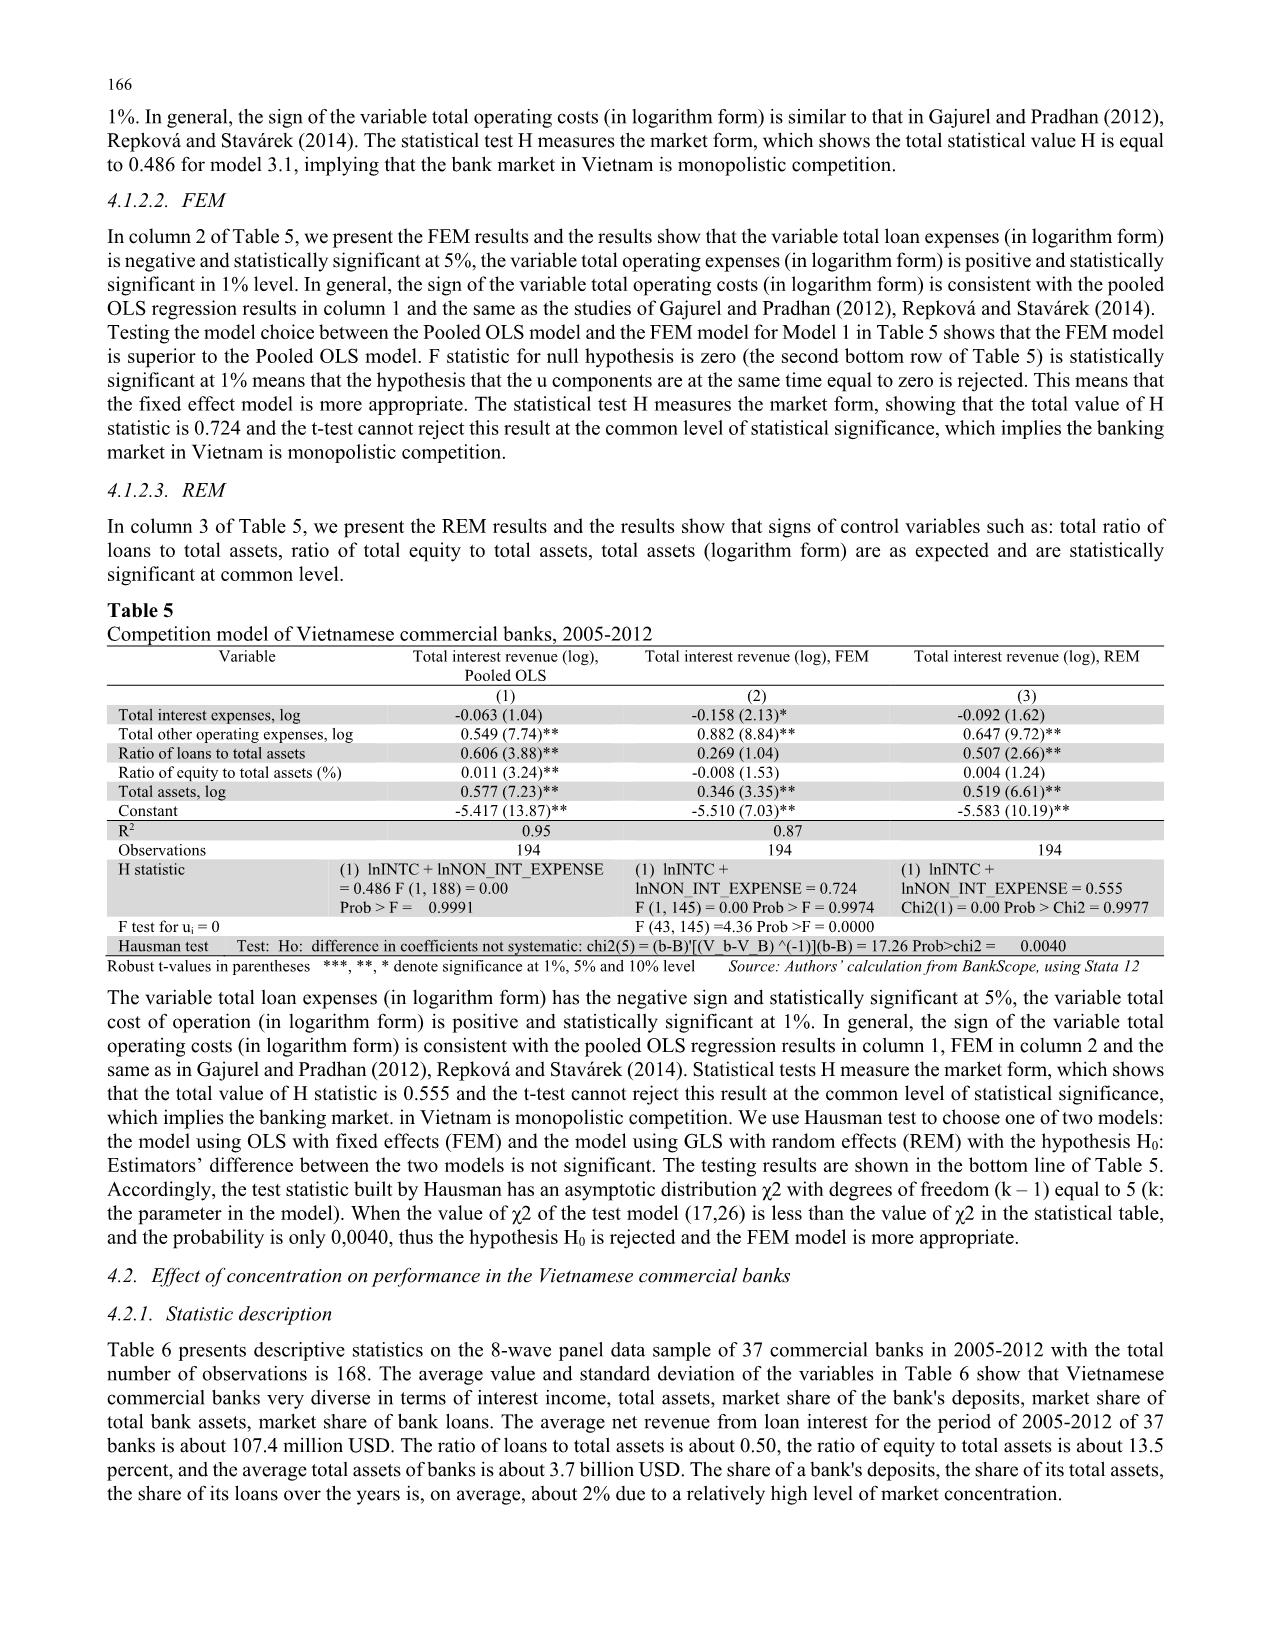
1%. In general, the sign of the variable total operating costs (in logarithm form) is similar to that in Gajurel and Pradhan (2012),
Repková and Stavárek (2014). The statistical test H measures the market form, which shows the total statistical value H is equal
to 0.486 for model 3.1, implying that the bank market in Vietnam is monopolistic competition.
4.1.2.2. FEM
In column 2 of Table 5, we present the FEM results and the results show that the variable total loan expenses (in logarithm form)
is negative and statistically significant at 5%, the variable total operating expenses (in logarithm form) is positive and statistically
significant in 1% level. In general, the sign of the variable total operating costs (in logarithm form) is consistent with the pooled
OLS regression results in column 1 and the same as the studies of Gajurel and Pradhan (2012), Repková and Stavárek (2014).
Testing the model choice between the Pooled OLS model and the FEM model for Model 1 in Table 5 shows that the FEM model
is superior to the Pooled OLS model. F statistic for null hypothesis is zero (the second bottom row of Table 5) is statistically
significant at 1% means that the hypothesis that the u components are at the same time equal to zero is rejected. This means that
the fixed effect model is more appropriate. The statistical test H measures the market form, showing that the total value of H
statistic is 0.724 and the t-test cannot reject this result at the common level of statistical significance, which implies the banking
market in Vietnam is monopolistic competition.
4.1.2.3. REM
In column 3 of Table 5, we present the REM results and the results show that signs of control variables such as: total ratio of
loans to total assets, ratio of total equity to total assets, total assets (logarithm form) are as expected and are statistically
significant at common level.
Table 5
Competition model of Vietnamese commercial banks, 2005-2012
Variable Total interest revenue (log),
Pooled OLS
Total interest revenue (log), FEM Total interest revenue (log), REM
 (1) (2) (3)
Total interest expenses, log -0.063 (1.04) -0.158 (2.13)* -0.092 (1.62)
Total other operating expenses, log 0.549 (7.74)** 0.882 (8.84)** 0.647 (9.72)**
Ratio of loans to total assets 0.606 (3.88)** 0.269 (1.04) 0.507 (2.66)**
Ratio of equity to total assets (%) 0.011 (3.24)** -0.008 (1.53) 0.004 (1.24)
Total assets, log 0.577 (7.23)** 0.346 (3.35)** 0.519 (6.61)**
Constant -5.417 (13.87)** -5.510 (7.03)** -5.583 (10.19)**
R2 0.95 0.87
Observations 194 194 194
H statistic (1) lnINTC + lnNON_INT_EXPENSE
= 0.486 F (1, 188) = 0.00
Prob > F = 0.9991
(1) lnINTC +
lnNON_INT_EXPENSE = 0.724
F (1, 145) = 0.00 Prob > F = 0.9974
(1) lnINTC +
lnNON_INT_EXPENSE = 0.555
Chi2(1) = 0.00 Prob > Chi2 = 0.9977
F test for ui = 0 F (43, 145) =4.36 Prob >F = 0.0000
Hausman test Test: Ho: difference in coefficients not systematic: chi2(5) = (b-B)'[(V_b-V_B) ^(-1)](b-B) = 17.26 Prob>chi2 = 0.0040
Robust t-values in parentheses ***, **, * denote significance at 1%, 5% and 10% level Source: Authors’ calculation from BankScope, using Stata 12
The variable total loan expenses (in logarithm form) has the negative sign and statistically significant at 5%, the variable total
cost of operation (in logarithm form) is positive and statistically significant at 1%. In general, the sign of the variable total
operating costs (in logarithm form) is consistent with the pooled OLS regression results in column 1, FEM in column 2 and the
same as in Gajurel and Pradhan (2012), Repková and Stavárek (2014). Statistical tests H measure the market form, which shows
that the total value of H statistic is 0.555 and the t-test cannot reject this result at the common level of statistical significance,
which implies the banking market. in Vietnam is monopolistic competition. We use Hausman test to choose one of two models:
the model using OLS with fixed effects (FEM) and the model using GLS with random effects (REM) with the hypothesis H0:
Estimators’ difference between the two models is not significant. The testing results are shown in the bottom line of Table 5.
Accordingly, the test statistic built by Hausman has an asymptotic distribution χ2 with degrees of freedom (k – 1) equal to 5 (k:
the parameter in the model). When the value of χ2 of the test model (17,26) is less than the value of χ2 in the statistical table,
and the probability is only 0,0040, thus the hypothesis H0 is rejected and the FEM model is more appropriate.
4.2. Effect of concentration on performance in the Vietnamese commercial banks
4.2.1. Statistic description
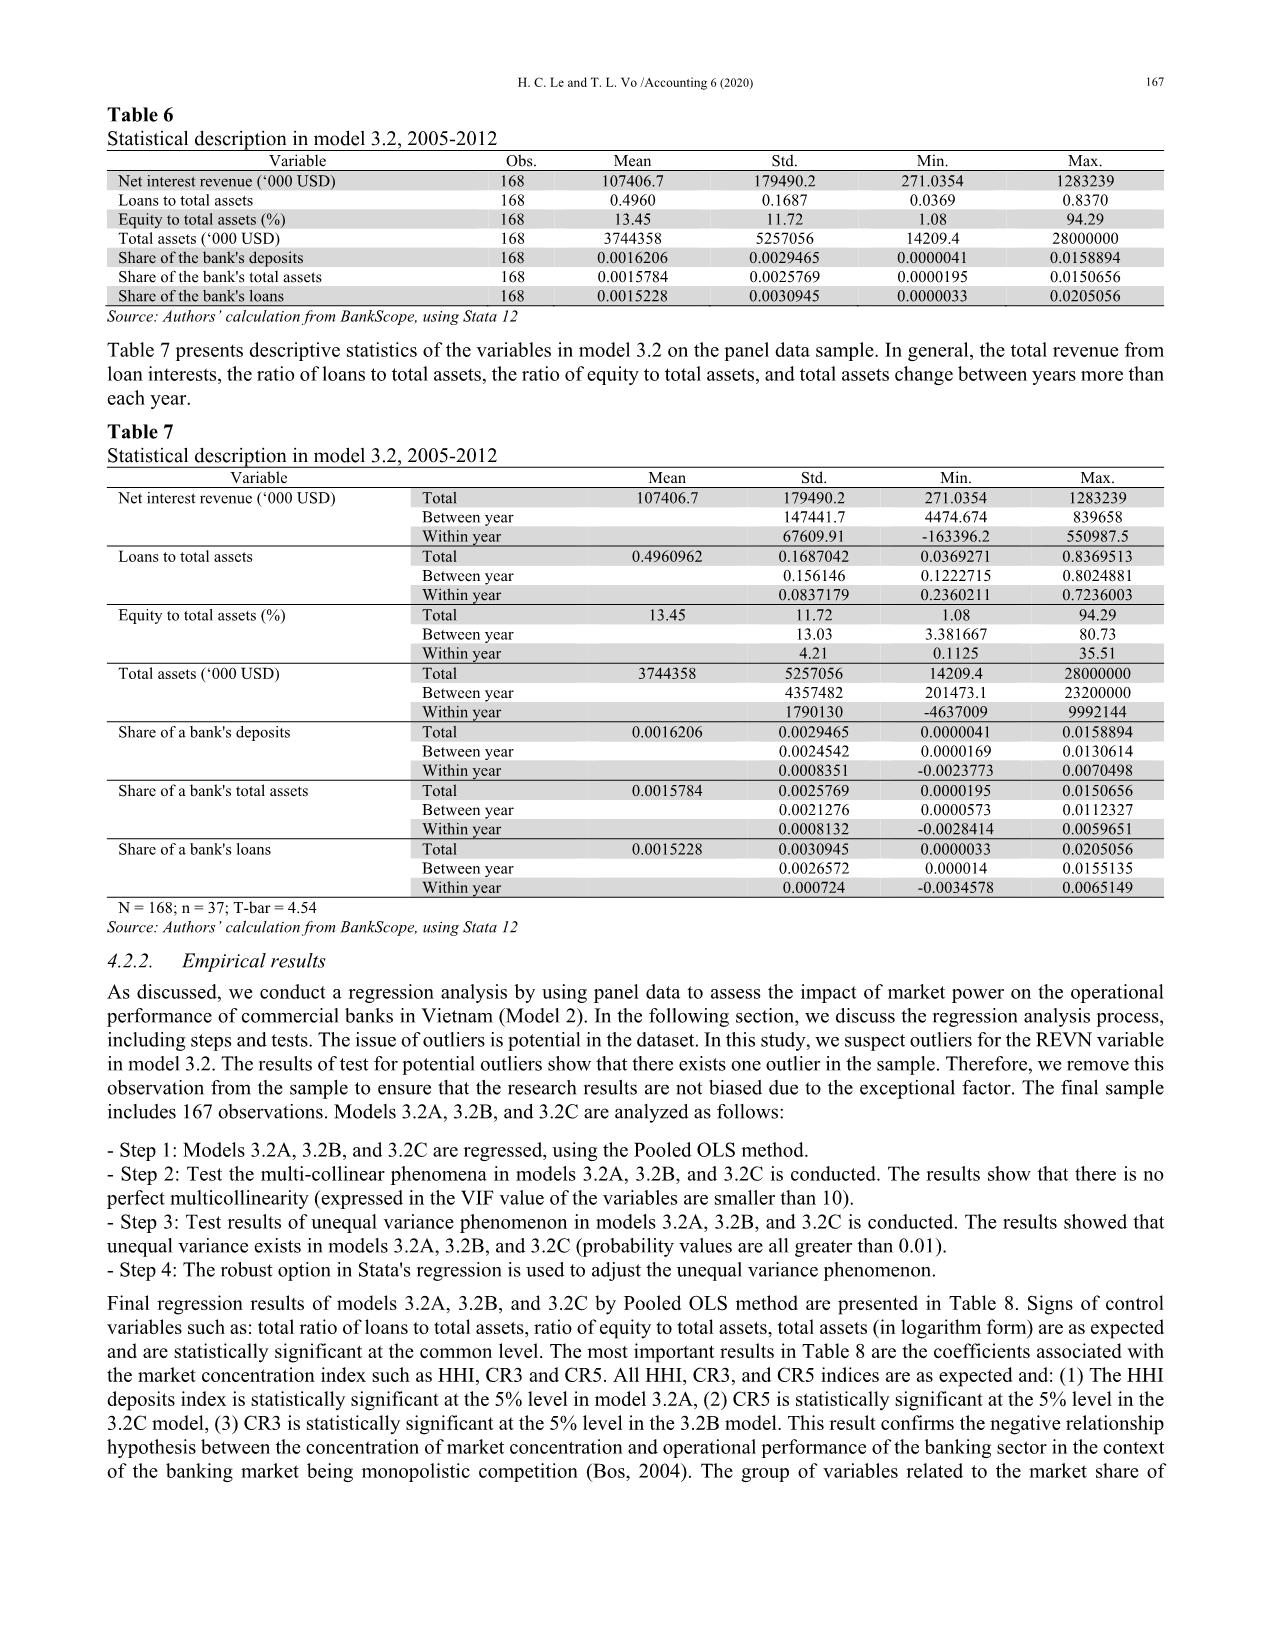
Table 6 presents descriptive statistics on the 8-wave panel data sample of 37 commercial banks in 2005-2012 with the total
number of observations is 168. The average value and standard deviation of the variables in Table 6 show that Vietnamese
commercial banks very diverse in terms of interest income, total assets, market share of the bank's deposits, market share of
total bank assets, market share of bank loans. The average net revenue from loan interest for the period of 2005-2012 of 37
banks is about 107.4 million USD. The ratio of loans to total assets is about 0.50, the ratio of equity to total assets is about 13.5
percent, and the average total assets of banks is about 3.7 billion USD. The share of a bank's deposits, the share of its total assets,
the share of its loans over the years is, on average, about 2% due to a relatively high level of market concentration.
H. C. Le and T. L. Vo /Accounting 6 (2020) 167
Table 6
Statistical description in model 3.2, 2005-2012
Variable Obs. Mean Std. Min. Max.
Net interest revenue (‘000 USD) 168 107406.7 179490.2 271.0354 1283239
Loans to total assets 168 0.4960 0.1687 0.0369 0.8370
Equity to total assets (%) 168 13.45 11.72 1.08 94.29
Total assets (‘000 USD) 168 3744358 5257056 14209.4 28000000
Share of the bank's deposits 168 0.0016206 0.0029465 0.0000041 0.0158894
Share of the bank's total assets 168 0.0015784 0.0025769 0.0000195 0.0150656
Share of the bank's loans 168 0.0015228 0.0030945 0.0000033 0.0205056
Source: Authors’ calculation from BankScope, using Stata 12
Table 7 presents descriptive statistics of the variables in model 3.2 on the panel data sample. In general, the total revenue from
loan interests, the ratio of loans to total assets, the ratio of equity to total assets, and total assets change between years more than
each year.
Table 7
Statistical description in model 3.2, 2005-2012
Variable Mean Std. Min. Max.
Net interest revenue (‘000 USD) Total 107406.7 179490.2 271.0354 1283239
Between year 147441.7 4474.674 839658
Within year 67609.91 -163396.2 550987.5
Loans to total assets Total 0.4960962 0.1687042 0.0369271 0.8369513
Between year 0.156146 0.1222715 0.8024881
Within year 0.0837179 0.2360211 0.7236003
Equity to total assets (%) Total 13.45 11.72 1.08 94.29
Between year 13.03 3.381667 80.73
Within year 4.21 0.1125 35.51
Total assets (‘000 USD) Total 3744358 5257056 14209.4 28000000
Between year 4357482 201473.1 23200000
Within year 1790130 -4637009 9992144
Share of a bank's deposits Total 0.0016206 0.0029465 0.0000041 0.0158894
Between year 0.0024542 0.0000169 0.0130614
Within year 0.0008351 -0.0023773 0.0070498
Share of a bank's total assets Total 0.0015784 0.0025769 0.0000195 0.0150656
Between year 0.0021276 0.0000573 0.0112327
Within year 0.0008132 -0.0028414 0.0059651
Share of a bank's loans Total 0.0015228 0.0030945 0.0000033 0.0205056
Between year 0.0026572 0.000014 0.0155135
Within year 0.000724 -0.0034578 0.0065149
N = 168; n = 37; T-bar = 4.54
Source: Authors’ calculation from BankScope, using Stata 12
4.2.2. Empirical results
As discussed, we conduct a regression analysis by using panel data to assess the impact of market power on the operational
performance of commercial banks in Vietnam (Model 2). In the following section, we discuss the regression analysis process,
including steps and tests. The issue of outliers is potential in the dataset. In this study, we suspect outliers for the REVN variable
in model 3.2. The results of test for potential outliers show that there exists one outlier in the sample. Therefore, we remove this
observation from the sample to ensure that the research results are not biased due to the exceptional factor. The final sample
includes 167 observations. Models 3.2A, 3.2B, and 3.2C are analyzed as follows:
- Step 1: Models 3.2A, 3.2B, and 3.2C are regressed, using the Pooled OLS method.
- Step 2: Test the multi-collinear phenomena in models 3.2A, 3.2B, and 3.2C is conducted. The results show that there is no
perfect multicollinearity (expressed in the VIF value of the variables are smaller than 10).
- Step 3: Test results of unequal variance phenomenon in models 3.2A, 3.2B, and 3.2C is conducted. The results showed that
unequal variance exists in models 3.2A, 3.2B, and 3.2C (probability values are all greater than 0.01).
- Step 4: The robust option in Stata's regression is used to adjust the unequal variance phenomenon.
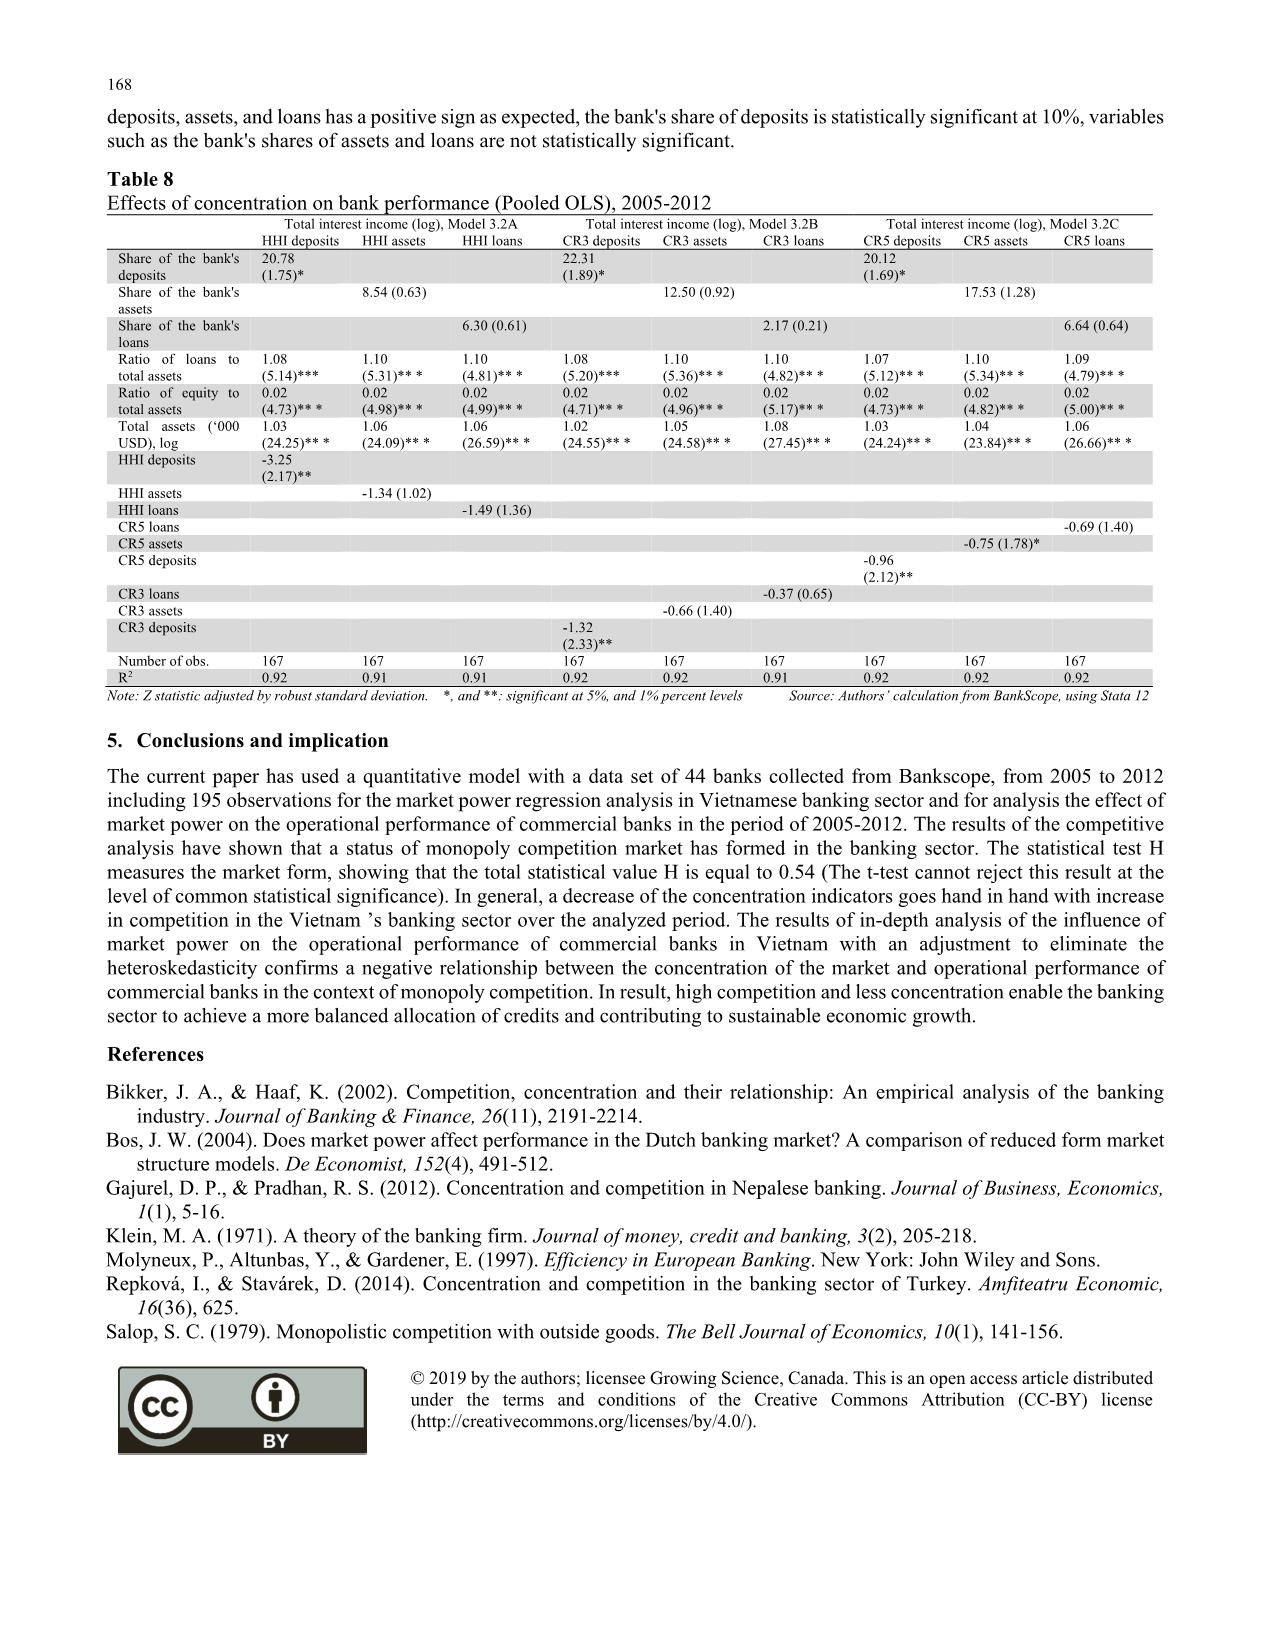
Final regression results of models 3.2A, 3.2B, and 3.2C by Pooled OLS method are presented in Table 8. Signs of control
variables such as: total ratio of loans to total assets, ratio of equity to total assets, total assets (in logarithm form) are as expected
and are statistically significant at the common level. The most important results in Table 8 are the coefficients associated with
the market concentration index such as HHI, CR3 and CR5. All HHI, CR3, and CR5 indices are as expected and: (1) The HHI
deposits index is statistically significant at the 5% level in model 3.2A, (2) CR5 is statistically significant at the 5% level in the
3.2C model, (3) CR3 is statistically significant at the 5% level in the 3.2B model. This result confirms the negative relationship
hypothesis between the concentration of market concentration and operational performance of the banking sector in the context
of the banking market being monopolistic competition (Bos, 2004). The group of variables related to the market share of
 168
deposits, assets, and loans has a positive sign as expected, the bank's share of deposits is statistically significant at 10%, variables
such as the bank's shares of assets and loans are not statistically significant.
Table 8
Effects of concentration on bank performance (Pooled OLS), 2005-2012
 Total interest income (log), Model 3.2A Total interest income (log), Model 3.2B Total interest income (log), Model 3.2C
HHI deposits HHI assets HHI loans CR3 deposits CR3 assets CR3 loans CR5 deposits CR5 assets CR5 loans
Share of the bank's
deposits
20.78
(1.75)*
 22.31
(1.89)*
 20.12
(1.69)*
Share of the bank's
assets
 8.54 (0.63) 12.50 (0.92) 17.53 (1.28)
Share of the bank's
loans
 6.30 (0.61) 2.17 (0.21) 6.64 (0.64)
Ratio of loans to
total assets
1.08
(5.14)***
1.10
(5.31)** *
1.10
(4.81)** *
1.08
(5.20)***
1.10
(5.36)** *
1.10
(4.82)** *
1.07
(5.12)** *
1.10
(5.34)** *
1.09
(4.79)** *
Ratio of equity to
total assets
0.02
(4.73)** *
0.02
(4.98)** *
0.02
(4.99)** *
0.02
(4.71)** *
0.02
(4.96)** *
0.02
(5.17)** *
0.02
(4.73)** *
0.02
(4.82)** *
0.02
(5.00)** *
Total assets (‘000
USD), log
1.03
(24.25)** *
1.06
(24.09)** *
1.06
(26.59)** *
1.02
(24.55)** *
1.05
(24.58)** *
1.08
(27.45)** *
1.03
(24.24)** *
1.04
(23.84)** *
1.06
(26.66)** *
HHI deposits -3.25
(2.17)**
HHI assets -1.34 (1.02)
HHI loans -1.49 (1.36)
CR5 loans -0.69 (1.40)
CR5 assets -0.75 (1.78)*
CR5 deposits -0.96
(2.12)**
CR3 loans -0.37 (0.65)
CR3 assets -0.66 (1.40)
CR3 deposits -1.32
(2.33)**
Number of obs. 167 167 167 167 167 167 167 167 167
R2 0.92 0.91 0.91 0.92 0.92 0.91 0.92 0.92 0.92
Note: Z statistic adjusted by robust standard deviation. *, and **: significant at 5%, and 1% percent levels Source: Authors’ calculation from BankScope, using Stata 12
5. Conclusions and implication
The current paper has used a quantitative model with a data set of 44 banks collected from Bankscope, from 2005 to 2012
including 195 observations for the market power regression analysis in Vietnamese banking sector and for analysis the effect of
market power on the operational performance of commercial banks in the period of 2005-2012. The results of the competitive
analysis have shown that a status of monopoly competition market has formed in the banking sector. The statistical test H
measures the market form, showing that the total statistical value H is equal to 0.54 (The t-test cannot reject this result at the
level of common statistical significance). In general, a decrease of the concentration indicators goes hand in hand with increase
in competition in the Vietnam ’s banking sector over the analyzed period. The results of in-depth analysis of the influence of
market power on the operational performance of commercial banks in Vietnam with an adjustment to eliminate the
heteroskedasticity confirms a negative relationship between the concentration of the market and operational performance of
commercial banks in the context of monopoly competition. In result, high competition and less concentration enable the banking
sector to achieve a more balanced allocation of credits and contributing to sustainable economic growth.
References
Bikker, J. A., & Haaf, K. (2002). Competition, concentration and their relationship: An empirical analysis of the banking
industry. Journal of Banking & Finance, 26(11), 2191-2214.
Bos, J. W. (2004). Does market power affect performance in the Dutch banking market? A comparison of reduced form market
structure models. De Economist, 152(4), 491-512.
Gajurel, D. P., & Pradhan, R. S. (2012). Concentration and competition in Nepalese banking. Journal of Business, Economics,
1(1), 5-16.
Klein, M. A. (1971). A theory of the banking firm. Journal of money, credit and banking, 3(2), 205-218.
Molyneux, P., Altunbas, Y., & Gardener, E. (1997). Efficiency in European Banking. New York: John Wiley and Sons.
Repková, I., & Stavárek, D. (2014). Concentration and competition in the banking sector of Turkey. Amfiteatru Economic,
16(36), 625.
Salop, S. C. (1979). Monopolistic competition with outside goods. The Bell Journal of Economics, 10(1), 141-156.
© 2019 by the authors; licensee Growing Science, Canada. This is an open access article distributed
under the terms and conditions of the Creative Commons Attribution (CC-BY) license
(
File đính kèm:
 concentration_and_performance_in_vietnamese_commercial_banks.pdf

