Capital structure and firm performance of non-financial listed companies: Cross-sector empirical evidences from Vietnam
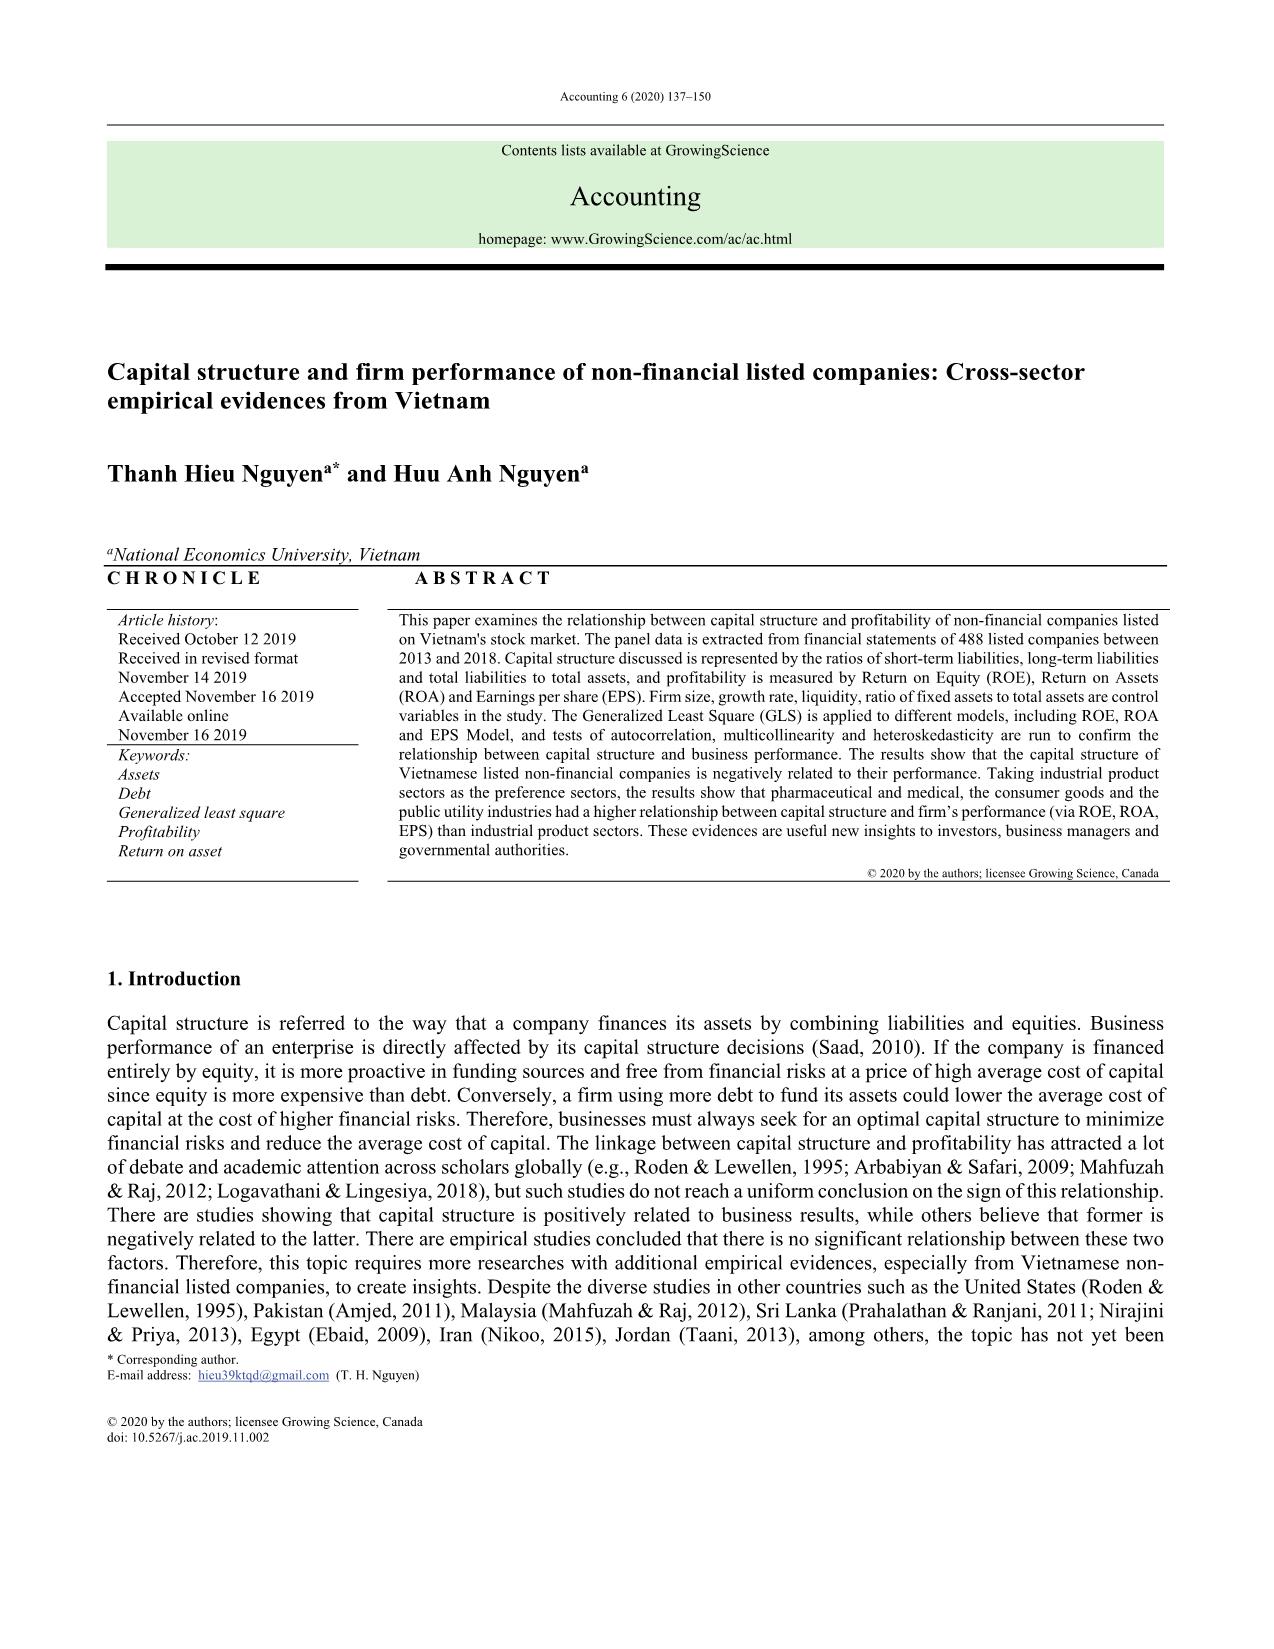
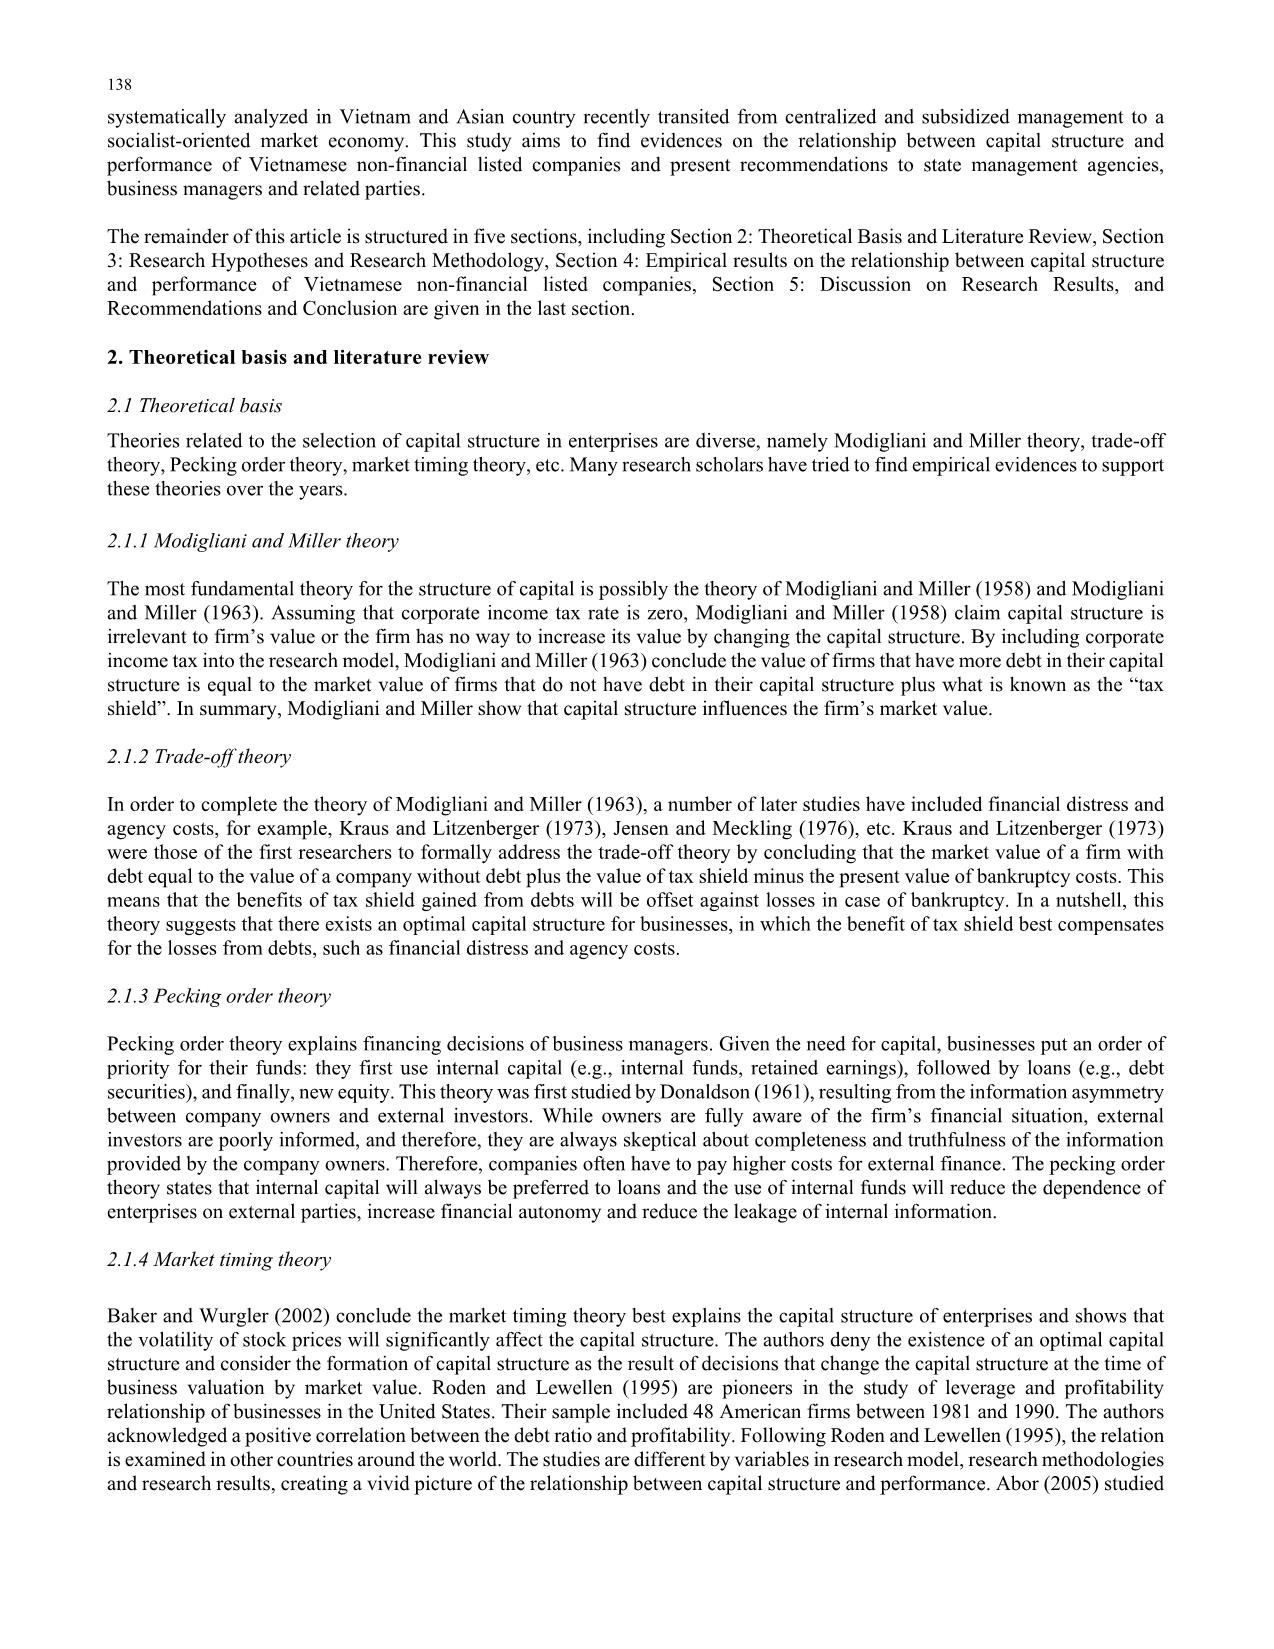
This paper examines the relationship between capital structure and profitability of non-Financial companies listed on Vietnam's stock market. The panel data is extracted from financial statements of 488 listed companies between 2013 and 2018. Capital structure discussed is represented by the ratios of short-term liabilities, long-term liabilities and total liabilities to total assets, and profitability is measured by Return on Equity (ROE), Return on Assets (ROA) and Earnings per share (EPS). Firm size, growth rate, liquidity, ratio of fixed assets to total assets are control variables in the study. The Generalized Least Square (GLS) is applied to different models, including ROE, ROA and EPS Model, and tests of autocorrelation, multicollinearity and heteroskedasticity are run to confirm the relationship between capital structure and business performance. The results show that the capital structure of Vietnamese listed non-financial companies is negatively related to their performance. Taking industrial product sectors as the preference sectors, the results show that pharmaceutical and medical, the consumer goods and the public utility industries had a higher relationship between capital structure and firm’s performance (via ROE, ROA, EPS) than industrial product sectors. These evidences are useful new insights to investors, business managers and governmental authorities
Trang 1
Trang 2
Trang 3
Trang 4
Trang 5
Trang 6
Trang 7
Trang 8
Trang 9
Trang 10
Tải về để xem bản đầy đủ
Tóm tắt nội dung tài liệu: Capital structure and firm performance of non-financial listed companies: Cross-sector empirical evidences from Vietnam
debt to total assets and profitability, which is
T. H. Nguyen and H.A. Nguyen /Accounting 6 (2020) 147
represented by ROE and ROA. Chang et al. (2014) having ROE as a measure of business results, the research reported that the
ratios of short-term debt and total debt to total assets were negatively related to ROE. This result is also partly shared with the
results of Rehman et al. (2012). The results of Rehman et al. (2012), indicated a significant positive correlation between the
ratio of short-term debt to total assets and ROE, but the ratio of long-term debt to total assets and ROE are not significant
correlated. Particularly, there are differences in the sectors about effects of capital structure to ROE as shown in Table 13.
Specifically: Information technology, oil and gas and materials industries have lower ROE than industrial products industry
(negative beta such as -0.0195, -0.0306 and -0.00839). In particular, oil and gas industry have lower ROE than information
technology and materials industry (beta value: -0.0306; -0.0214; -0.00839 equivalent); IT industry has a lower ROE than
materials. Utilities and consumer goods have a higher ROE than industrial products industry (beta value = 0.0163) ; public
utility sector has a higher ROE than consumer goods (beta value: 0.0163; 0.00906 equivalent).
Table 13
Comparison of correlation coefficient between capital structure and ROE (industrial products sectors as standard)
Industry STD LTD TD
Information technology industry -0.0195*** -0.0137* -0.0214***
Pharmaceutical and medical industry 0.0177*** 0.0229*** 0.00599*
Oil & gas industry -0.0182 -0.0142 -0.0306**
Consumer service industry 0.00419 0.0186*** -0.00109
Consumer goods industry 0.0214*** 0.0171*** 0.00906**
Materials industry -0.00413 -0.00140 -0.00839**
Public utility industry 0.0207*** 0.0360*** 0.0163***
Note: (*), (**), (***) represent for the significant level at 1%, 5% và 10%, respectively
5.2 Discussion of the research results of ROA models
The research results show that the relationship between capital structure and ROA for all non-financial enterprises listed on
Vietnam's stock market is opposite. The regression coefficient obtained from the GLS regression is negative, statistically
significant (p-value = 1%). This result supports the results of Ebaid (2009), Doan and Dinh (2014), Chang et al. (2014),
Logavathani and Lingesiya (2018). Chang et al. (2014) indicated a negative correlation between debt (including short-term debt,
long-term debt and total debt) and ROA. According to Logavathani and Lingesiya (2018), the results of FEM regression from
ROA model and REM regression from ROE model highlighted that the ratio of total debt to total assets is closely and negatively
related to ROA and ROE of commercial banks in Sri Lanka. In particular, the industry comparison of effects of capital structure
to ROA among sectors in Table 14 shows that information technology has a lower ROA than industrial products industry
(negative beta = -0.0300, industrial products sector is referenced with the rest of industries). Consumer goods, medical
pharmaceuticals and public utilities have a higher ROA than industrial products industry (beta value = 0.0234, 0.0234 and
0.0351 equivalent). In particular, because the public utility beta is larger than the consumer goods beta, the public utility ROA
tends to be higher than the consumer goods industry. The pharmaceutical industry has a lower ROA than consumer goods.
Table 14
Comparison of correlation coefficient between capital structure and ROA (industrial products sectors as standard)
Industry STD LTD TD
Information technology industry -0.0282* -0.0231 -0.0300**
Pharmaceutical and medical industry 0.0242* 0.0278* 0.0132*
Oil & gas industry -0.0147 -0.0121 -0.0263
Consumer service industry 0.00296 0.0154 -0.00231
Consumer goods industry 0.0348*** 0.0299*** 0.0234***
Materials industry -0.00325 -0.00116 -0.00727
Public utility industry 0.0396*** 0.0530*** 0.0351***
Note: (*), (**), (***) represent for the significant level at 1%, 5% và 10%, respectively
 (Source: Data processing results of authors)
5.3 Discussion of the research results of EPS models
The research results show that the relationship between capital structure and EPS for all non-financial enterprises listed on
Vietnam's stock market is the opposite. The regression coefficient obtained from the GLS regression is negative, statistically
significant (p-value = 1%). This research is in agreement with the results of Mahfuzah and Raj (2012), Doan and Dinh (2014).
EPS (earnings per share) are indicators of profitability in study of Doan and Dinh (2014). The study pointed out a negative
 148
relationship between the selected leverage ratios and business performance. The study of Mahfuzah and Raj (2012) indicated
that firm performance, which is measured by return on asset (ROA), return on Equity (ROE) and earning per share (EPS) have
negative relationship with short term debt (STD), long term debt (LTD), total debt (TD) as independent variable. In particular,
about effects of capital structure to EPS among sectors as illustrated in Table 15, the information technology industry has lower
EPS than the material industry and these two industries have lower EPS than the industrial products industry (beta value = -
717.8 and -536.6 equivalent). The medical pharmaceutical industry has higher EPS than consumer goods industry and industrial
products industry (beta value = 608.8 and 442.1 equivalent for pharmaceutical and medical industry and consumer goods
industry).
Table 15
Comparison of correlation coefficient between capital structure and EPS (industrial products sectors as standard)
Industry STD LTD TD
Information technology industry -667.0** -558.9** -717.8***
Pharmaceutical and medical industry 873.5*** 915.8*** 608.8**
Oil & gas industry -705.9 -691.3 -982.4
Consumer service industry -182.2 65.47 -317.7
Consumer goods industry 713.9*** 561.6*** 442.1***
Materials industry -441.8*** -410.5** -536.6***
Public utility industry -178.4 98.39 -297.9
Note: (*), (**), (***) represent for the significant level at 1%, 5% và 10%, respectively
 Source: Data processing results of authors
6. Conclusion and recommendations
6.1 Conclusion
This article has provided evidence that the capital structure of an enterprise has an impact on the business performance of non-
financial enterprises listed on Vietnam's stock market. The research results complement previous studies with detailed
information for each economic sector. Based on the results of this research, the author has proposed some recommendations to
business managers, investors and state management agencies in making decisions.
6.2 Recommendations
Firstly, for investors
The research results show that the capital structure, in particular, the ratio of debt to total assets is closely related and statistically
significant with the profitability of the companies (via ROA, ROE, EPS rates). In general, businesses with high debt-to-assets
ratio will have an opposite effect on their profitability. Considering each economic sector, the effect of capital structure on ROE,
ROA and EPS is different. Consumer goods, health care, and utilities have a higher relationship between capital structure and
ROE than industrial product sectors; The information technology industry has a lower relation between capital structure and
ROE than industrial product sectors. Moreover, the Pharmaceutical and medical industry, the consumer goods industry, and the
public utility industry have a higher relationship between capital structure and ROE than industrial product sectors; The
Information Technology industry has a lower relationship between capital structure and ROE than industrial product sectors. In
addition, Pharmaceutical and medical industry, Consumer goods industry have a higher relationship between capital structure
and EPS than industrial product sectors; Information technology industry has lower relationship between capital structure and
EPS than industrial product sectors and raw material industry has lower capital structure and EPS than industrial product sectors.
Therefore, this is useful information to help investors make appropriate investment decisions.
Secondly, for business managers
The experimental results of this article show that increasing the ratio of liabilities to total assets will make the business
performance of the company (via ROE, ROA, EPS) decrease. At the same time, the revenue growth rate (SG) has a good effect
on business performance. Therefore, business managers need to take appropriate measures to use debt, help increase sales but
still ensure increased business performance.
Thirdly, for the state management agencies
The empirical results of this article show that company size (SIZE) is positively related to the company's business performance.
The more companies scale up, the higher their performance (via ROE, ROA, EPS) will be. When companies need to borrow
T. H. Nguyen and H.A. Nguyen /Accounting 6 (2020) 149
capital to expand the size of the company, the state management agencies need to create favorable conditions for businesses to
access capital. The State should consider policies on interest rates at a reasonable level so that businesses can both receive capital
and bring business efficiency.
References
Abor, J. (2005). The effect of capital structure on profitability: an empirical ananlysis of listed firms in Ghana. Journal of Rick
Finance, 6(5), 438-447.
Amjed, S. (2011, June). Impact of financial structure on firm’s Performance: A study of Pakistan’s Chemical Sector. In Society
of Interdisciplinary Business Research (SIBR) 2011 Conference on Interdisciplinary Business Research. 454-476.
Arbabiyan, A. A., & Safari, M. (2009). The effects of capital structure and profitability in the listed firms in Tehran Stock
Exchange. Journal of Management Perspective, 33(12), 159-175.
Baker, M., & Wurgler, J. (2002). Market timing and capital structure. The Journal of Finance, 57(1), 1-32.
Chang, F. M., Wang, Y., Lee, N. R., & La, D. T. (2014). Capital structure decisions and firm performance of Vietnamese
soes. Asian Economic and Financial Review, 4(11), 1545-1563.
Doan, T.D., & Dinh, T.H. (2014). Capital Structure and profitability of list companies in HoChiMinh City. Economics &
Development Journal. 2014 (Special issue in December), 30 – 37.
Donaldson. G. (1961). Corporate debt capacity: a study of corporate debt policy and the determination of corporate debt
capacity. Boston, Division of Research, Graduate School of Business Administration, Harvard University.
Ebaid, I.E. (2009). The impact of capital - structure choice on firm performance empirical evidence from Egypt. The Journal of
Rick Finance, 10(50), 477-487.
ElKelish, W.W. (2007). Financial structure and firm value: empirical evidence from the United Arab Emirates. International
Journal of Business Research, 7, 69-76.
Hoang, T., & Chu, N.M.N. (2013). Statistics applied in socio-economic research. Statistical Publishing House, Hanoi
Jensen, M.C., & Meckling, W.H. (1976). Theory of the firm: Managerial behavior, agency costs and ownership structure.
Journal of Financial Economics, 3(4), 305-360
Khan, A.G. (2012). The relationship of capital structure decisions with firm performance: A study of the engineering sector of
Pakistan. International Journal of Accounting and Financial Reporting, 2(1), 245-262.
Kraus, A., & Litzenberger, R. (1973). A state-preference model of optimal financial leverage. The Journal of Finance, 28(4),
911-922.
Logavathani, S., & Lingesiya, K. (2018). Capital structure and financial performance: A study on commercial banks in Sri
Lanka. Asian Economic and Financial Review, Asian Economic and Social Society, 8(5), 586-598
Mahfuzah, S., & Raj, Y. (2012). Capital structure and firm performance: evidence from Malaysian listed companies. Procedia-
Social and Behavioral Sciences, 65, 156-166.
Modigliani, F., & Miller, M.H. (1958). The cost of capital, corporation finance and the theory of investment. American Economic
Review, 4(3), 261–297.
Modigliani, F., & Miller, M.H. (1963). Corporate income taxes and the cost of capital: A correction. American Economic
Review, 53, 433-443.
Nikoo, S.F. (2015). Impact of capital structure on banking performance: Evidence from Tehran stock exchange. International
Research Journal of Applied and Basic Sciences, 9(6), 923–927.
Nirajini, A., & Priya, K.B. (2013). Impact of capital structure on financial performance of the listed trading companies in Sri
Lanka. International Journal of Scientific and Research publications, 3(5), 35-43.
Prahalathan, B., & Ranjani, R.P.C. (2011). The impact of capital structure-choice on firm performance: Empirical investigation
of listed companies in Colombo stock exchange, Sri Lanka. Int. J. Res. Commerce Manage. 2: 12-16. Available at:
Ramadan, Z.S., & Ramadan, I.Z. (2015). Capital structure and firm's performance of Jordanian manufacturing sector.
International Journal of Economics and Finance, 7(6), 279-284.
Rehman, W., Fatima, G., & Ahmad, M. (2012). Impact of debt structure on profitability in textile industry of Pakistan. Wali ur
Rehman, Goher Fatima, Dr. Mehboob Ahmad, Impact Of Debt Structure On Profitability In Textile Industry Of Pakistan.
International Journal of Economic Research, 3(2). 61-70.
Renoh, C., & Ntoiti, J. (2015). Effect of capital structure on financial performance of listed commercial banks in Kenya: A case
study of Kenya commercial banks limited. Strategic, Business & Change Journal of Management, 2(72), 750-781.
Roden, D., & Lewellen, W. (1995). Corporate capital structure decisions: Evidence from leveraged buyouts. Financial
Management, 24(2), 76-87.
Saad, N. M. (2010). Corporate Governance Compliance and the Effects to Capital Structure. International Journal of Economics
and Financial, 2(1), 105-114
Siddik, N.A., Kabiraj, S. & Joghee, S. (2017). Impact of capital structure on performance of banks in a developing economy:
Evidence from Bangladesh. International Journal of Financial Studies, 5(2), 13.
 150
Taani, K. (2013). The relationship between capital structure and firm performance: Evidence from Jordan. Global Advanced
Research Journal of Management and Business Studies, 2(11), 542-546.
Yogen, C., Cheruiyot, J., Sang, J., & Cheruiyot, P.K. (2014). The effect of capital structure on firm's profitability: Evidence
from Kenya's banking sector. Research Journal of Finance & Accounting, 5(9), 152-159.
© 2019 by the authors; licensee Growing Science, Canada. This is an open access article distributed
under the terms and conditions of the Creative Commons Attribution (CC-BY) license
(
File đính kèm:
 capital_structure_and_firm_performance_of_non_financial_list.pdf

