Bài giảng Toán rời rạc - Chương: Đồ thị phẳng - Trần Vĩnh Đức
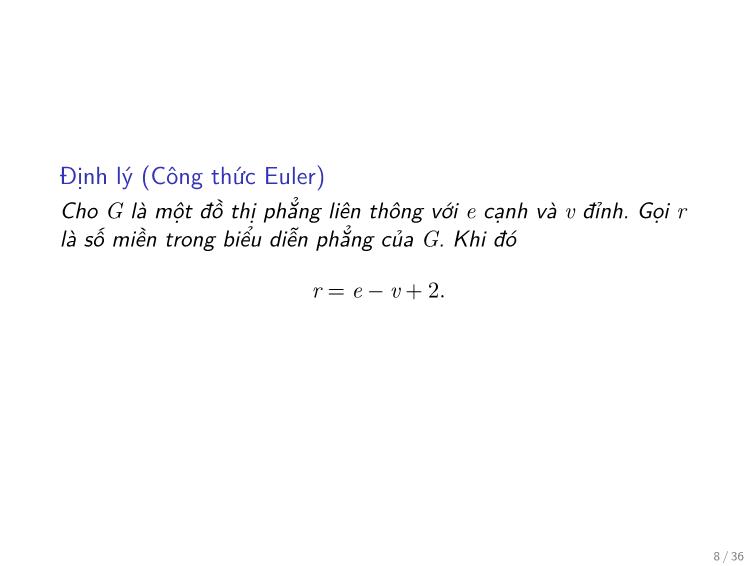
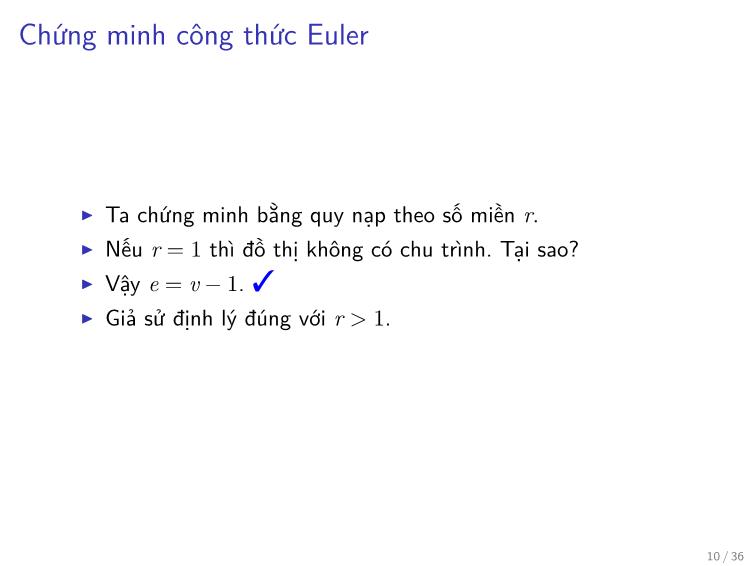
Định lý (Công thức Euler)
Cho G là một đồ thị phẳng liên thông với e cạnh và v đỉnh. Gọi r
là số miền trong biểu diễn phẳng của G. Khi đó
r = e − v + 2:
8 / 36Ví dụ
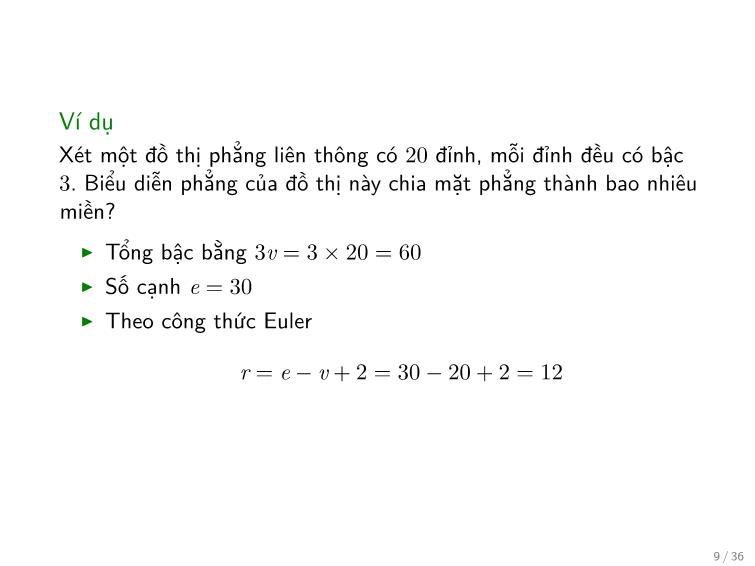
Xét một đồ thị phẳng liên thông có 20 đỉnh, mỗi đỉnh đều có bậc
3. Biểu diễn phẳng của đồ thị này chia mặt phẳng thành bao nhiêu
miền?
▶ Tổng bậc bằng 3v = 3 × 20 = 60
▶ Số cạnh e = 30
▶ Theo công thức Euler
r = e − v + 2 = 30 − 20 + 2 = 12

Trang 1
Trang 2
Trang 3
Trang 4
Trang 5
Trang 6
Trang 7
Trang 8
Trang 9
Trang 10
Tải về để xem bản đầy đủ
Bạn đang xem 10 trang mẫu của tài liệu "Bài giảng Toán rời rạc - Chương: Đồ thị phẳng - Trần Vĩnh Đức", để tải tài liệu gốc về máy hãy click vào nút Download ở trên
Tóm tắt nội dung tài liệu: Bài giảng Toán rời rạc - Chương: Đồ thị phẳng - Trần Vĩnh Đức

).
 ▶
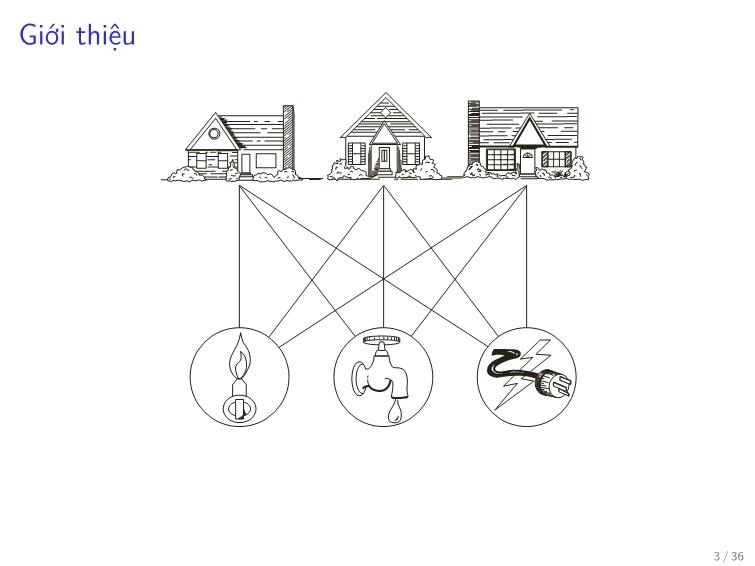
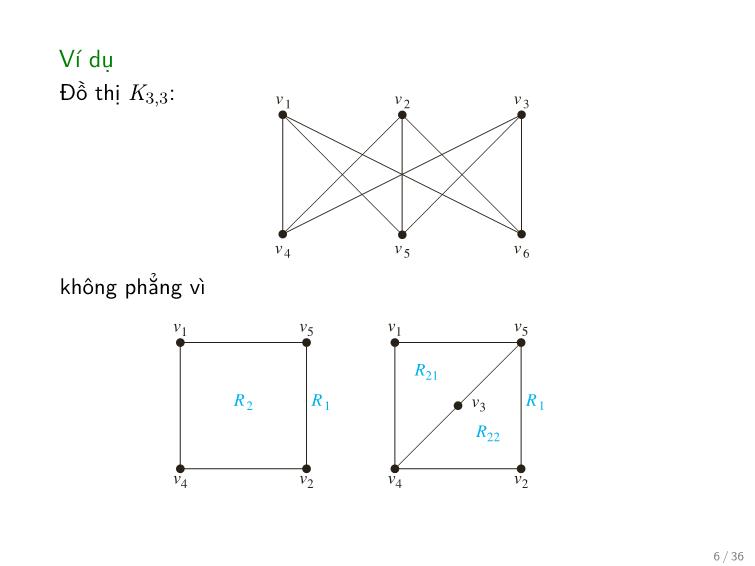
 Dùng hệ quả trước, hãy chứng minh rằng đồ thị K3,3 không
 phẳng?
 v1 v5 v1 v5
 v 1 v 2 v 3
 R21
 R 2 R 1 v3 R 1
 R22
 v4 v2 v4 v2
 v 4 v 5 v 6 (a) (b)
 FIGURE 6 The Graph K3,3. FIGURE 7 Showing that K3,3 Is Nonplanar.
 17 / 36
Định nghĩa
Độ dài của chu trình ngắn nhất trong đồ thị được gọi là chu vi
nhỏ nhất của đồ thị đó.
Nếu như đồ thị không tồn tại chu trình, thì chu vi nhỏ nhất của G
được định nghĩa bằng ∞.
 18 / 36
Định lý (Bất đẳng thức cạnh đỉnh)
Trong đồ thị phẳng liên thông G = (V, E) bất kỳ với chu vi nhỏ
nhất g thỏa mãn 3 ≤ g < ∞ ta luôn có
 g
 |E| ≤ (|V| − 2).
 g − 2
 19 / 36
Bài tập
 Dùng bất đẳng thức cạnh đỉnh để chứng minh rằng K3,3 và K5
 không phải đồ thị phẳng.
 20 / 36
Chứng minh bất đẳng thức cạnh đỉnh
 ▶ Xét G = (V, E) là đồ thị phẳng liên thông với chu vi nhỏ
 nhất 3 ≤ g ≤ ∞.
 ▶
 Đặt tập cạnh E = {e1, e2,..., et}.
 ▶ Xét một biểu diễn phẳng bất kỳ của G với ℓ miền là
 {R1, R2,..., Rℓ}.
 ▶
 Xây dựng bảng X = (xij) gồm t hàng và ℓ cột như sau
 {
 1 nếu ei là một cạnh trên biên của của miền Rj
 xij =
 0 trong trường hợp ngược lại
 21 / 36
Ví dụ
 R3
 e1 e2 R1 R2 R3
 e1 1 0 1
 R1
 e2 1 0 1
 e4 e3 0 1 1
 e3
 e5 e4 1 1 0
 R2
 e5 1 0 1
 e6 0 1 1
 e 0 1 1
 e6 e7 7
 ▶ Mỗi hàng có nhiều nhất 2 số 1. Tại sao?
 ▶ Mỗi cột có ít nhất g số 1. Tại sao?
 22 / 36
Chứng minh (tiếp)
 ▶ Mỗi cạnh chỉ nằm trên biên của nhiều nhất hai miền, nên mỗi
 hàng của X có nhiều nhất hai số 1.
 ▶ Các cạnh trên biên của mỗi miền tạo ra một chu trình trong
 G, nên mỗi cột có ít nhất g số một.
 ▶ Đặt
 s := số lượng số 1 trong X
 ta được
 gℓ ≤ s ≤ 2t.
 với ℓ là số miền và t là số cạnh.
 23 / 36
Chứng minh (tiếp)
 Kết hợp với công thức Euler
 ℓ = t − |V| + 2
 ta được
 gℓ = gℓ − g|V| + 2g ≤ 2t
 Vậy thì
 g
 t(g − 2) ≤ g(|V| − 2) ⇐⇒ |E| ≤ (|V| − 2)
 g − 2
 Ta hoàn thành chứng minh của bất đẳng thức cạnh đỉnh.
 24 / 36
 Hai đồ thị đồng phôi
 Định nghĩa
 ▶ Phép toán loại bỏ cạnh {u, v} và thêm một đỉnh mới w cùng
 hai cạnh {u, w}, {w, v} gọi là phép phân chia sơ cấp.
 ▶ Hai đồ thị gọi là đồng phôi nếu chúng có thể nhận được từ
 cùng một đồ thị bằng một dãy phép phân chia sơ cấp.
 10.7 Planar Graphs 723
 a b a b a b
 G1 G2 G3
 h
 k
 f i
 j
 g g
 ced ced ced
 FIGURE 12 Homeomorphic Graphs.
 Using r e v 2 (Euler’s formula), we obtain
 = − +
e v 2 (2/3)e.
− + ≤ 25 / 36
 It follows that e/3 v 2. This shows that e 3v 6.
 ≤ − ≤ −
 This corollary can be used to demonstrate that K5 is nonplanar.
EXAMPLE 5 Show that K5 is nonplanar using Corollary 1.
 Solution: The graph K has five vertices and 10 edges. However, the inequality e 3v 6is
 5 ≤ −
 not satisfied for this graph because e 10 and 3v 6 9. Therefore, K is not planar. L
 = − = 5
 It was previously shown that K3,3 is not planar. Note, however, that this graph has six vertices
 and nine edges. This means that the inequality e 9 12 3 6 6 is satisfied. Consequently,
 the fact that the inequality e 3v 6 is satisfied= does≤not imply= · that− a graph is planar. However,
 ≤ −
 the following corollary of Theorem 1 can be used to show that K3,3 is nonplanar.
COROLLARY 3 If a connected planar simple graph has e edges and v vertices with v 3 and no circuits of
 length three, then e 2v 4. ≥
 ≤ −
 The proof of Corollary 3 is similar to that of Corollary 1, except that in this case the fact that
 there are no circuits of length three implies that the degree of a region must be at least four. The
 details of this proof are left for the reader (see Exercise 15).
EXAMPLE 6 Use Corollary 3 to show that K3,3 is nonplanar.
 Solution: Because K3,3 has no circuits of length three (this is easy to see because it is bipartite),
 Corollary 3 can be used. K , has six vertices and nine edges. Because e 9 and 2v 4 8,
 3 3 = − =
 Corollary 3 shows that K3,3 is nonplanar. L
 KAZIMIERZ KURATOWSKI (1896–1980) Kazimierz Kuratowski, the son of a famous Warsaw lawyer,
 attended secondary school in Warsaw. He studied in Glasgow, Scotland, from 1913 to 1914 but could not return
 there after the outbreak of World War I. In 1915 he entered Warsaw University, where he was active in the Polish
 patriotic student movement. He published his first paper in 1919 and received his Ph.D. in 1921. He was an active
 member of the group known as the Warsaw School of Mathematics, working in the areas of the foundations
 of set theory and topology. He was appointed associate professor at the Lwów Polytechnical University, where
 he stayed for seven years, collaborating with the important Polish mathematicians Banach and Ulam. In 1930,
 while at Lwów, Kuratowski completed his work characterizing planar graphs.
 In 1934 he returned to Warsaw University as a full professor. Until the start of World War II, he was active
in research and teaching. During the war, because of the persecution of educated Poles, Kuratowski went into hiding under an
assumed name and taught at the clandestine Warsaw University. After the war he helped revive Polish mathematics, serving as
director of the Polish National Mathematics Institute. He wrote over 180 papers and three widely used textbooks.
 Định lý (Kuratowski)
 Đồ thị là không phẳng nếu và chỉ nếu nó chứa một đồ thị con
 đồng phôi với K3,3 hoặc K5.
724 10 / Graphs Ví dụ
 a b a b a b
 j
 icicic
 k h d d
 e e
 f f
 g g g
 G H K5
 FIGURE 13 The Undirected Graph G, a Subgraph H Homeomorphic to K5, and K5.
 Kuratowski’s Theorem
 26 / 36
 We have seen that K3,3 and K5 are not planar. Clearly, a graph is not planar if it contains either
 of these two graphs as a subgraph. Surprisingly, all nonplanar graphs must contain a subgraph
 that can be obtained from K3,3 or K5 using certain permitted operations.
 If a graph is planar, so will be any graph obtained by removing an edge u, v and adding a
 new vertex w together with edges u, w and w, v . Such an operation is called{ an} elementary
 { } { }
 subdivision. The graphs G1 (V1,E1) and G2 (V2,E2) are called homeomorphic if they
 can be obtained from the same= graph by a sequence= of elementary subdivisions.
EXAMPLE 7 Show that the graphs G1, G2, and G3 displayed in Figure 12 are all homeomorphic.
 Solution: These three graphs are homeomorphic because all three can be obtained from G1 by
 elementary subdivisions. G1 can be obtained from itself by an empty sequence of elementary
 subdivisions. To obtain G2 from G1 we can use this sequence of elementary subdivisions:
 (i ) remove the edge a,c , add the vertex f , and add the edges a,f and f, c ;(ii ) remove
 the edge b, c , add the{ vertex} g, and add the edges b, g and g,c{ ; and} (iii{) remove} the edge
 b, g , add{ the} vertex h, and add the edges g,h and {b, h}. We leave{ } it to the reader to determine
 { } { } { }
 the sequence of elementary subdivisions needed to obtain G3 from G1. L
 The Polish mathematician Kazimierz Kuratowski established Theorem 2 in 1930, which
 characterizes planar graphs using the concept of graph homeomorphism.
THEOREM 2 A graph is nonplanar if and only if it contains a subgraph homeomorphic to K3,3 or K5.
 It is clear that a graph containing a subgraph homeomorphic to K3,3 or K5 is nonplanar. However,
 the proof of the converse, namely that every nonplanar graph contains a subgraph homeomorphic
 to K3,3 or K5, is complicated and will not be given here. Examples 8 and 9 illustrate how
 Kuratowski’s theorem is used.
EXAMPLE 8 Determine whether the graph G shown in Figure 13 is planar.
 Solution: G has a subgraph H homeomorphic to K5. H is obtained by deleting h, j, and k and
 all edges incident with these vertices. H is homeomorphic to K5 because it can be obtained
 from K5 (with vertices a, b, c, g, and i) by a sequence of elementary subdivisions, adding the
 vertices d, e, and f . (The reader should construct such a sequence of elementary subdivisions.)
 Hence, G is nonplanar. L
 Đồ thị Petersen
 Ví dụ 10.7 Planar Graphs 725
 a
 f c
 f d f d j
 j
 e b
 j g
 ag
 i h
 e
 i h e i h
 d c
 (a) (b) H (c) K3,3
 FIGURE 14 (a) The Petersen Graph, (b) a Subgraph H Homeomorphic to K3,3, and (c) K3,3.
 EXAMPLE 9 Is the Petersen graph, shown in Figure 14(a), planar? (The Danish mathematician Julius Petersen
 studied this graph in 1891; it is often used to illustrate various theoretical properties of graphs.)
 Solution: The subgraph H of the Petersen graph obtained by deleting b and the three edges
 that have b as an endpoint, shown in Figure 14(b), is homeomorphic to K3,3, with vertex sets
 , becausef, d, j itand can bee, obtainedi, h by a sequence of elementary subdivisions, 27 / 36
 deleting{ } d,h{ and adding} c, h and c, d , deleting e, f and adding a,e and a,f , and
 { } { } { } { } { } { }
 deleting i, j and adding g,i and g,j . Hence, the Petersen graph is not planar. L
 { } { } { }
Exercises
 1. Can five houses be connected to two utilities without con- 7. a b 8. a b
 nections crossing?
In Exercises 2–4 draw the given planar graph without any h c
crossings. f c
 g d
 2. 3.
 e d f e
 9. a
 i b
 h
 4.
 g c
 f d
 e
 10. Complete the argument in Example 3.
 11. Show that K5 is nonplanar using an argument similar to
 that given in Example 3.
In Exercises 5–9 determine whether the given graph is planar.
If so, draw it so that no edges cross. 12. Suppose that a connected planar graph has eight vertices,
 each of degree three. Into how many regions is the plane
 divided by a planar representation of this graph?
 5. a 6. a b c
 13. Suppose that a connected planar graph has six vertices,
 each of degree four. Into how many regions is the plane
 b c divided by a planar representation of this graph?
 14. Suppose that a connected planar graph has 30 edges. If a
 planar representation of this graph divides the plane into
 d e f def 20 regions, how many vertices does this graph have?
Dính hai đỉnh kề nhau
 28 / 36
Định nghĩa
Một minor của đồ thị G là một đồ thị thu được từ G bằng một số
hữu hạn lần xóa đỉnh, xóa cạnh, và dính hai đỉnh kề nhau của G.
 29 / 36
Ví dụ
Chu trình C3 có phải là một minor của đồ thị sau không?
 30 / 36
31 / 36
Định lý (Wagner)
Đồ thị là không phẳng nếu và chỉ nếu nó chứa một minor là K3,3
hoặc K5.
 32 / 36
Bài tập
Chứng minh rằng đồ thị Peterson dưới đây không phẳng.
 33 / 36
 Tô màu bản đồ
 10.8 Graph Coloring 727
 B
 G B
 C A
 D F
 A C
 E
 E D
 FIGURE 1 Two Maps.Hình: Hai bản đồ
10.8 Graph Coloring
Introduction
 34 / 36
 Problems related to the coloring of maps of regions, such as maps of parts of the world, have
 generated many results in graph theory. When a map∗ is colored, two regions with a common
 border are customarily assigned different colors. One way to ensure that two adjacent regions
 never have the same color is to use a different color for each region. However, this is inefficient,
 and on maps with many regions it would be hard to distinguish similar colors. Instead, a small
 number of colors should be used whenever possible. Consider the problem of determining the
 least number of colors that can be used to color a map so that adjacent regions never have the
 same color. For instance, for the map shown on the left in Figure 1, four colors suffice, but three
 colors are not enough. (The reader should check this.) In the map on the right in Figure 1, three
 colors are sufficient (but two are not).
 Each map in the plane can be represented by a graph. To set up this correspondence,
 each region of the map is represented by a vertex. Edges connect two vertices if the regions
 represented by these vertices have a common border. Two regions that touch at only one point
 are not considered adjacent. The resulting graph is called the dual graph of the map. By the way
 in which dual graphs of maps are constructed, it is clear that any map in the plane has a planar
 dual graph. Figure 2 displays the dual graphs that correspond to the maps shown in Figure 1.
 The problem of coloring the regions of a map is equivalent to the problem of coloring the
 vertices of the dual graph so that no two adjacent vertices in this graph have the same color. We
 now define a graph coloring.
DEFINITION 1 A coloring of a simple graph is the assignment of a color to each vertex of the graph so that
 no two adjacent vertices are assigned the same color.
 B
 B
 C
 D G C
 A A E
 F
 D
 E
 FIGURE 2 Dual Graphs of the Maps in Figure 1.
 ∗We will assume that all regions in a map are connected. This eliminates any problems presented by such geographical entities
 as Michigan.
 10.8 Graph Coloring 727
 B
 G B
 C A
 D F
 A C
 E
 E D
 FIGURE 1 Two Maps.
10.8 Graph Coloring
 Introduction
 Problems related to the coloring of maps of regions, such as maps of parts of the world, have
 generated many results in graph theory. When a map∗ is colored, two regions with a common
 border are customarily assigned different colors. One way to ensure that two adjacent regions
 never have the same color is to use a different color for each region. However, this is inefficient,
 and on maps with many regions it would be hard to distinguish similar colors. Instead, a small
 number of colors should be used whenever possible. Consider the problem of determining the
 least number of colors that can be used to color a map so that adjacent regions never have the
 same color. For instance, for the map shown on the left in Figure 1, four colors suffice, but three
 colors are not enough. (The reader should check this.) In the map on the right in Figure 1, three
 colors are sufficient (but two are not).
 Each map in the plane can be represented by a graph. To set up this correspondence,
 each region of the map is represented by a vertex. Edges connect two vertices if the regions
 represented by these vertices have a common border. Two regions that touch at only one point
 are not considered adjacent. The resulting graph is called the dual graph of the map. By the way
 in which dual graphs of maps are constructed, it is clear that any map in the plane has a planar
 dual graph. Figure 2 displays the dual graphs that correspond to the maps shown in Figure 1.
 The problem of coloring the regions of a map is equivalent to the problem of coloring the
 vertices of the dual graph so that no two adjacent vertices in this graph have the same color. We
 now define a graph coloring.
 Tô màu đồ thị
DEFINITION 1 A coloring of a simple graph is the assignment of a color to each vertex of the graph so that
 no two adjacent vertices are assigned the same color.
 B
 B
 C
 D G C
 A A E
 F
 D
 E
 FIGURE 2 Hình:DualCác Graphs đồ thị of của the hai Maps bản inđồ Figure trước 1.
 ∗We will assume that all regions in a map are connected. This eliminates any problems presented by such geographical entities
 as Michigan.
 35 / 36
Định lý (Bốn màu)
Số màu của một đồ thị phẳng không lớn hơn 4.
 Hình: từ wikipedia
 36 / 36
File đính kèm:
 bai_giang_toan_roi_rac_chuong_do_thi_phang_tran_vinh_duc.pdf

