Application of Alfred Marshall model for estimating Vietnam electricity demand
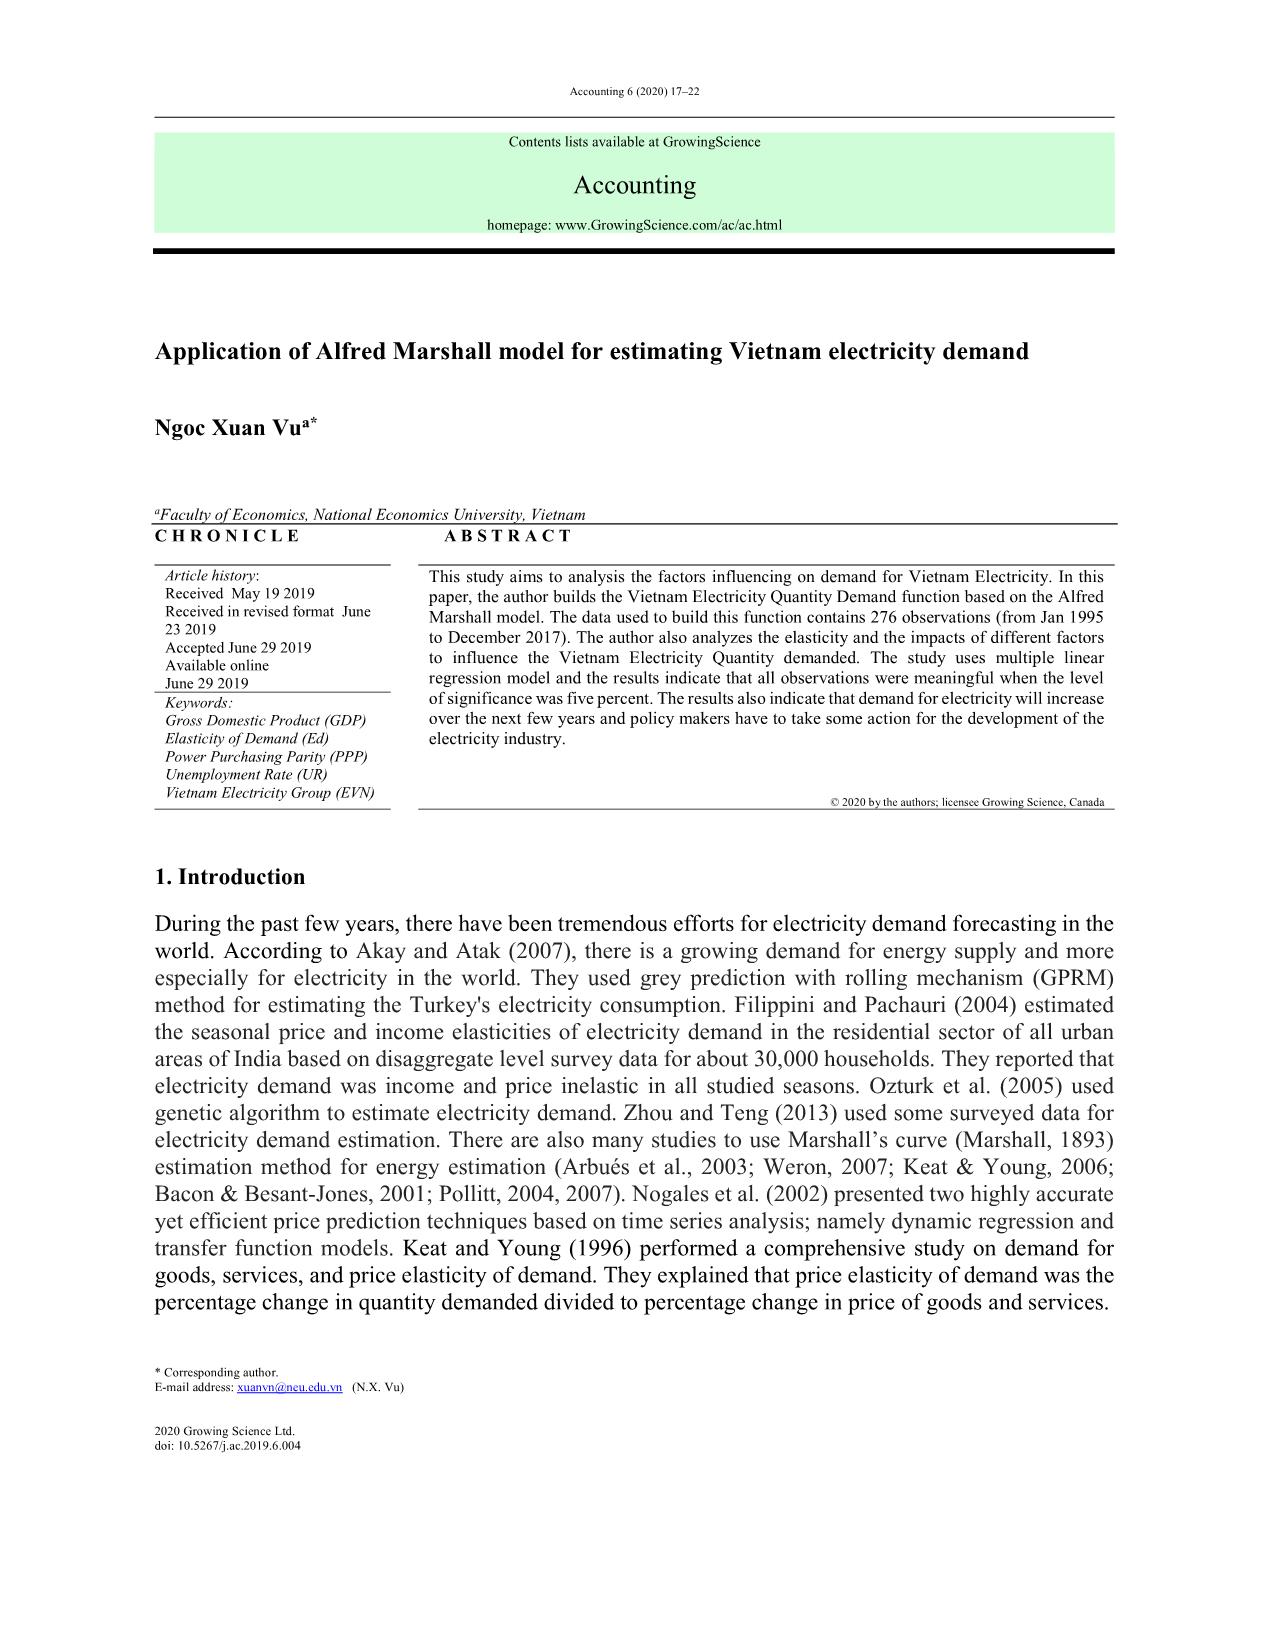
This study aims to analysis the factors influencing on demand for Vietnam Electricity. In this
paper, the author builds the Vietnam Electricity Quantity Demand function based on the Alfred
Marshall model. The data used to build this function contains 276 observations (from Jan 1995
to December 2017). The author also analyzes the elasticity and the impacts of different factors
to influence the Vietnam Electricity Quantity demanded. The study uses multiple linear
regression model and the results indicate that all observations were meaningful when the level
of significance was five percent. The results also indicate that demand for electricity will increase
over the next few years and policy makers have to take some action for the development of the
electricity industry.
Trang 1
Trang 2
Trang 3
Trang 4
Trang 5
Trang 6
Tóm tắt nội dung tài liệu: Application of Alfred Marshall model for estimating Vietnam electricity demand
some basic factors that influence the quantity demanded of a specific commodity. In fact, there may be
some other factors affecting demand that we have not listed here such as advertisement (A), or credit
incentives or policies of the government. In most cases, in order to simplify the model, we often build
bridges with linear functions to facilitate the analysis. Based on the data collected by the authors from
various sources described the quantity demanded for electricity in Vietnam during Jan 1995- Dec 2017,
we have 276 samples or observations. Based on the data, the price of electricity is related to crude oil
(Pg) or petroleum products. Crude oil is an important input in the gas power plants, in addition to
products such as gasoline from crude oil may be substituted for electricity generators to run when a
sudden power loss or crash. The effective monitoring of changes in the world price of crude oil and
electricity prices in Vietnam shows that electricity prices in Vietnam fluctuated with changes in oil
prices during a period of 23 years (1995-2017). This is the usual movements in countries around the
world. Evidence for this is to build electricity demand function, resulting in estimated electricity
demand is related to the volatility of crude oil prices in the world and electricity prices, oil prices are
related to each other in Vietnam. Vietnam's power sector in the last 23 years was in the corporate
monopoly of power (EVN). In summary, the author builds on electricity demand functions in Vietnam
based on the following:
Qe = f (Pe, I, N, t, CPI, GDP, Pg ...)
where Qe, Pe, I, N and t represent demand for electricity (billion kwh), average electricity price
(VNĐ/kwh), income to power purchasing parity (Million VND/capita/month), time (number of
months), respectively. Moreover, CPI, GDP and Pg represent Consumer Price Index (%/year), Gross
Domestic Product (billion USD) and Gasoline Price (USD per barrel), respectively.
Since there is a link between the world price of crude oil and electricity prices in Vietnam, so the crude
oil is considered as the substitute for electricity. Electricity customers in Vietnam have no choice but
to buy electricity directly from EVN. Based on the model proposed, we have determined the demand
for electricity in Vietnam in recent years as follows:
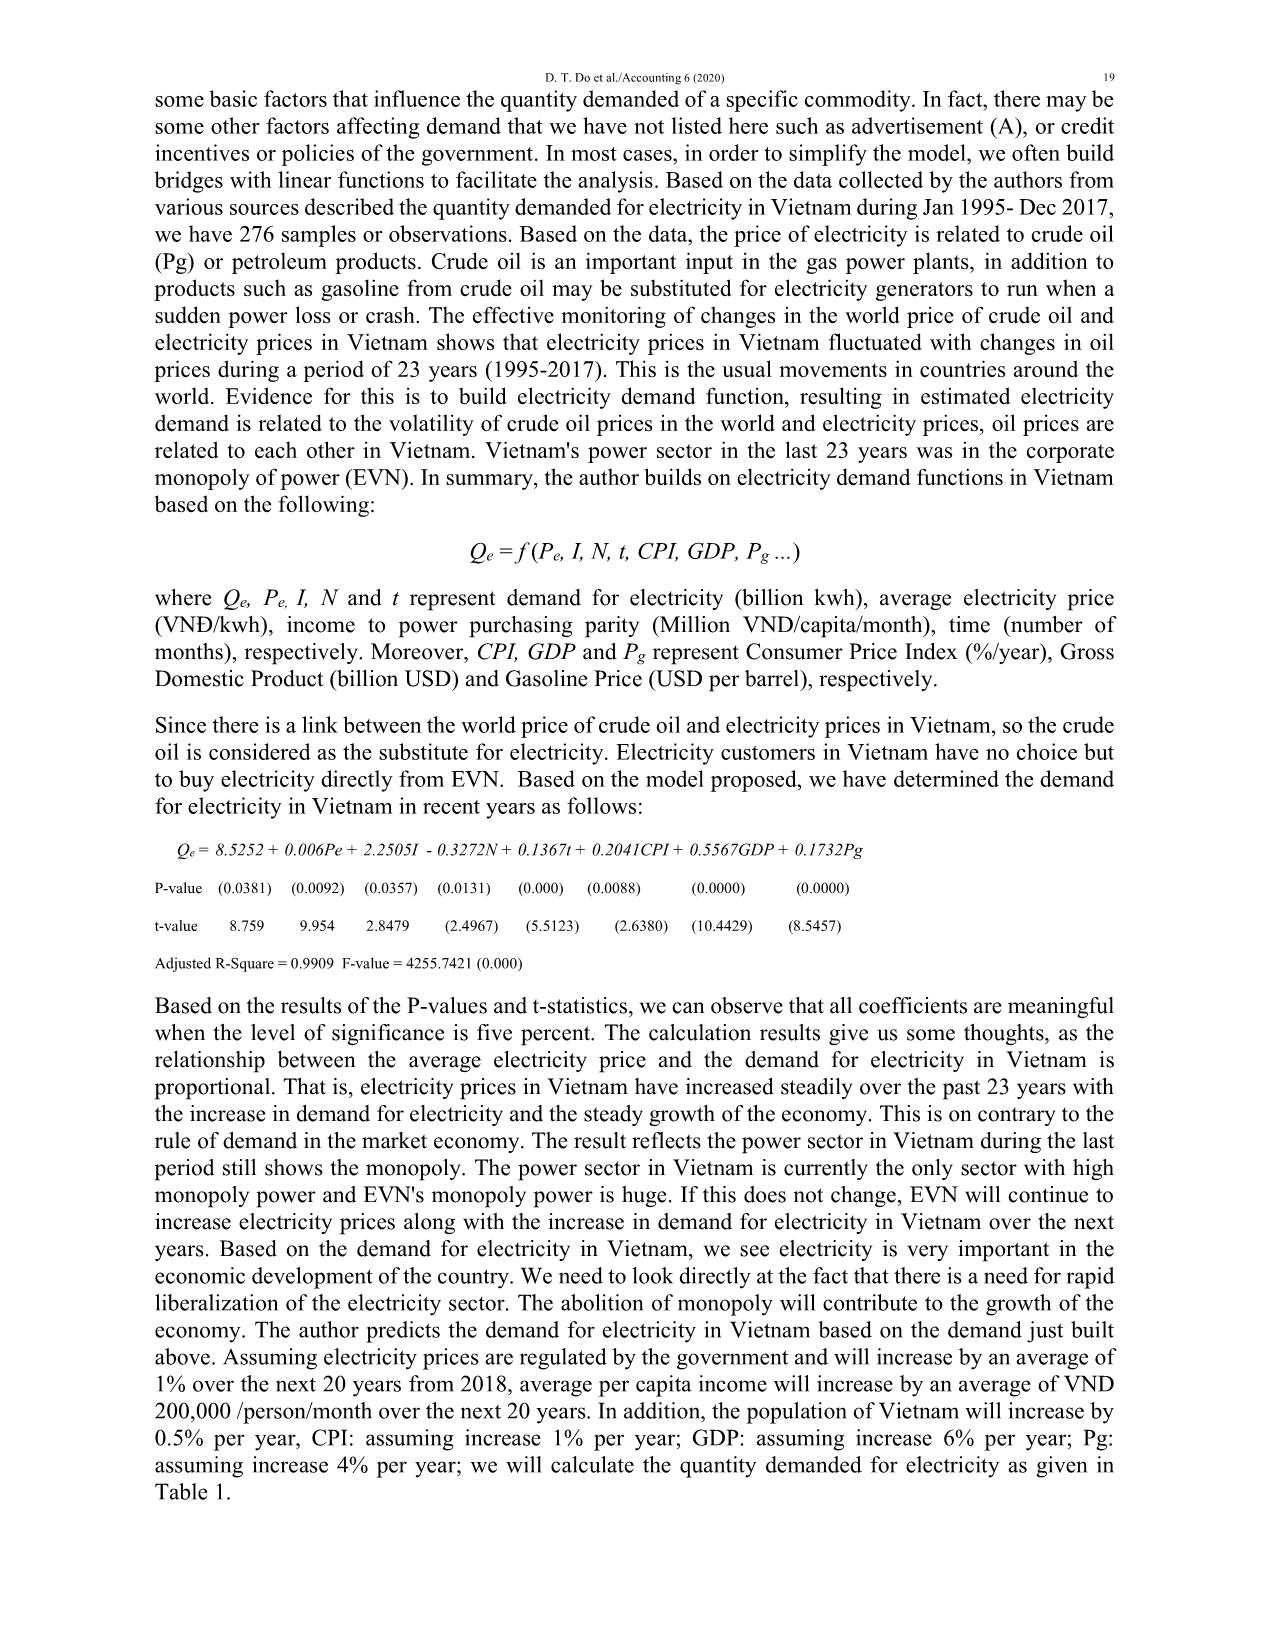
 Qe = 8.5252 + 0.006Pe + 2.2505I - 0.3272N + 0.1367t + 0.2041CPI + 0.5567GDP + 0.1732Pg
P-value (0.0381) (0.0092) (0.0357) (0.0131) (0.000) (0.0088) (0.0000) (0.0000)
t-value 8.759 9.954 2.8479 (2.4967) (5.5123) (2.6380) (10.4429) (8.5457)
Adjusted R-Square = 0.9909 F-value = 4255.7421 (0.000)
Based on the results of the P-values and t-statistics, we can observe that all coefficients are meaningful
when the level of significance is five percent. The calculation results give us some thoughts, as the
relationship between the average electricity price and the demand for electricity in Vietnam is
proportional. That is, electricity prices in Vietnam have increased steadily over the past 23 years with
the increase in demand for electricity and the steady growth of the economy. This is on contrary to the
rule of demand in the market economy. The result reflects the power sector in Vietnam during the last
period still shows the monopoly. The power sector in Vietnam is currently the only sector with high
monopoly power and EVN's monopoly power is huge. If this does not change, EVN will continue to
increase electricity prices along with the increase in demand for electricity in Vietnam over the next
years. Based on the demand for electricity in Vietnam, we see electricity is very important in the
economic development of the country. We need to look directly at the fact that there is a need for rapid
liberalization of the electricity sector. The abolition of monopoly will contribute to the growth of the
economy. The author predicts the demand for electricity in Vietnam based on the demand just built
above. Assuming electricity prices are regulated by the government and will increase by an average of
1% over the next 20 years from 2018, average per capita income will increase by an average of VND
200,000 /person/month over the next 20 years. In addition, the population of Vietnam will increase by
0.5% per year, CPI: assuming increase 1% per year; GDP: assuming increase 6% per year; Pg:
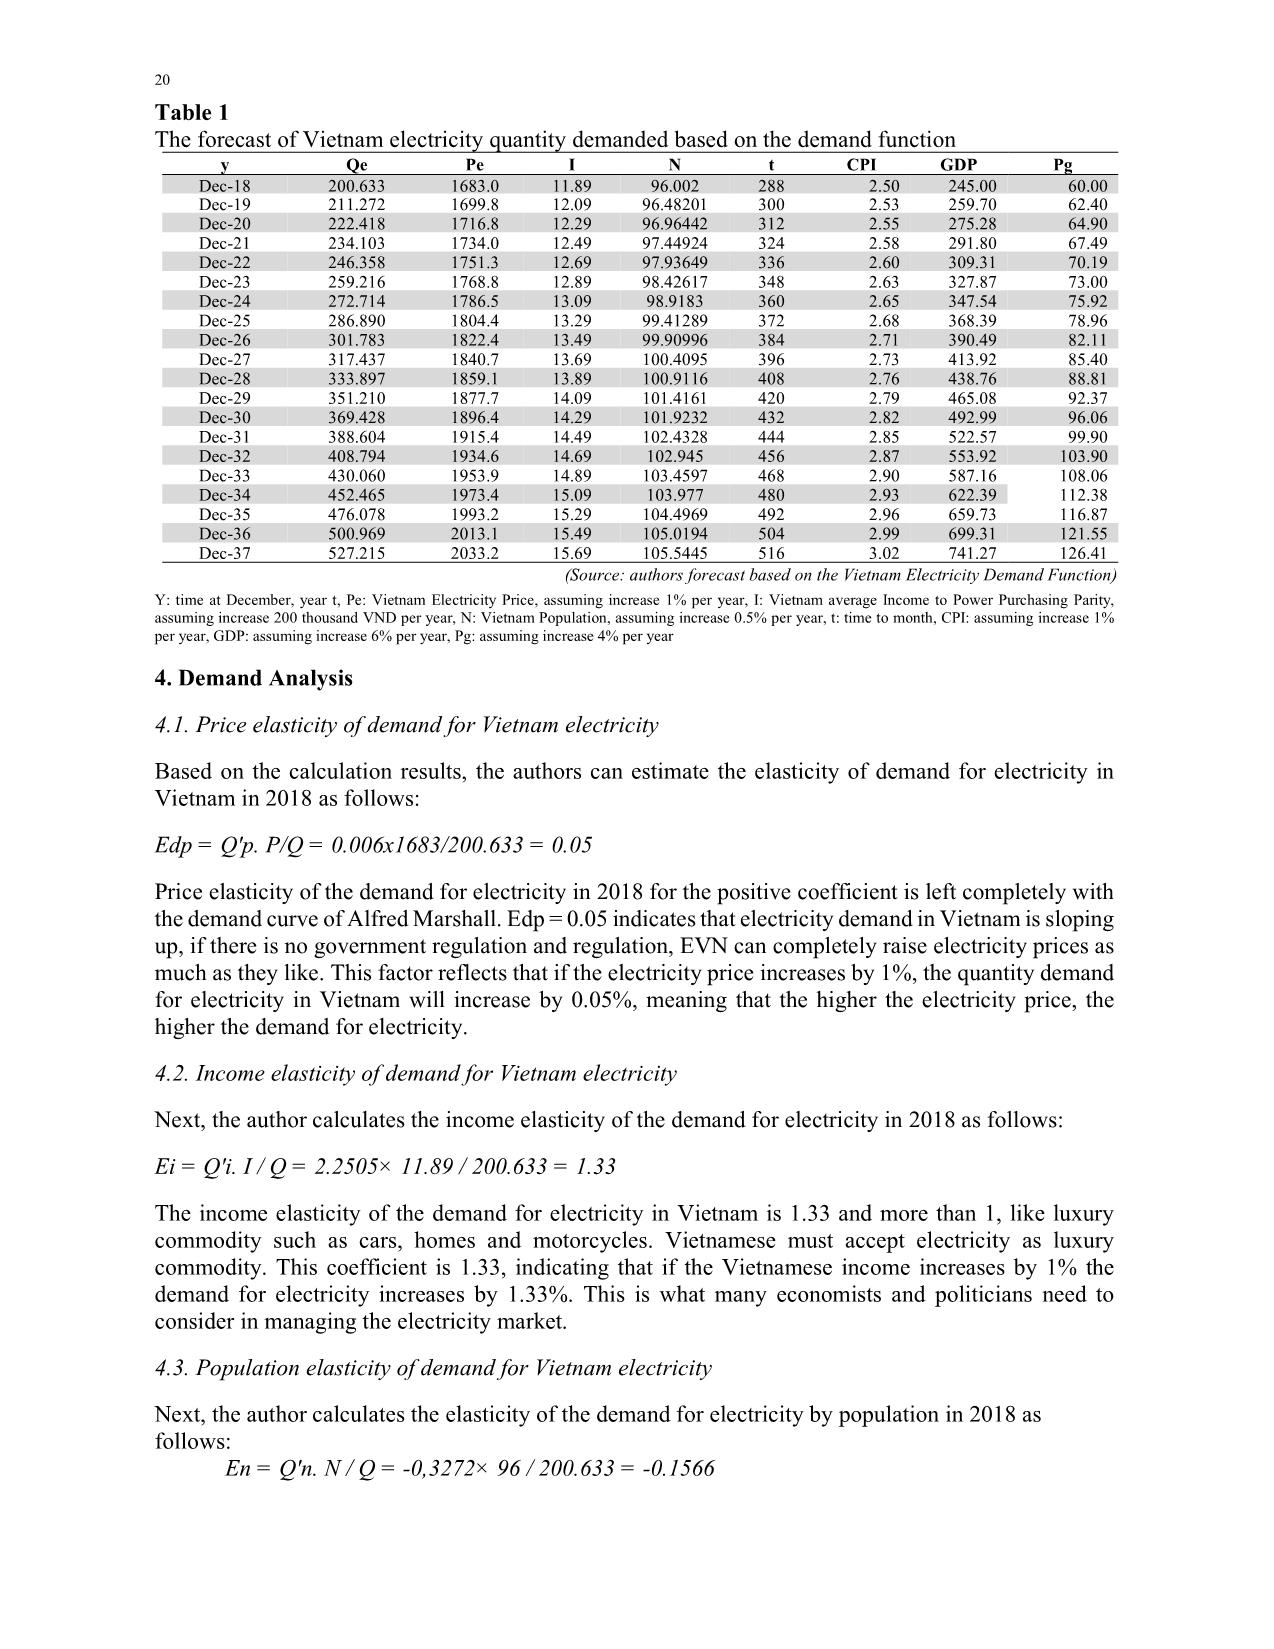
assuming increase 4% per year; we will calculate the quantity demanded for electricity as given in
Table 1.
 20
Table 1
The forecast of Vietnam electricity quantity demanded based on the demand function
y Qe Pe I N t CPI GDP Pg
Dec-18 200.633 1683.0 11.89 96.002 288 2.50 245.00 60.00
Dec-19 211.272 1699.8 12.09 96.48201 300 2.53 259.70 62.40
Dec-20 222.418 1716.8 12.29 96.96442 312 2.55 275.28 64.90
Dec-21 234.103 1734.0 12.49 97.44924 324 2.58 291.80 67.49
Dec-22 246.358 1751.3 12.69 97.93649 336 2.60 309.31 70.19
Dec-23 259.216 1768.8 12.89 98.42617 348 2.63 327.87 73.00
Dec-24 272.714 1786.5 13.09 98.9183 360 2.65 347.54 75.92
Dec-25 286.890 1804.4 13.29 99.41289 372 2.68 368.39 78.96
Dec-26 301.783 1822.4 13.49 99.90996 384 2.71 390.49 82.11
Dec-27 317.437 1840.7 13.69 100.4095 396 2.73 413.92 85.40
Dec-28 333.897 1859.1 13.89 100.9116 408 2.76 438.76 88.81
Dec-29 351.210 1877.7 14.09 101.4161 420 2.79 465.08 92.37
Dec-30 369.428 1896.4 14.29 101.9232 432 2.82 492.99 96.06
Dec-31 388.604 1915.4 14.49 102.4328 444 2.85 522.57 99.90
Dec-32 408.794 1934.6 14.69 102.945 456 2.87 553.92 103.90
Dec-33 430.060 1953.9 14.89 103.4597 468 2.90 587.16 108.06
Dec-34 452.465 1973.4 15.09 103.977 480 2.93 622.39 112.38
Dec-35 476.078 1993.2 15.29 104.4969 492 2.96 659.73 116.87
Dec-36 500.969 2013.1 15.49 105.0194 504 2.99 699.31 121.55
Dec-37 527.215 2033.2 15.69 105.5445 516 3.02 741.27 126.41
 (Source: authors forecast based on the Vietnam Electricity Demand Function)
Y: time at December, year t, Pe: Vietnam Electricity Price, assuming increase 1% per year, I: Vietnam average Income to Power Purchasing Parity,
assuming increase 200 thousand VND per year, N: Vietnam Population, assuming increase 0.5% per year, t: time to month, CPI: assuming increase 1%
per year, GDP: assuming increase 6% per year, Pg: assuming increase 4% per year
4. Demand Analysis
4.1. Price elasticity of demand for Vietnam electricity
Based on the calculation results, the authors can estimate the elasticity of demand for electricity in
Vietnam in 2018 as follows:
Edp = Q'p. P/Q = 0.006x1683/200.633 = 0.05
Price elasticity of the demand for electricity in 2018 for the positive coefficient is left completely with
the demand curve of Alfred Marshall. Edp = 0.05 indicates that electricity demand in Vietnam is sloping
up, if there is no government regulation and regulation, EVN can completely raise electricity prices as
much as they like. This factor reflects that if the electricity price increases by 1%, the quantity demand
for electricity in Vietnam will increase by 0.05%, meaning that the higher the electricity price, the
higher the demand for electricity.
4.2. Income elasticity of demand for Vietnam electricity
Next, the author calculates the income elasticity of the demand for electricity in 2018 as follows:
Ei = Q'i. I / Q = 2.2505× 11.89 / 200.633 = 1.33
The income elasticity of the demand for electricity in Vietnam is 1.33 and more than 1, like luxury
commodity such as cars, homes and motorcycles. Vietnamese must accept electricity as luxury
commodity. This coefficient is 1.33, indicating that if the Vietnamese income increases by 1% the
demand for electricity increases by 1.33%. This is what many economists and politicians need to
consider in managing the electricity market.
4.3. Population elasticity of demand for Vietnam electricity
Next, the author calculates the elasticity of the demand for electricity by population in 2018 as
follows:
 En = Q'n. N / Q = -0,3272× 96 / 200.633 = -0.1566
D. T. Do et al./Accounting 6 (2020) 21
The elasticity indicates that Vietnam's population is negatively correlated with the demand for
electricity. En = -0.1566 indicates that if Vietnam's population increases by 1%, the quantity demand
for electricity in Vietnam decreases by -0.1566%. This reflects a monopoly power market that does not
benefit the people and consumers.
4.4. Time elasticity of demand for Vietnam electricity
Next, the author calculates the elasticity of the demand for electricity by time in Dec 2018 as follows:
Et = Q't × t /Q = 0,1367× 288 / 200.633 = 0.1962
This elasticity indicates that time is positively correlated with the demand for electricity. Et = 0.1962
indicates that if time increases by 1%, the quantity demand for electricity in Vietnam increases by
0.1962%. These results are not consistent with the Marshall model when the time increases, the
consumers can easily find the substitutes, so the quantity demand will decrease more and the demand
is elastic. The figures also reflect a monopoly power market that does not benefit the people and
consumers.
4.5. CPI elasticity of demand for Vietnam electricity
Next, the author calculates the elasticity of the demand for electricity by CPI in Dec 2018 as follows:
Et = Q'cpi × CPI /Q = 0,2041× 2.5 / 200.633 = 0.00254
This elasticity indicates that CPI is positively correlated with the demand for electricity. Ecpi = 0.00254
indicates that if CPI increases by 1%, the quantity demand for electricity in Vietnam also increases by
0.00254%.
4.6. GDP elasticity of demand for Vietnam electricity
Next, the author calculates the elasticity of the demand for electricity by GDP in Dec 2018 as follows:
Et = Q'gdp × GDP /Q = 0,5567× 245 / 200.633 = 0.6798
This elasticity indicates that GDP is positively correlated with the demand for electricity. Egdp = 0.6798
indicates that if GDP increases by 1%, the quantity demand for electricity in Vietnam also increases by
0.6798%.
4.7 Gross elasticity of demand for Vietnam electricity
Finally, the author calculates the elasticity of the demand for electricity by price of crude oil in Dec
2018 as follows:
Et = Q'pg × Pg /Q = 0,1732× 60 / 200.633 = 0.0517
This elasticity indicates that crude oil is positively correlated with the demand for electricity. Epg =
0.0517 indicates that if Pg increases by 1%, the quantity demand for electricity in Vietnam increases
by 0.0517%.
5. Conclusions and recommendations
The findings of Vietnam electricity quantity demanded function are very meaningful. These results
help us understand the situation of the Vietnam electricity monopoly market. This function helps us
forecast the Vietnam electricity quantity demanded for the future. The author hopes that the Vietnam
government and ministry of industry and trade will help us construct and development the Vietnam
electricity competitive in the next year. In addition, such an enormous contribution of the supply and
demand theory of Marshall remains valid until today for the supply and demand model to explain the
 22
volatility of all the goods and services on the market. Vietnam applied the market economy-oriented
socialist, i.e. applying the model of supply and demand of Marshall in solving problems of social and
economics. All decisions about the economy in view of Marshall are based on the theory of interest.
So, in all decisions on economic and social, economists and the politicians should be based on the
theory of supply and demand to make a decision. Marginal analysis methods should be prioritized for
use in economic analysis. To apply the doctrine of Marshall effectively in the process of economic
development, Vietnam should consider some measures. First, the need to respect the application of the
doctrine of Marshall as a mainstream ideology that the Party and State concern. Second, the policy
makers should actively promote the movement of learning and following the moral example of Ho Chi
Minh. The movement must be built upon the foundation of the theory of supply and demand and the
theory about the benefits of Marshall.
References
Akay, D., & Atak, M. (2007). Grey prediction with rolling mechanism for electricity demand forecasting
of Turkey. Energy, 32(9), 1670-1675.
Arbués, F., Garcıa-Valiñas, M. Á., & Martınez-Espiñeira, R. (2003). Estimation of residential water
demand: a state-of-the-art review. The Journal of Socio-Economics, 32(1), 81-102.
Bacon, R. W., & Besant-Jones, J. (2001). Global electric power reform, privatization, and liberalization of
the electric power industry in developing countries. Annual Review of Energy and the
Environment, 26(1), 331-359.
Dawson, A. A., Diedrich, K., & Felberbaum, R. E. (2005). Why do couples refuse or discontinue
ART?. Archives of Gynecology and Obstetrics, 273(1), 3.
Filippini, M., & Pachauri, S. (2004). Elasticities of electricity demand in urban Indian households. Energy
policy, 32(3), 429-436.
Hattori, T., & Tsutsui, M. (2004). Economic impact of regulatory reforms in the electricity supply industry:
a panel data analysis for OECD countries. Energy Policy, 32(6), 823-832.
Keat, P., & Young, P. (2006). Managerial Economics-Economic Tools for Today's Decision Makers
Prentice Hall. New Jersey.
Lehtonen, N. (2015). Price Elasticity of Demand in Revenue Maximisation: a case study with sales history
data of# CMAX. gg.
Marshall, A. (1893). Consumer's surplus. The Annals of the American Academy of Political and Social
Science, 3, 90-93.
Nogales, F. J., Contreras, J., Conejo, A. J., & Espínola, R. (2002). Forecasting next-day electricity prices
by time series models. IEEE Transactions on Power Systems, 17(2), 342-348.
Ozturk, H. K., Ceylan, H., Canyurt, O. E., & Hepbasli, A. (2005). Electricity estimation using genetic
algorithm approach: a case study of Turkey. Energy, 30(7), 1003-1012.
Pollitt, M. G. (2007). Liberalisation and Regulation in Electricity Systems: How can we get the balance
right?.
Pollitt, M. (2004). Electricity reform in Chile. Lessons for developing countries. Journal of Network
Industries, (3-4), 221-262.
Pollitt, M. (2008). Electricity reform in Argentina: Lessons for developing countries. Energy
Economics, 30(4), 1536-1567.
Steiner, F. (2000). Regulation, industry structure, and performance in the electricity supply
industry. Available at SSRN 223648.
Weron, R. (2007). Modeling and forecasting electricity loads and prices: A statistical approach (Vol. 403).
John Wiley & Sons.
Zhou, S., & Teng, F. (2013). Estimation of urban residential electricity demand in China using household
survey data. Energy Policy, 61, 394-402.
© 2020 by the authors; licensee Growing Science, Canada. This is an open access
article distributed under the terms and conditions of the Creative Commons Attribution
(CC-BY) license (
File đính kèm:
 application_of_alfred_marshall_model_for_estimating_vietnam.pdf

