An information-theoretic metric based method for selecting clustering attribute
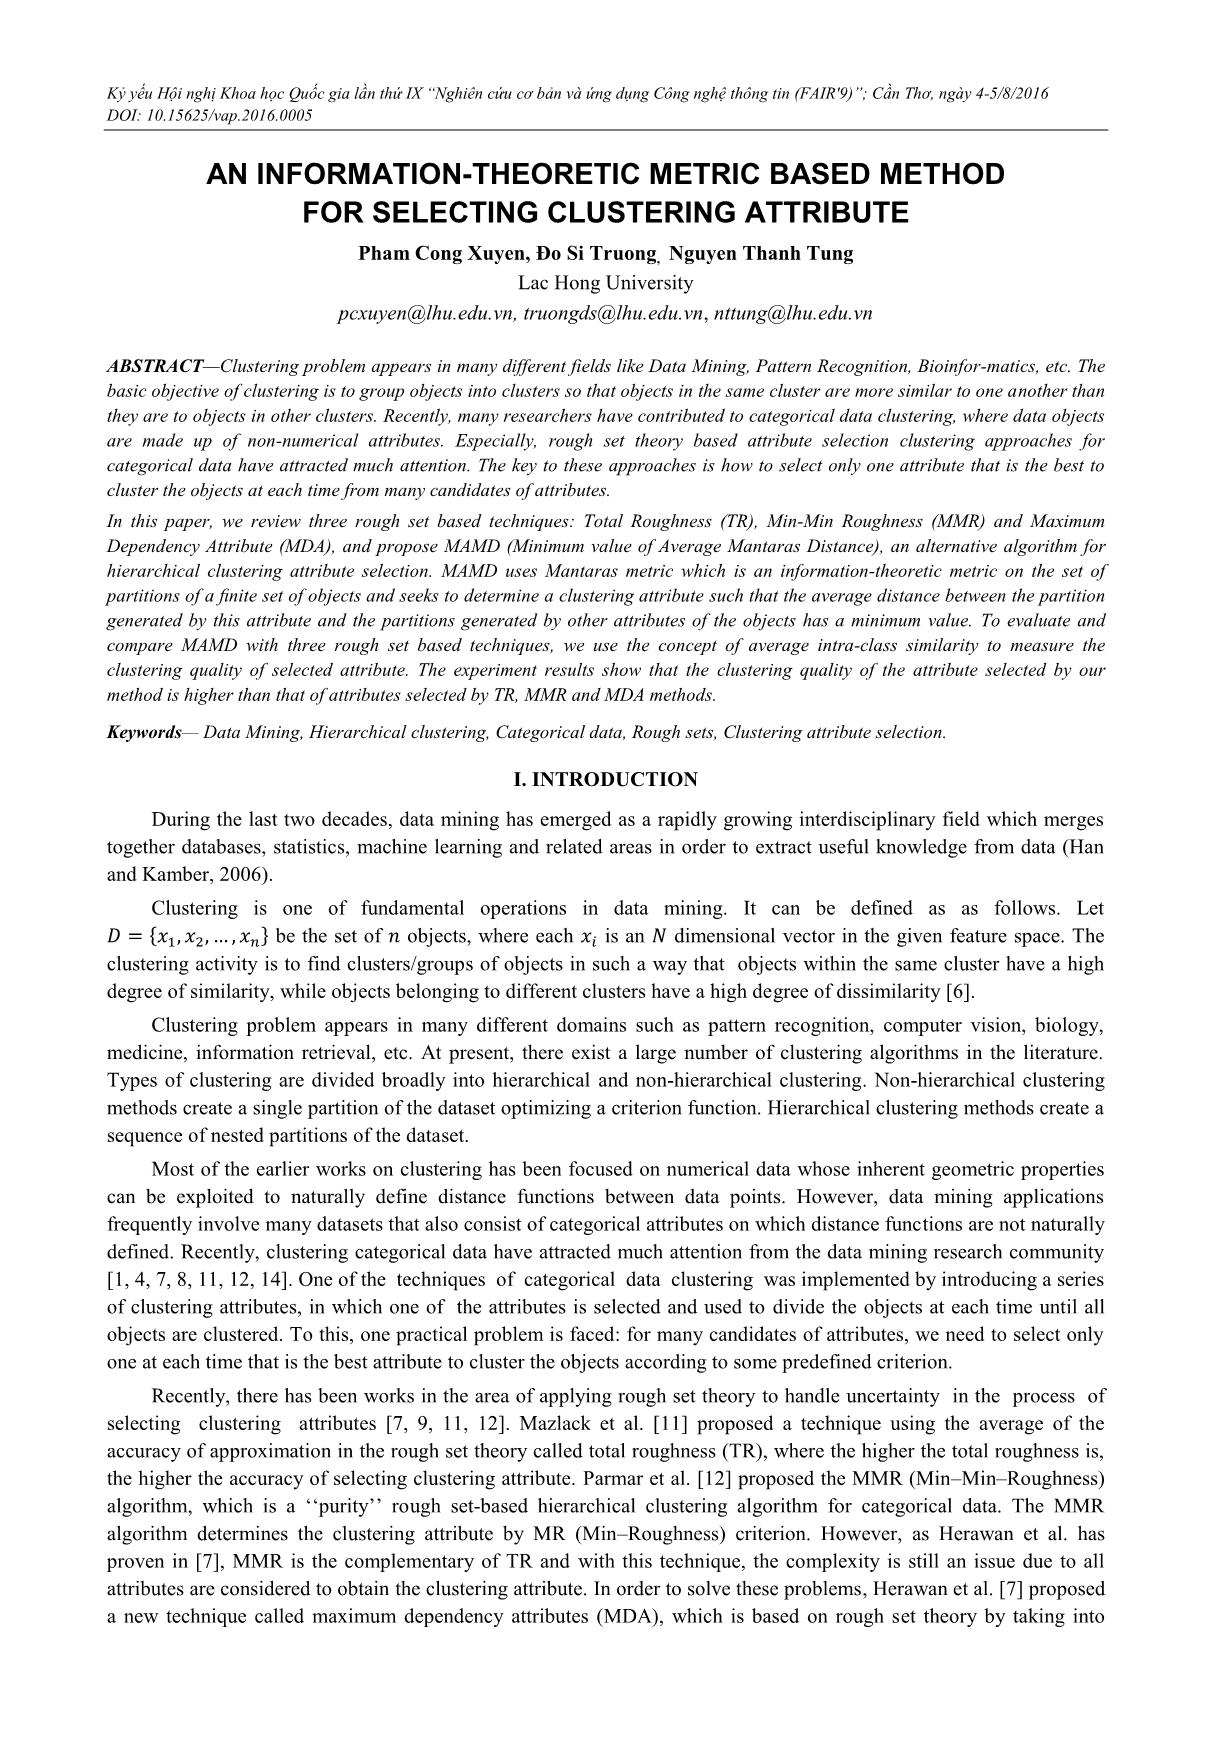
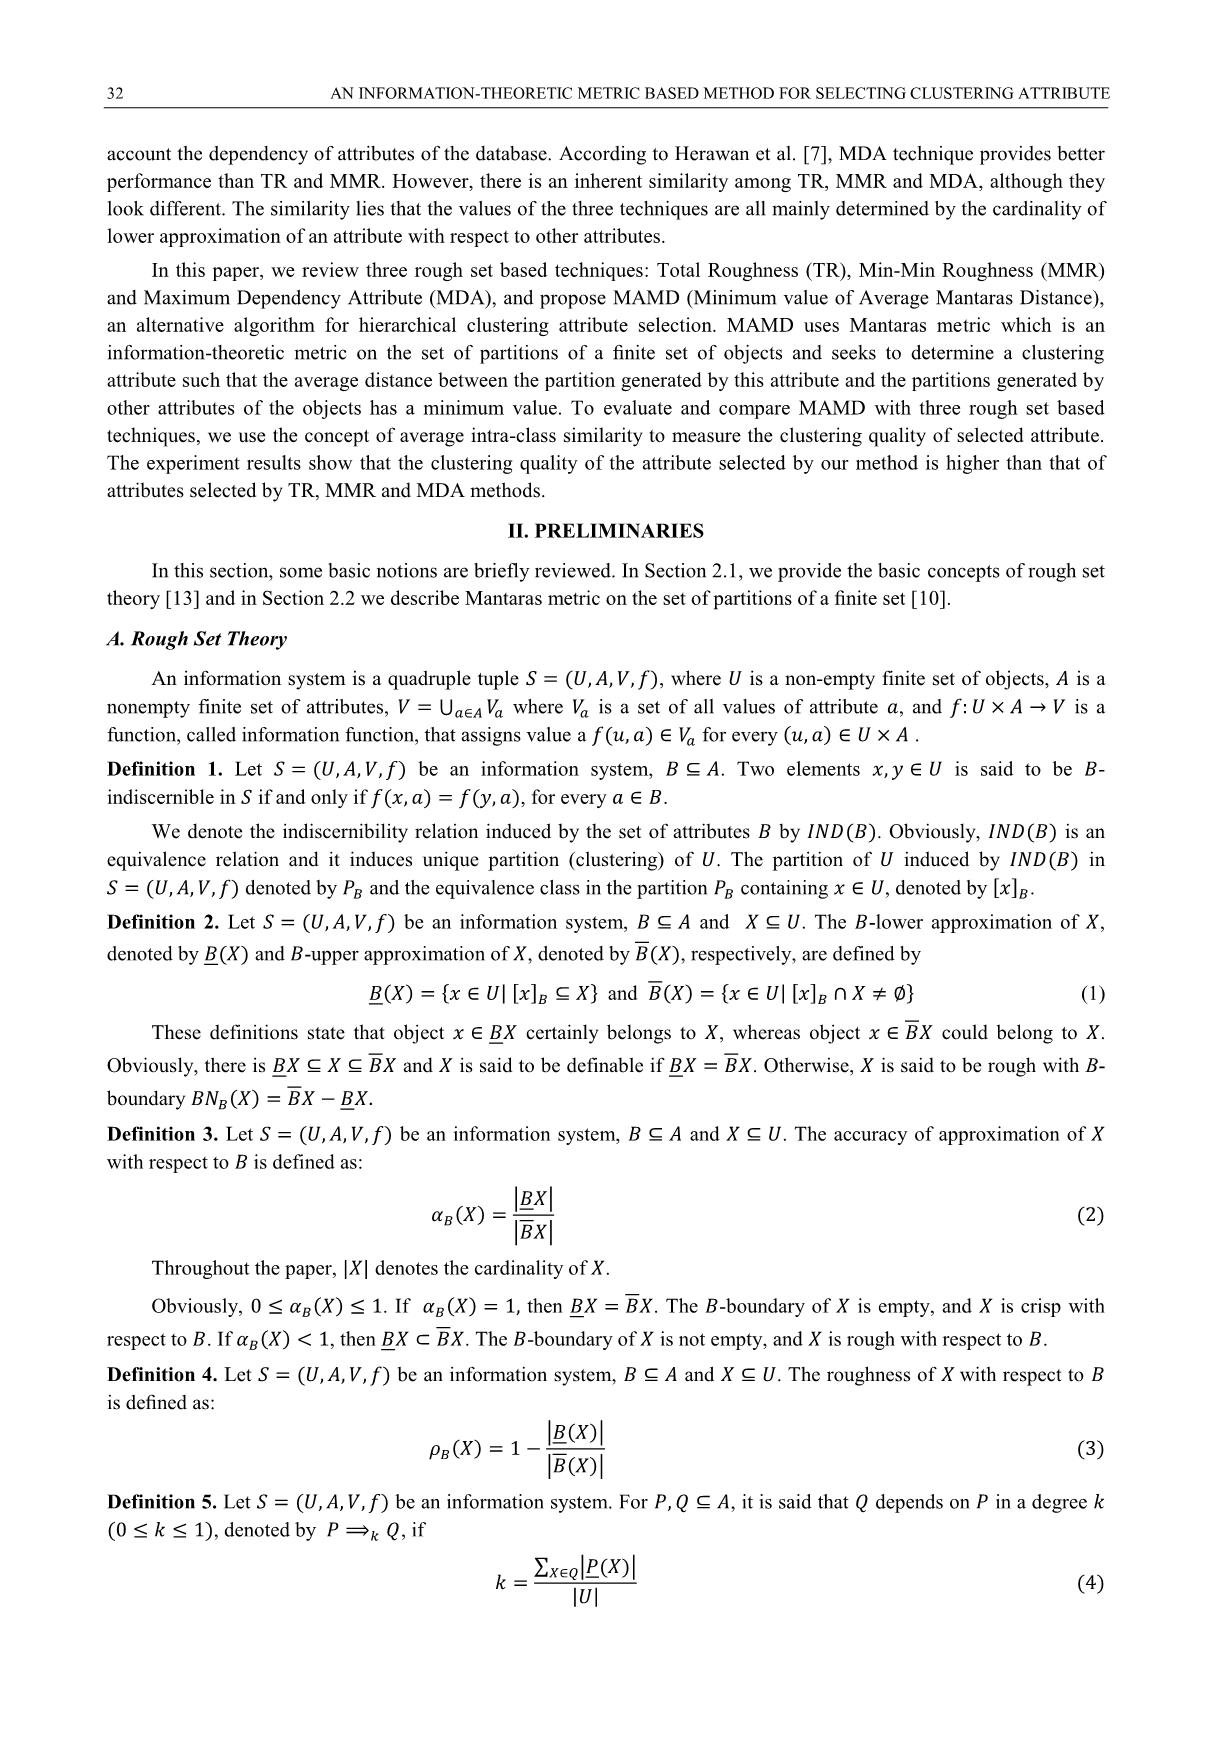
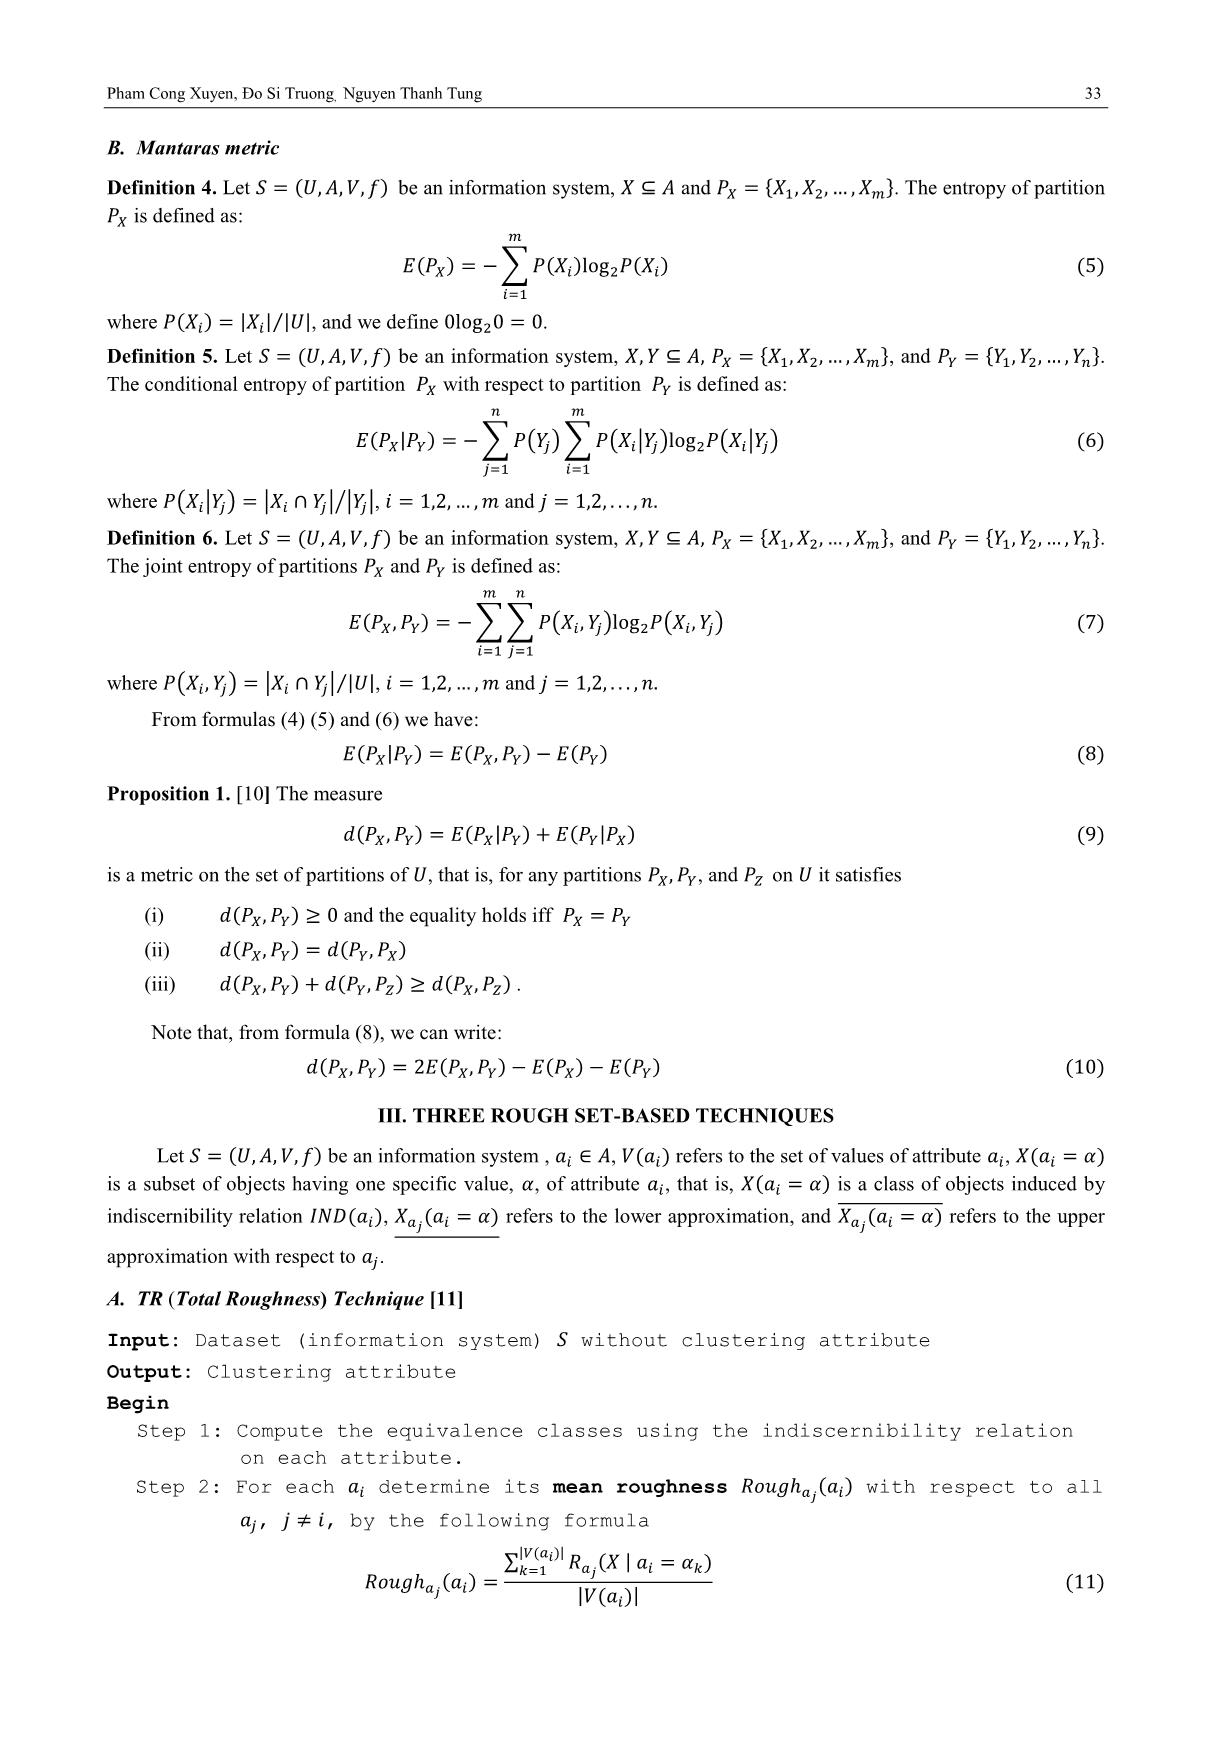
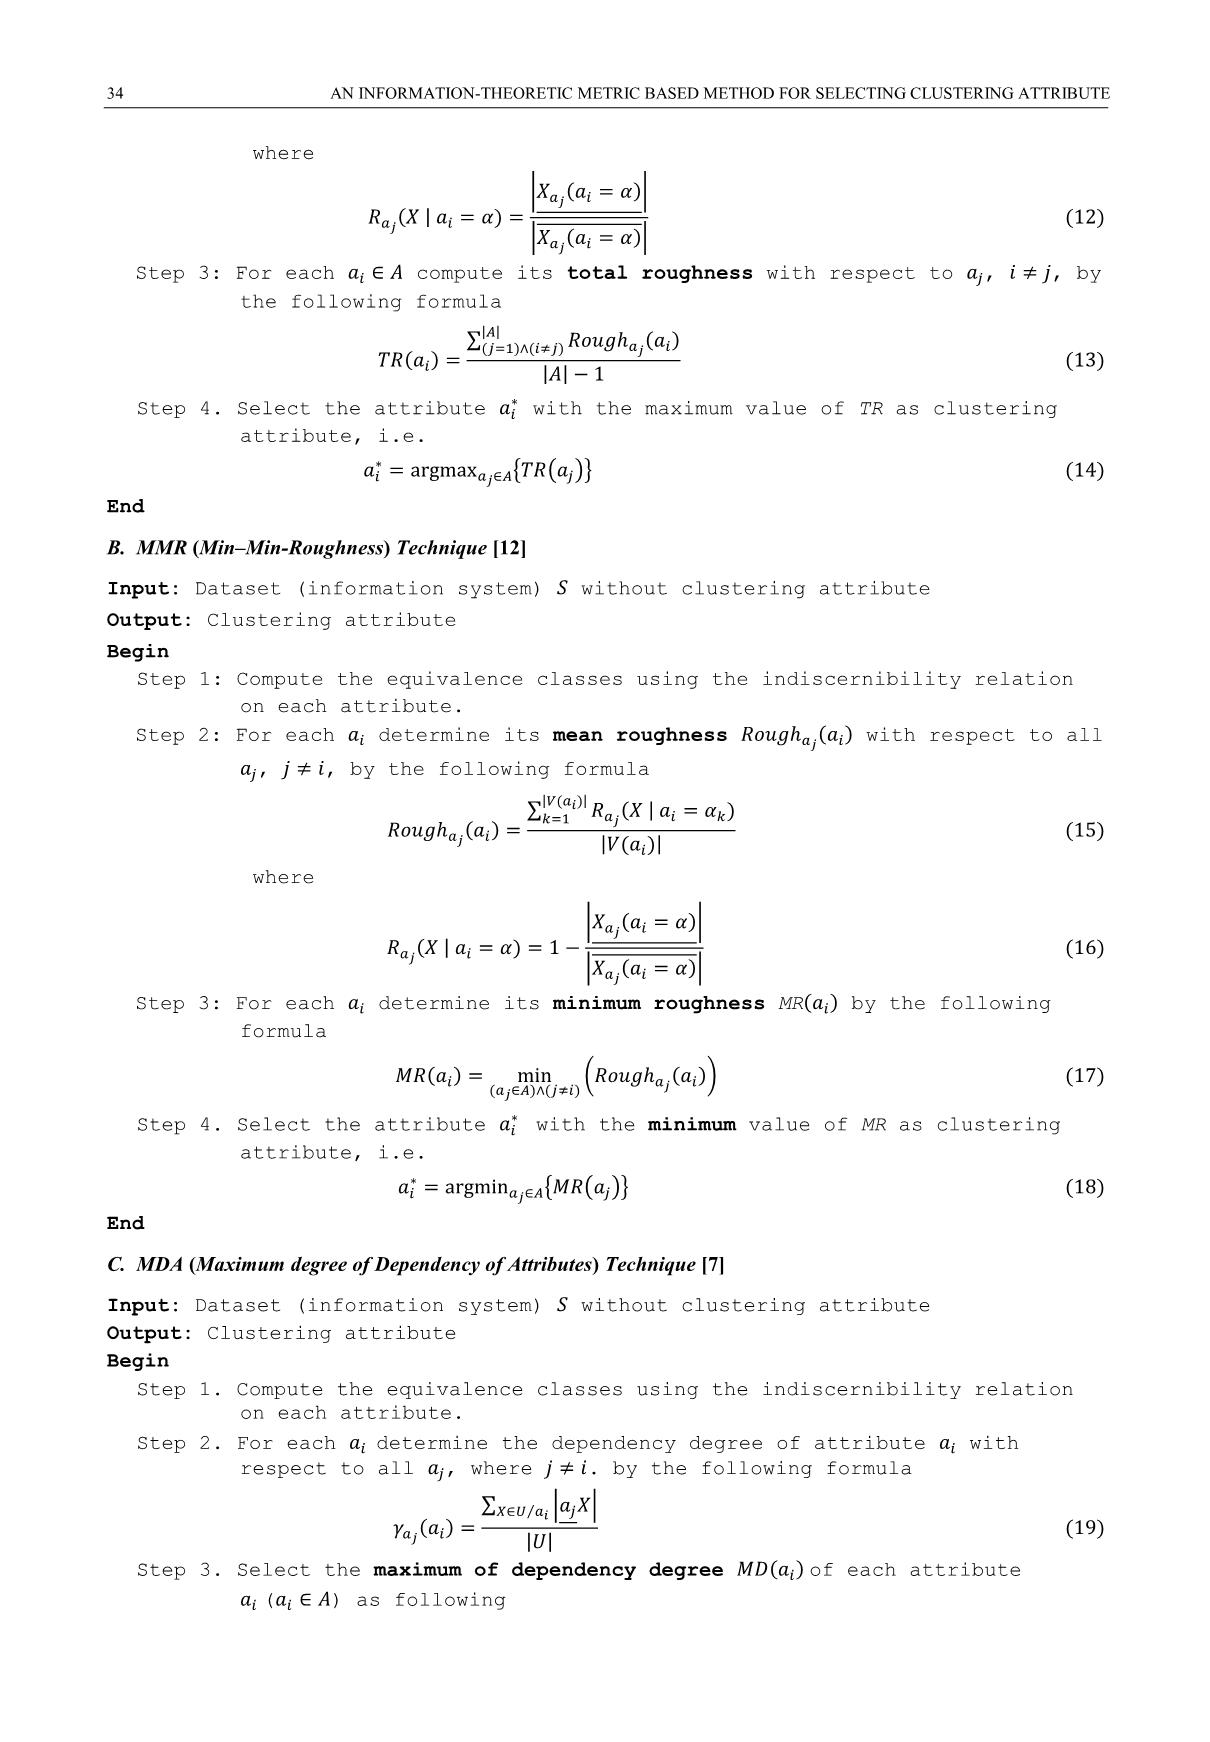
ABSTRACT—Clustering problem appears in many different fields like Data Mining, Pattern Recognition, Bioinfor-Matics, etc. The basic objective of clustering is to group objects into clusters so that objects in the same cluster are more similar to one another than they are to objects in other clusters. Recently, many researchers have contributed to categorical data clustering, where data objects are made up of non-numerical attributes. Especially, rough set theory based attribute selection clustering approaches for categorical data have attracted much attention. The key to these approaches is how to select only one attribute that is the best to cluster the objects at each time from many candidates of attributes. In this paper, we review three rough set based techniques: Total Roughness (TR), Min-Min Roughness (MMR) and Maximum Dependency Attribute (MDA), and propose MAMD (Minimum value of Average Mantaras Distance), an alternative algorithm for hierarchical clustering attribute selection. MAMD uses Mantaras metric which is an information-theoretic metric on the set of partitions of a finite set of objects and seeks to determine a clustering attribute such that the average distance between the partition generated by this attribute and the partitions generated by other attributes of the objects has a minimum value. To evaluate and compare MAMD with three rough set based techniques, we use the concept of average intra-class similarity to measure the clustering quality of selected attribute. The experiment results show that the clustering quality of the attribute selected by our method is higher than that of attributes selected by TR, MMR and MDA methods
Trang 1
Trang 2
Trang 3
Trang 4
Trang 5
Trang 6
Trang 7
Trang 8
Trang 9
Trang 10
Tóm tắt nội dung tài liệu: An information-theoretic metric based method for selecting clustering attribute
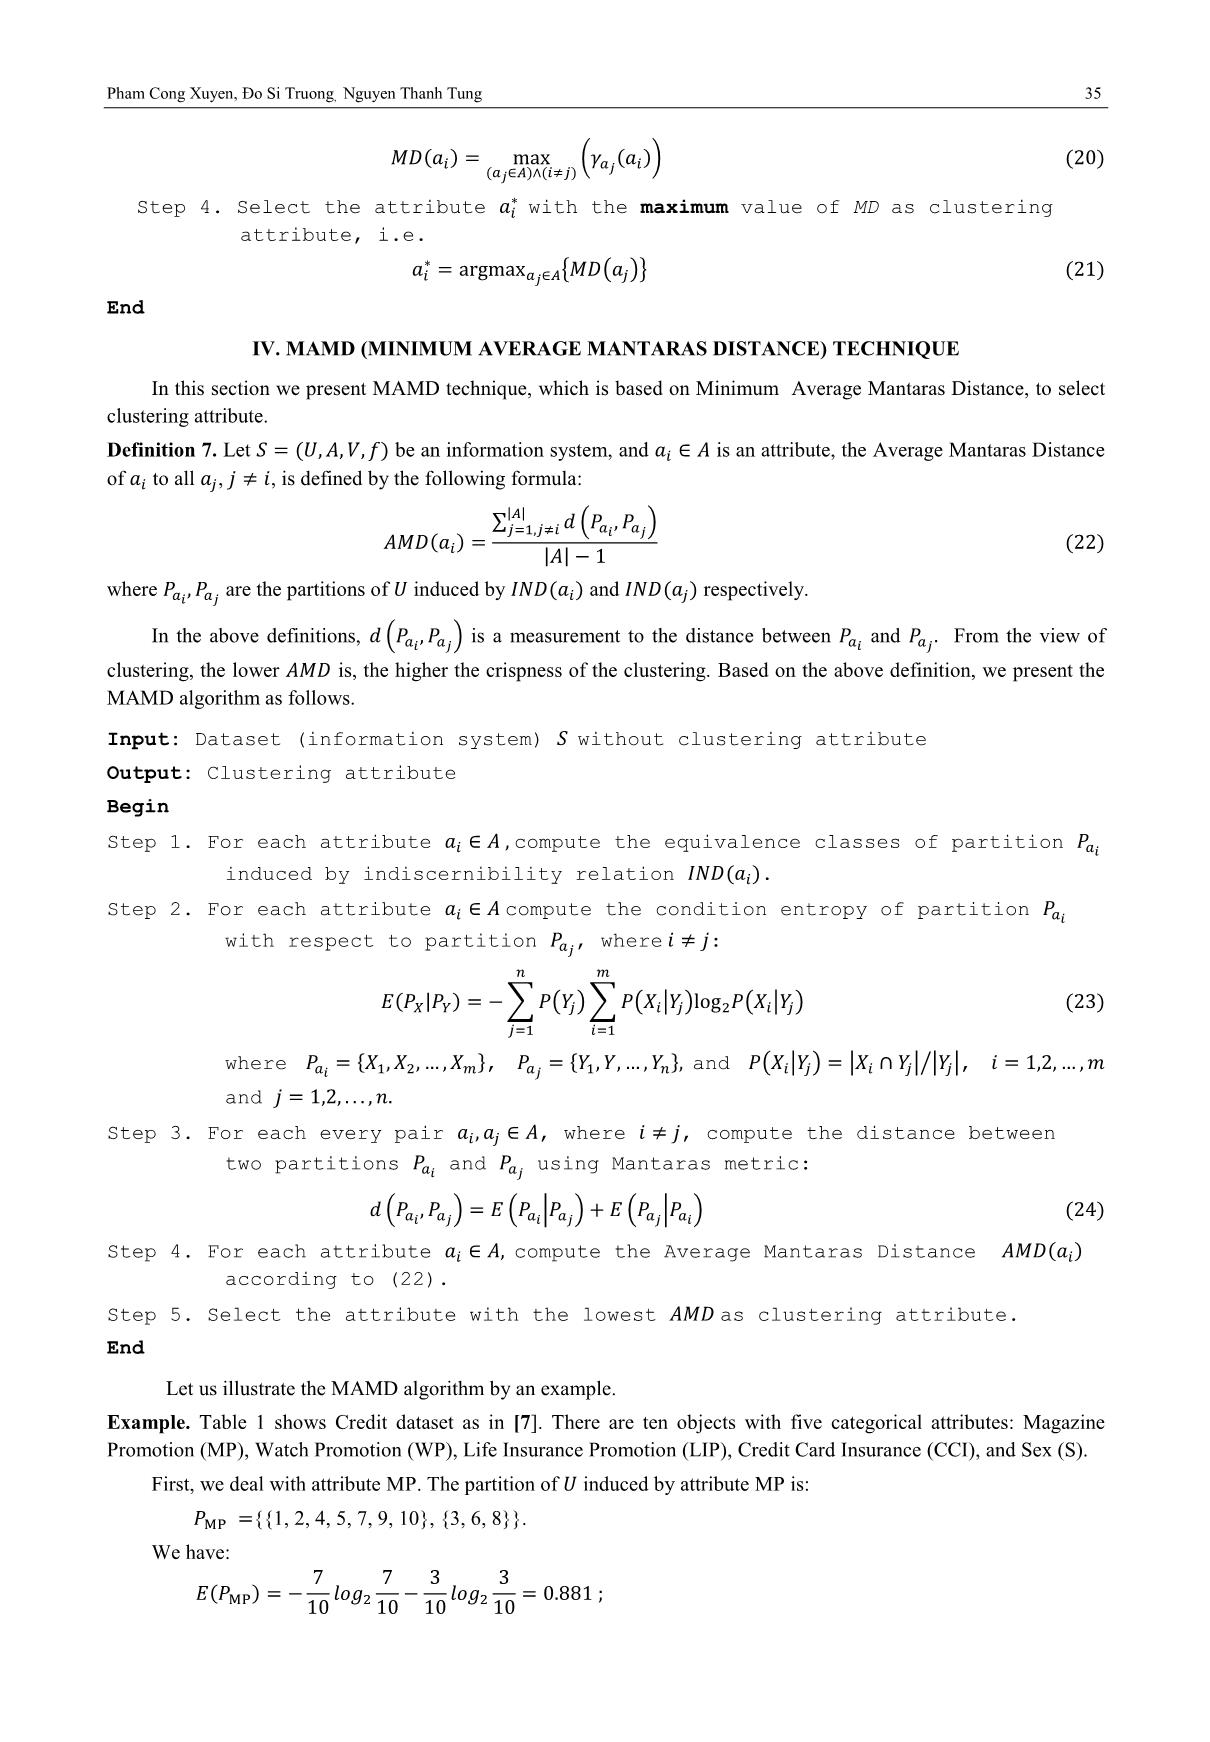
tion we present MAMD technique, which is based on Minimum Average Mantaras Distance, to select
clustering attribute.
Definition 7. Let be an information system, and is an attribute, the Average Mantaras Distance
of to all , , is defined by the following formula:
∑ ( )
| |
| |
where are the partitions of induced by and respectively.
In the above definitions, ( ) is a measurement to the distance between and From the view of
clustering, the lower is, the higher the crispness of the clustering. Based on the above definition, we present the
MAMD algorithm as follows.
Input: Dataset (information system) without clustering attribute
Output: Clustering attribute
Begin
Step 1. For each attribute compute the equivalence classes of partition
induced by indiscernibility relation .
Step 2. For each attribute compute the condition entropy of partition
with respect to partition , where :
 | ∑ ( )
∑ ( | ) ( | )
where { }, { } and ( | ) | | | |⁄ ,
and
Step 3. For each every pair , where , compute the distance between
two partitions and using Mantaras metric:
 ( ) ( | ) ( | )
Step 4. For each attribute compute the Average Mantaras Distance
according to (22).
Step 5. Select the attribute with the lowest as clustering attribute.
End
Let us illustrate the MAMD algorithm by an example.
Example. Table 1 shows Credit dataset as in [7]. There are ten objects with five categorical attributes: Magazine
Promotion (MP), Watch Promotion (WP), Life Insurance Promotion (LIP), Credit Card Insurance (CCI), and Sex (S).
First, we deal with attribute MP. The partition of induced by attribute MP is:
 {{1, 2, 4, 5, 7, 9, 10}, {3, 6, 8}}.
We have:
36 AN INFORMATION-THEORETIC METRIC BASED METHOD FOR SELECTING CLUSTERING ATTRIBUTE
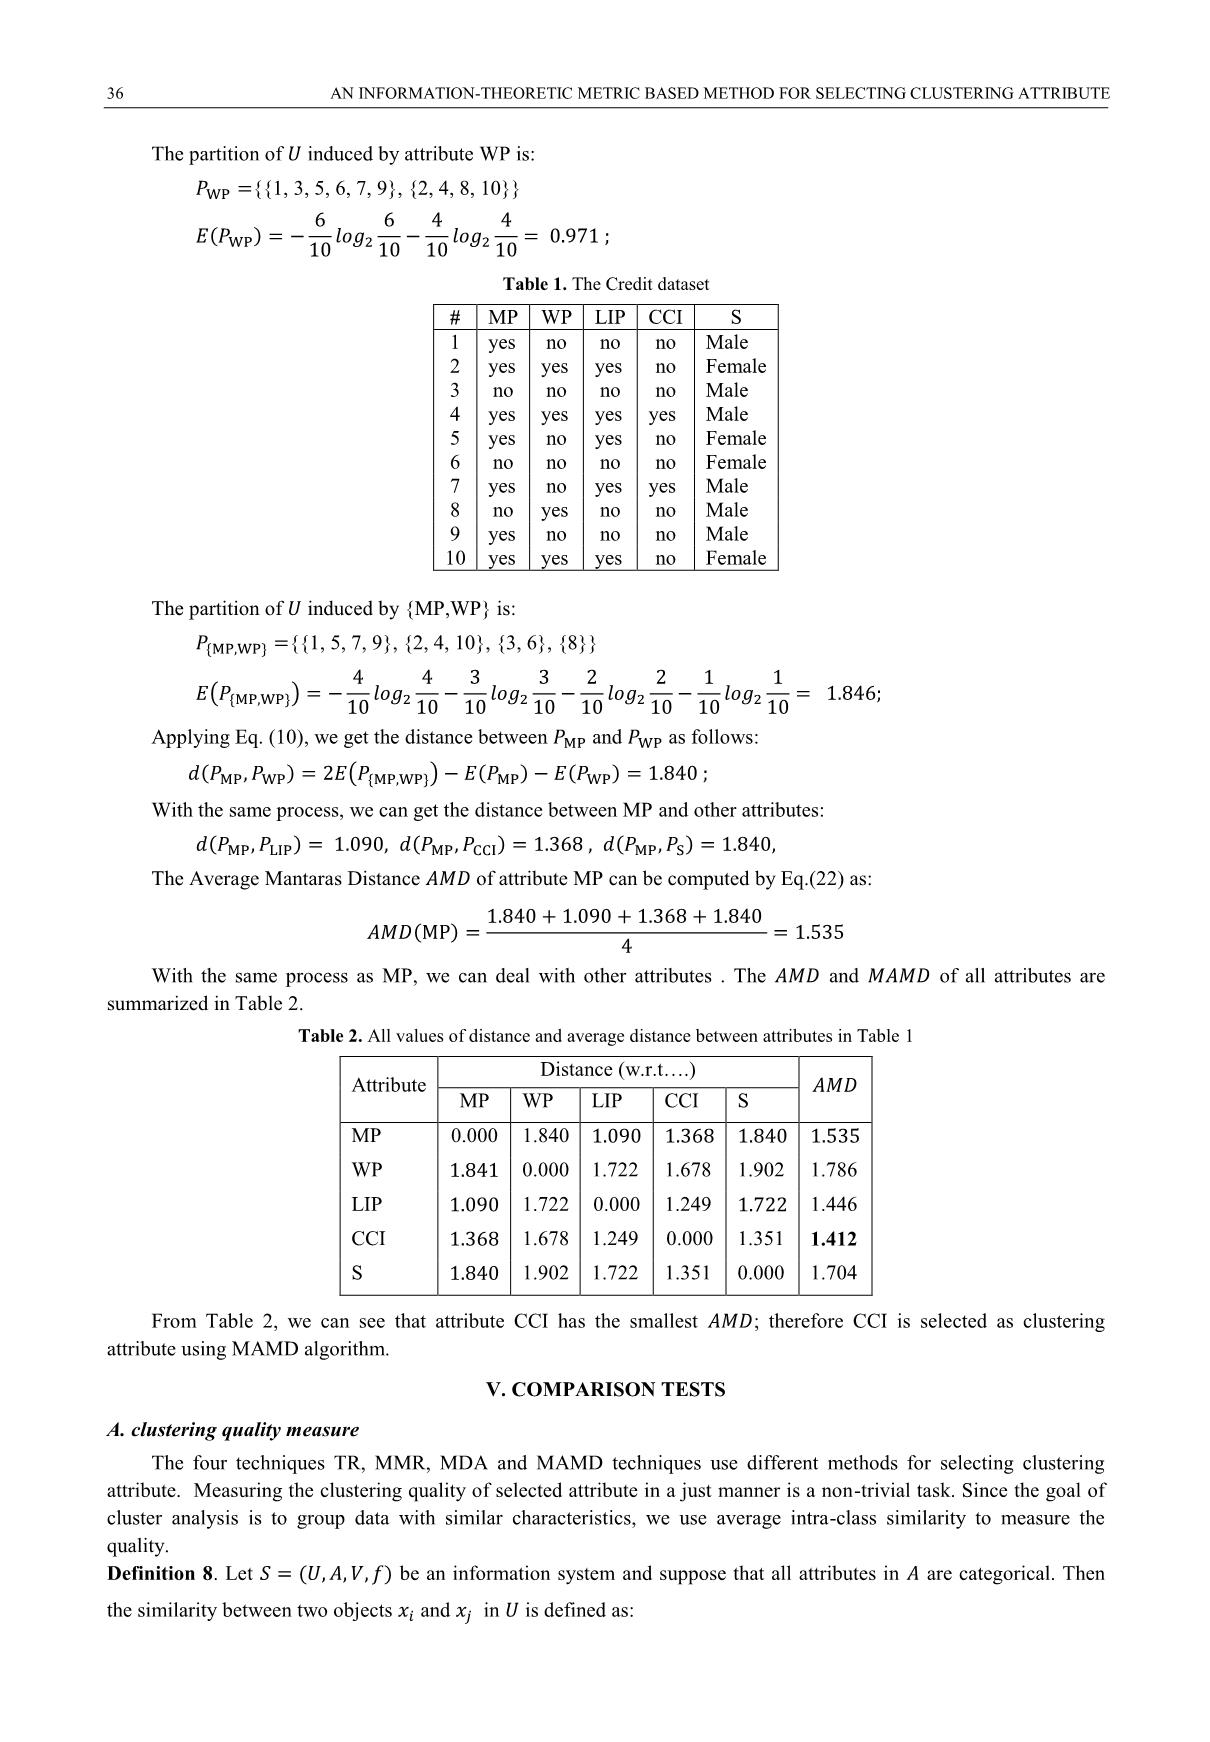
The partition of induced by attribute WP is:
 {{1, 3, 5, 6, 7, 9}, {2, 4, 8, 10}}
Table 1. The Credit dataset
# MP WP LIP CCI S
1 yes no no no Male
2 yes yes yes no Female
3 no no no no Male
4 yes yes yes yes Male
5 yes no yes no Female
6 no no no no Female
7 yes no yes yes Male
8 no yes no no Male
9 yes no no no Male
10 yes yes yes no Female
The partition of induced by {MP,WP} is:
 { } {{1, 5, 7, 9}, {2, 4, 10}, {3, 6}, {8}}
 ( { })
Applying Eq. (10), we get the distance between and as follows:
 ( { })
With the same process, we can get the distance between MP and other attributes:
The Average Mantaras Distance of attribute MP can be computed by Eq.(22) as:
With the same process as MP, we can deal with other attributes . The and of all attributes are
summarized in Table 2.
Table 2. All values of distance and average distance between attributes in Table 1
Attribute
Distance (w.r.t.)
MP WP LIP CCI S
MP 0.000 1.840
WP 0.000 1.722 1.678 1.902 1.786
LIP 1.722 0.000 1.249 1.446
CCI 1.678 1.249 0.000 1.351 1.412
S 1.902 1.722 1.351 0.000 1.704
From Table 2, we can see that attribute CCI has the smallest ; therefore CCI is selected as clustering
attribute using MAMD algorithm.
V. COMPARISON TESTS
A. clustering quality measure
The four techniques TR, MMR, MDA and MAMD techniques use different methods for selecting clustering
attribute. Measuring the clustering quality of selected attribute in a just manner is a non-trivial task. Since the goal of
cluster analysis is to group data with similar characteristics, we use average intra-class similarity to measure the
quality.
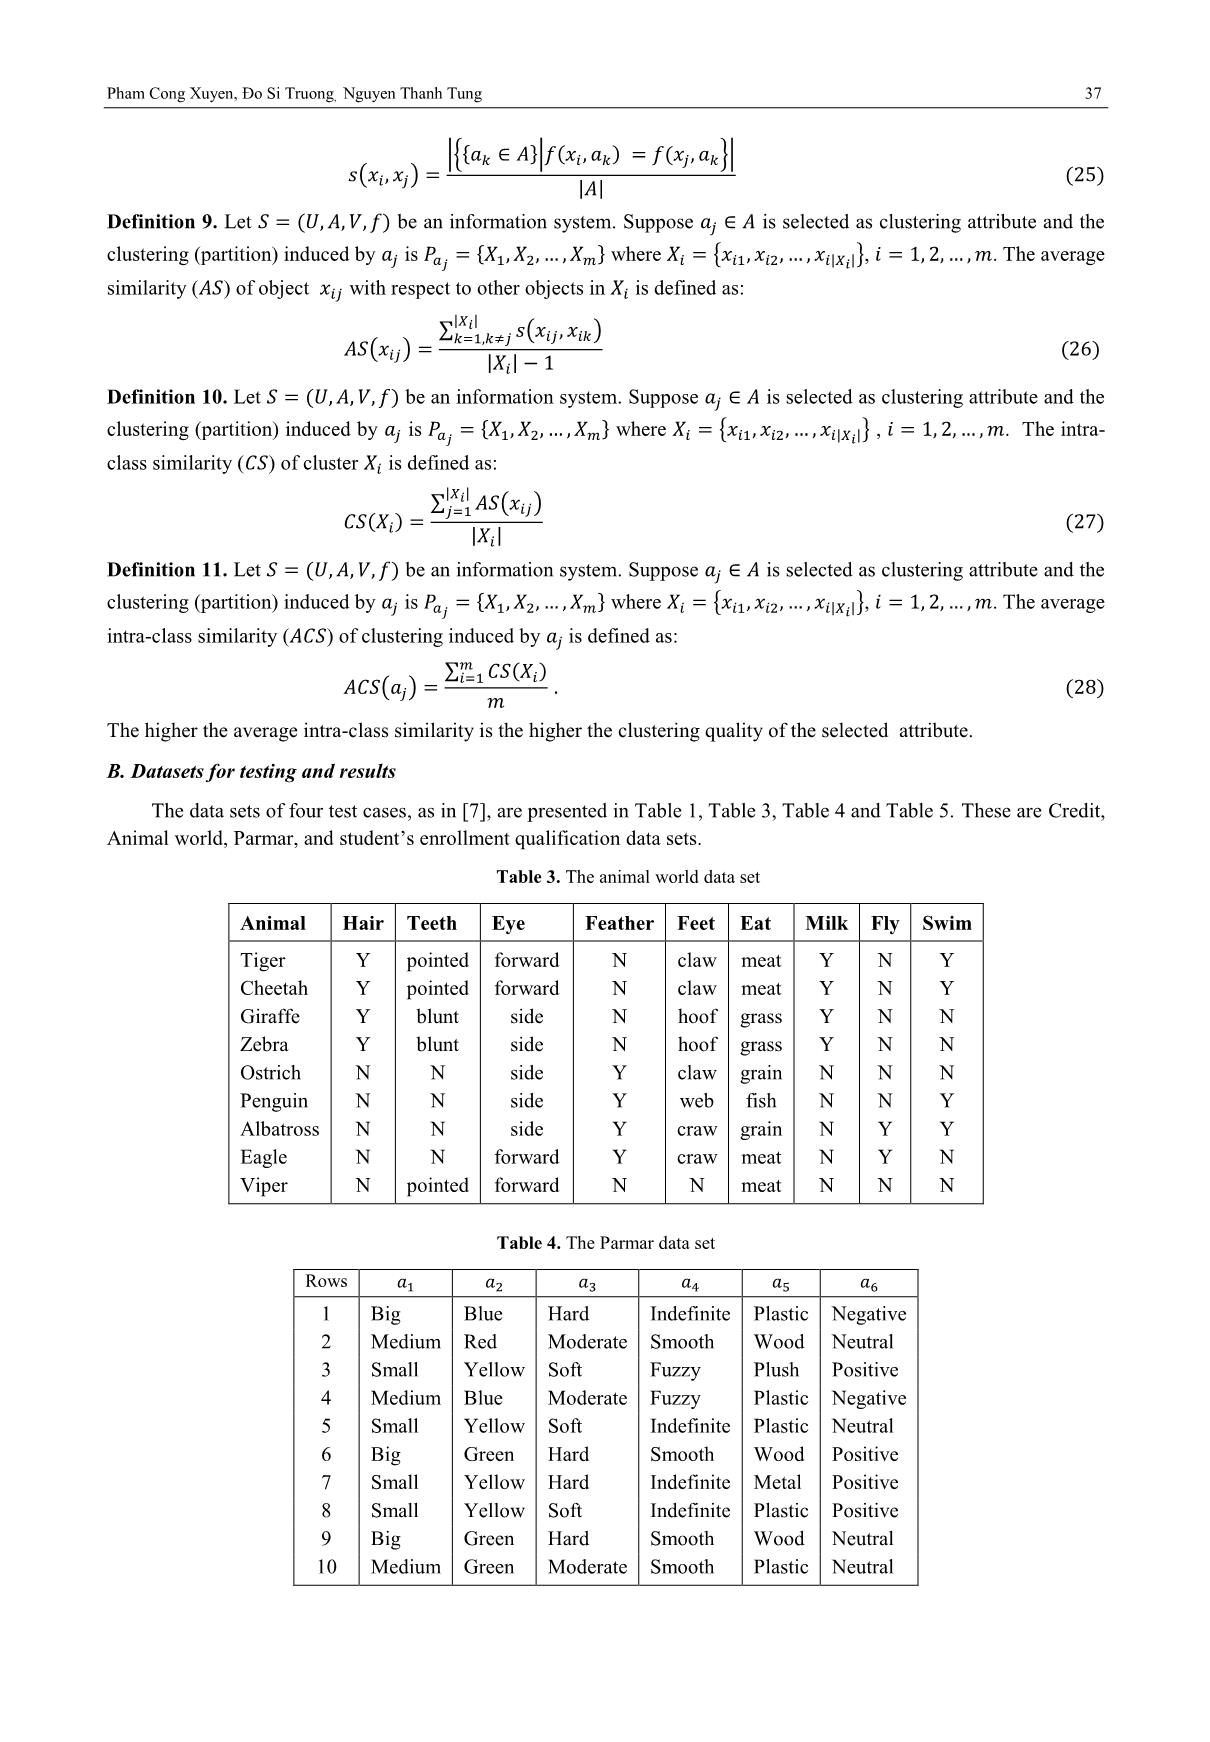
Definition 8. Let be an information system and suppose that all attributes in are categorical. Then
the similarity between two objects and in is defined as:
Pham Cong Xuyen, Đo Si Truong, Nguyen Thanh Tung 37
 ( )
|{{ }| }|
| |
Definition 9. Let be an information system. Suppose is selected as clustering attribute and the
clustering (partition) induced by is { } where { | |}, . The average
similarity ( ) of object with respect to other objects in is defined as:
 ( )
∑ ( )
| |
| |
Definition 10. Let be an information system. Suppose is selected as clustering attribute and the
clustering (partition) induced by is { } where { | |} , . The intra-
class similarity ( ) of cluster is defined as:
∑ ( )
| |
| |
Definition 11. Let be an information system. Suppose is selected as clustering attribute and the
clustering (partition) induced by is { } where { | |}, . The average
intra-class similarity ( ) of clustering induced by is defined as:
 ( )
∑
The higher the average intra-class similarity is the higher the clustering quality of the selected attribute.
B. Datasets for testing and results
The data sets of four test cases, as in [7], are presented in Table 1, Table 3, Table 4 and Table 5. These are Credit,
Animal world, Parmar, and student‟s enrollment qualification data sets.
Table 3. The animal world data set
Animal Hair Teeth Eye Feather Feet Eat Milk Fly Swim
Tiger
Cheetah
Giraffe
Zebra
Ostrich
Penguin
Albatross
Eagle
Viper
Y
Y
Y
Y
N
N
N
N
N
pointed
pointed
blunt
blunt
N
N
N
N
pointed
forward
forward
side
side
side
side
side
forward
forward
N
N
N
N
Y
Y
Y
Y
N
claw
claw
hoof
hoof
claw
web
craw
craw
N
meat
meat
grass
grass
grain
fish
grain
meat
meat
Y
Y
Y
Y
N
N
N
N
N
N
N
N
N
N
N
Y
Y
N
Y
Y
N
N
N
Y
Y
N
N
Table 4. The Parmar data set
Rows
1 Big Blue Hard Indefinite Plastic Negative
2 Medium Red Moderate Smooth Wood Neutral
3 Small Yellow Soft Fuzzy Plush Positive
4 Medium Blue Moderate Fuzzy Plastic Negative
5 Small Yellow Soft Indefinite Plastic Neutral
6 Big Green Hard Smooth Wood Positive
7 Small Yellow Hard Indefinite Metal Positive
8 Small Yellow Soft Indefinite Plastic Positive
9 Big Green Hard Smooth Wood Neutral
10 Medium Green Moderate Smooth Plastic Neutral
38 AN INFORMATION-THEORETIC METRIC BASED METHOD FOR SELECTING CLUSTERING ATTRIBUTE
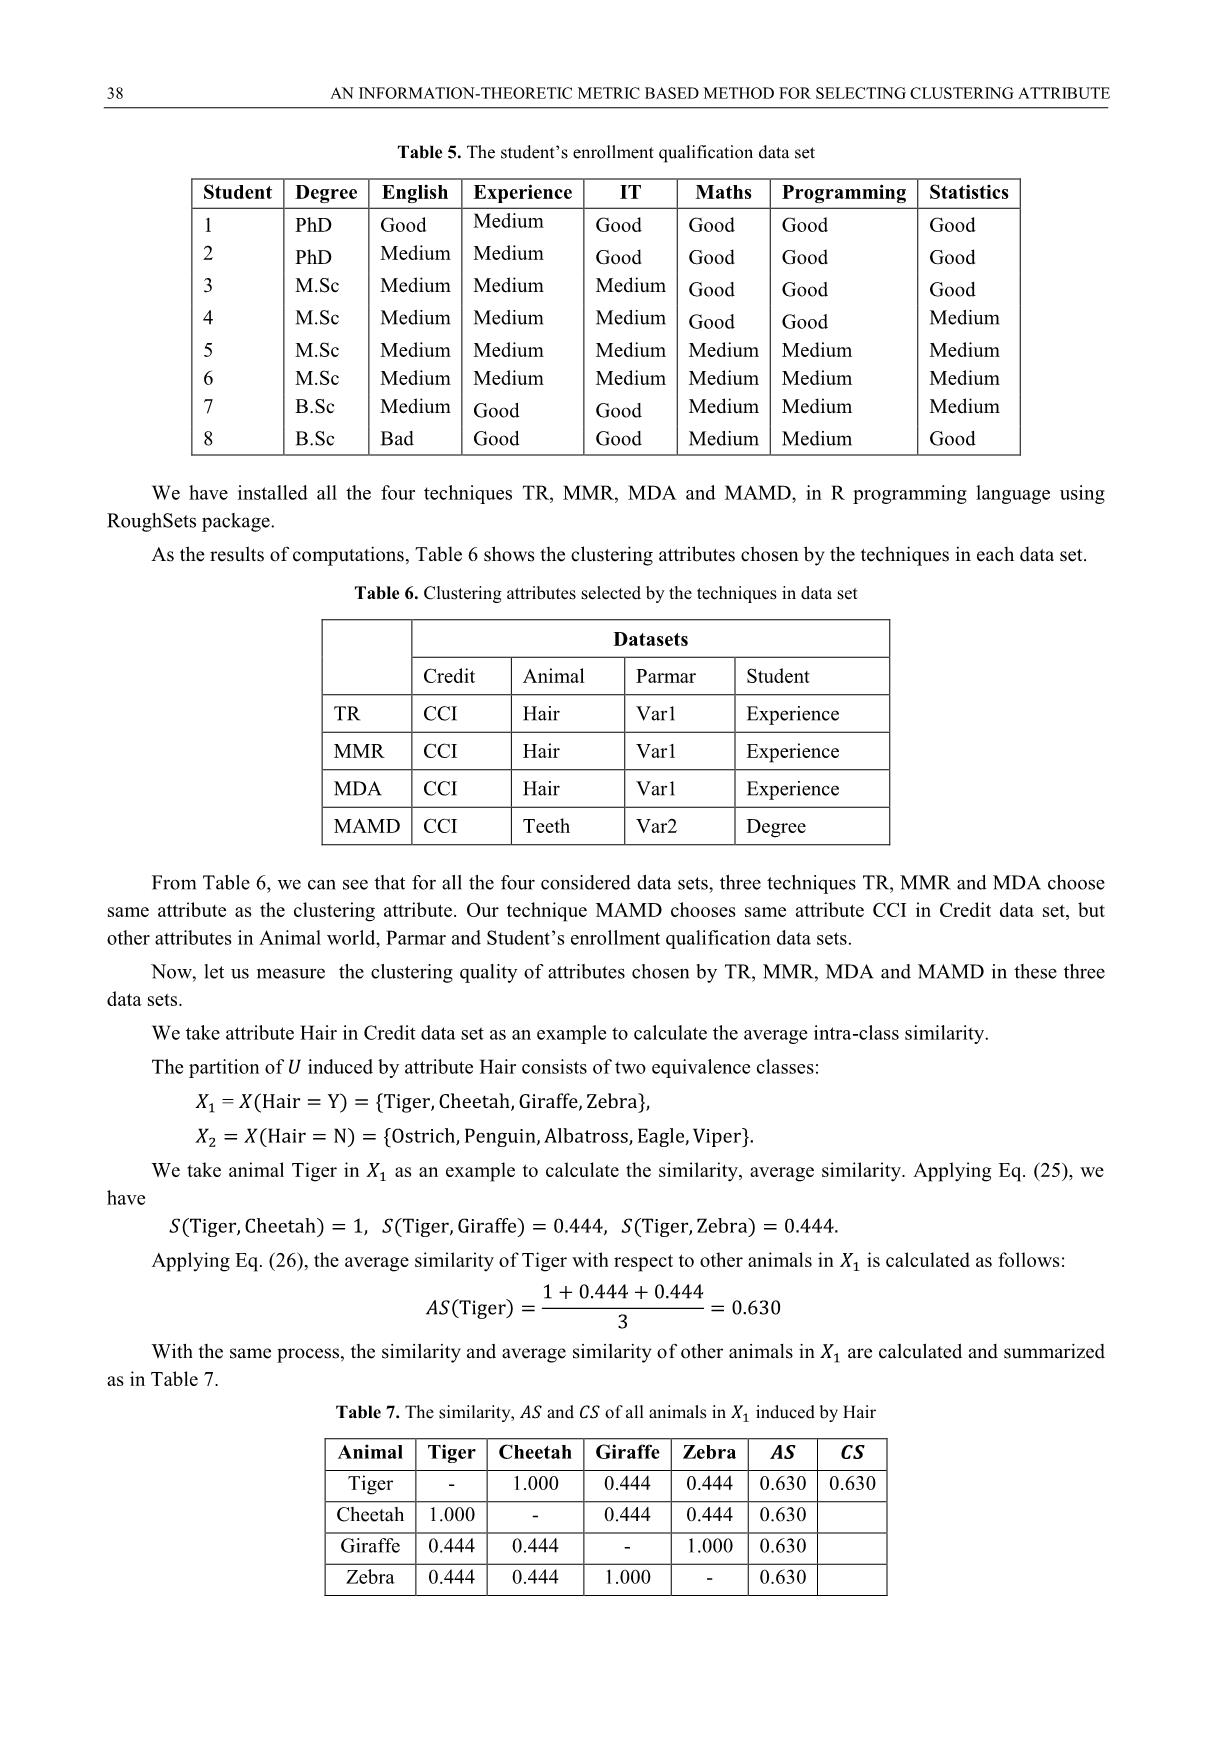
Table 5. The student‟s enrollment qualification data set
Student Degree English Experience IT Maths Programming Statistics
1 PhD Good Medium Good Good Good Good
2 PhD Medium Medium Good Good Good Good
3 M.Sc Medium Medium Medium Good Good Good
4 M.Sc Medium Medium Medium Good Good Medium
5 M.Sc Medium Medium Medium Medium Medium Medium
6 M.Sc Medium Medium Medium Medium Medium Medium
7 B.Sc Medium Good Good Medium Medium Medium
8 B.Sc Bad Good Good Medium Medium Good
We have installed all the four techniques TR, MMR, MDA and MAMD, in R programming language using
RoughSets package.
As the results of computations, Table 6 shows the clustering attributes chosen by the techniques in each data set.
Table 6. Clustering attributes selected by the techniques in data set
 Datasets
Credit Animal Parmar Student
TR CCI Hair Var1 Experience
MMR CCI Hair Var1 Experience
MDA CCI Hair Var1 Experience
MAMD CCI Teeth Var2 Degree
From Table 6, we can see that for all the four considered data sets, three techniques TR, MMR and MDA choose
same attribute as the clustering attribute. Our technique MAMD chooses same attribute CCI in Credit data set, but
other attributes in Animal world, Parmar and Student‟s enrollment qualification data sets.
Now, let us measure the clustering quality of attributes chosen by TR, MMR, MDA and MAMD in these three
data sets.
We take attribute Hair in Credit data set as an example to calculate the average intra-class similarity.
The partition of induced by attribute Hair consists of two equivalence classes:
 = { }
 { }
We take animal Tiger in as an example to calculate the similarity, average similarity. Applying Eq. (25), we
have
Applying Eq. (26), the average similarity of Tiger with respect to other animals in is calculated as follows:
With the same process, the similarity and average similarity of other animals in are calculated and summarized
as in Table 7.
Table 7. The similarity, and of all animals in induced by Hair
Animal Tiger Cheetah Giraffe Zebra
Tiger - 1.000 0.444 0.444 0.630 0.630
Cheetah 1.000 - 0.444 0.444 0.630
Giraffe 0.444 0.444 - 1.000 0.630
Zebra 0.444 0.444 1.000 - 0.630
Pham Cong Xuyen, Đo Si Truong, Nguyen Thanh Tung 39
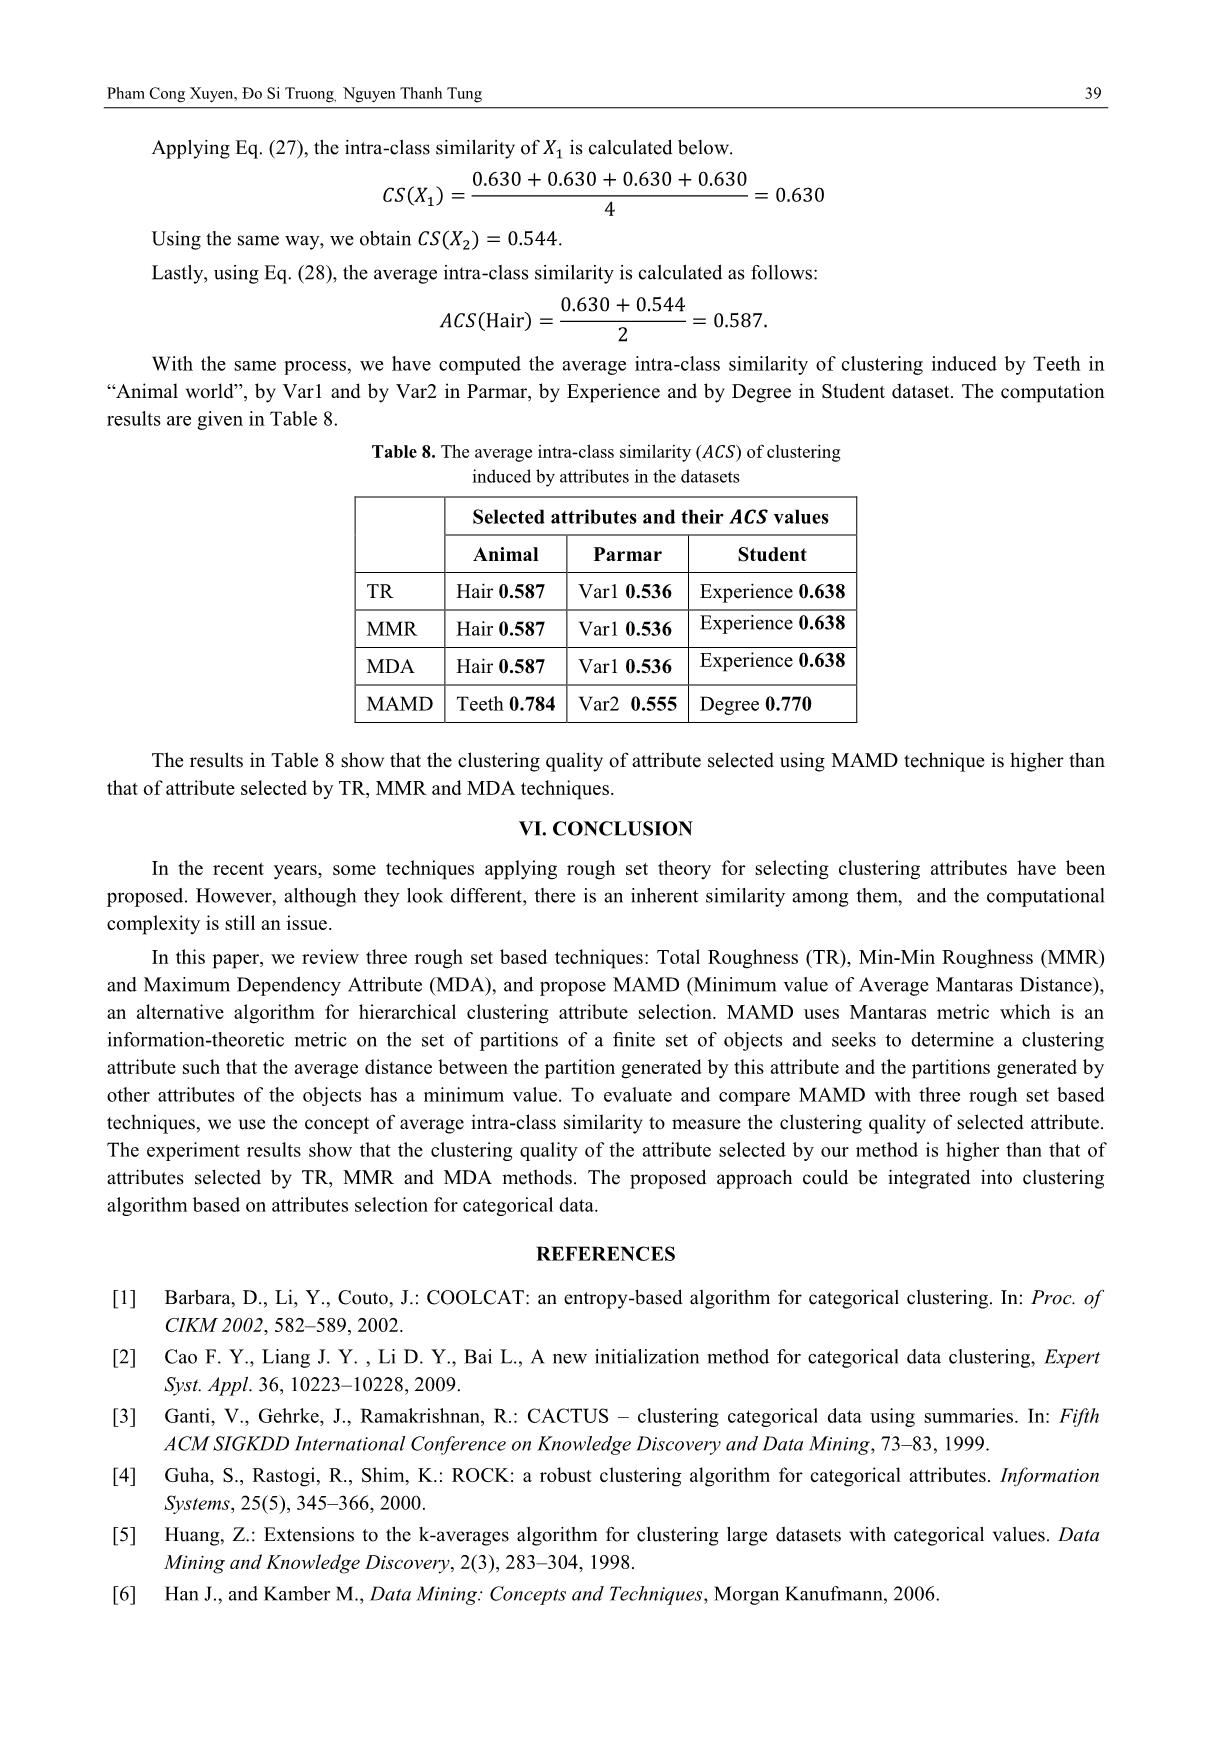
Applying Eq. (27), the intra-class similarity of is calculated below.
Using the same way, we obtain .
Lastly, using Eq. (28), the average intra-class similarity is calculated as follows:
With the same process, we have computed the average intra-class similarity of clustering induced by Teeth in
“Animal world”, by Var1 and by Var2 in Parmar, by Experience and by Degree in Student dataset. The computation
results are given in Table 8.
Table 8. The average intra-class similarity ( ) of clustering
induced by attributes in the datasets
 Selected attributes and their values
Animal Parmar Student
TR Hair 0.587 Var1 0.536 Experience 0.638
MMR Hair 0.587 Var1 0.536 Experience 0.638
MDA Hair 0.587 Var1 0.536 Experience 0.638
MAMD Teeth 0.784 Var2 0.555 Degree 0.770
The results in Table 8 show that the clustering quality of attribute selected using MAMD technique is higher than
that of attribute selected by TR, MMR and MDA techniques.
VI. CONCLUSION
In the recent years, some techniques applying rough set theory for selecting clustering attributes have been
proposed. However, although they look different, there is an inherent similarity among them, and the computational
complexity is still an issue.
In this paper, we review three rough set based techniques: Total Roughness (TR), Min-Min Roughness (MMR)
and Maximum Dependency Attribute (MDA), and propose MAMD (Minimum value of Average Mantaras Distance),
an alternative algorithm for hierarchical clustering attribute selection. MAMD uses Mantaras metric which is an
information-theoretic metric on the set of partitions of a finite set of objects and seeks to determine a clustering
attribute such that the average distance between the partition generated by this attribute and the partitions generated by
other attributes of the objects has a minimum value. To evaluate and compare MAMD with three rough set based
techniques, we use the concept of average intra-class similarity to measure the clustering quality of selected attribute.
The experiment results show that the clustering quality of the attribute selected by our method is higher than that of
attributes selected by TR, MMR and MDA methods. The proposed approach could be integrated into clustering
algorithm based on attributes selection for categorical data.
REFERENCES
[1] Barbara, D., Li, Y., Couto, J.: COOLCAT: an entropy-based algorithm for categorical clustering. In: Proc. of
CIKM 2002, 582–589, 2002.
[2] Cao F. Y., Liang J. Y. , Li D. Y., Bai L., A new initialization method for categorical data clustering, Expert
Syst. Appl. 36, 10223–10228, 2009.
[3] Ganti, V., Gehrke, J., Ramakrishnan, R.: CACTUS – clustering categorical data using summaries. In: Fifth
ACM SIGKDD International Conference on Knowledge Discovery and Data Mining, 73–83, 1999.
[4] Guha, S., Rastogi, R., Shim, K.: ROCK: a robust clustering algorithm for categorical attributes. Information
Systems, 25(5), 345–366, 2000.
[5] Huang, Z.: Extensions to the k-averages algorithm for clustering large datasets with categorical values. Data
Mining and Knowledge Discovery, 2(3), 283–304, 1998.
[6] Han J., and Kamber M., Data Mining: Concepts and Techniques, Morgan Kanufmann, 2006.
40 AN INFORMATION-THEORETIC METRIC BASED METHOD FOR SELECTING CLUSTERING ATTRIBUTE
[7] Herawan, T., Deris, M. M., Abawajy, J. H.: A rough set approach for selecting clustering attribute. Knowledge-
Based Systems 23, 220–231, 2010.
[8] Jain A. K., Data clustering: 50 years beyond k-averages, Pattern Recogn. Lett., 31(8), 651–666, 2010.
[9] Jyoti Dr., Clustering categorical data using rough sets: a review. International Journal of Advanced Research
in IT and Engineering, Vol. 2, No. 12, December, 30-37, 2013.
[10] Lopez de Mantaras R., A Distance-Based Attribute Selection Measure for Decision Tree Induction. Machine
Learning, 6, N
o
 1, 81-92, 1991.
[11] Mazlack, L. J., He, A., Zhu, Y., Coppock, S.: A rough set approach in choosing clustering attributes. In:
Proceedings of the ISCA 13th International Conference (CAINE 2000), 1–6, 2000.
[12] Parmar, D., Wu, T., Blackhurst, J.: MMR: an algorithm for clustering categorical data using rough set theory.
Data and Knowledge Engineering, 63, 879–893, 2007.
[13] Pawlak, Z.: Rough sets. International Journal of Computer and Information Science, 11, 341–356, 1982.
[14] Suchita S. Mesakar, M. S. Chaudhari, Review Paper On Data Clustering Of Categorical Data. International
Journal of Engineering Research & Technology, Vol. 1 Issue 10, December, 2012.
MỘT PHƯƠNG PHÁP LỰA CHỌN THUỘC TÍNH GOM CỤM
SỬ DỤNG METRIC LÝ THUYẾT THÔNG TIN
Phạm Công Xuyên, Đỗ Sĩ Trường, Nguyễn Thanh Tùng
TÓM TẮT — Bài toán gom cụm dữ liệu xuất hiện trong nhiều lĩnh vực khác nhau như Khai thác dữ liệu, Nhận dạng, Tin-sinh học,
vv. Mục tiêu cơ bản của gom cụm là nhóm đối tượng thành các cụm sao cho các đối tượng trong cùng một cụm thì tương tự như
nhau hơn là các đối tượng từ các cụm khác nhau. Gần đây, nhiều nhà nghiên cứu quan tâm đến vấn đề gom cụm dữ liệu phạm trù
(categorical), trong đó các đối tượng dữ liệu được mô tả bởi các thuộc tính không phải thuộc tính số. Đặc biệt, phương pháp tiếp
cận sử dụng lý thuyết tập thô trong gom cụm phân cấp (hierarchical) dữ liệu phạm trù đã thu hút nhiều sự chú ý. Chìa khóa của các
phương pháp này là làm thế nào để chọn được một thuộc gom cụm tốt nhất tại mỗi thời điểm trong số nhiều thuộc tính ứng viên.
Trong bài báo này, chúng tôi xem xét ba kỹ thuật dựa trên lý thuyết tập thô: Total Roughness (TR), Min-Min Roughness (MMR) và
Maximum Dependency Attribute (MDA), và đề xuất MAMD (Minimum value of Average Mantaras Distance), một thuật toán mới
cho việc lựa chọn thuộc tính phân cụm theo tiếp cận phân cấp. MAMD sử dụng metric Mantaras, một metric lý thuyết thông tin trên
tập các phân hoạch của một tập hợp gồm hữu hạn các đối tượng và tìm cách xác định thuộc tính gom cụm sao cho khoảng cách
trung bình giữa phân hoạch sinh ra bởi thuộc tính này và các phân hoạch sinh ra bởi các thuộc tính khác đạt giá trị nhỏ nhất. Để
đánh giá và so sánh MAMD với ba kỹ thuật dựa trên lý thuyết tập thô, chúng tôi sử dụng khái niệm “Độ tương tự trung bình bên
trong cụm” của một phép gom cụm để đo lường chất lượng gom cụm của thuộc tính được chọn. Kết quả thực nghiệm cho thấy chất
lượng gom cụm của thuộc tính chọn được bằng phương pháp của chúng tôi là cao hơn so với các thuộc tính chọn bởi các phương
pháp TR, MMR và MDA. Do đó, MAMD có thể được sử dụng như là một kỹ thuật hiệu quả lựa chọn thuộc tính trong phân cụm
phân cấp.
Từ khóa — Gom cụm, Lý thuyết tập thô, Lựa chọn thuộc tính, Mantaras metric, Gom cụm phân cấp.
File đính kèm:
 an_information_theoretic_metric_based_method_for_selecting_c.pdf

