An efficient graph modeling approach for storing and analyzing heterogeneous IoT data
Abstract: In an Internet of Thing (IoT) environment, entities with different attributes and capacities are going to be connected in a highly connected fashion. Specifically, not only the mechanical and electronic devices but also other entities such as people, locations, and applications are connected to each other. Most IoT applications must work with dynamic and speedily changing systems due to new entities are coming online and/or the connection between these entities can change regularly. This requires a data model that enables to easily represent the entities and support adding, deleting, and updating relations between entities without impacting application availability. Fortunately, graph databases are purposely-Built to store highly connected data with nodes representing entities and edges representing relationships between these entities. In this paper, we propose a general graph model that can be used to design graph databases in order to support effectively storing and analyzing IoT data. We represent IoT data based on a graph model and consider smart building data management as a case study. Through the analysis and comparison of experimental results in various aspects, we find that our graph modeling approach is applicable for storing and analyzing the IoT connected data

Trang 1
Trang 2
Trang 3
Trang 4
Trang 5
Trang 6
Trang 7
Tóm tắt nội dung tài liệu: An efficient graph modeling approach for storing and analyzing heterogeneous IoT data
management as a case study.
3.1. A Graph-based View on IoT Data
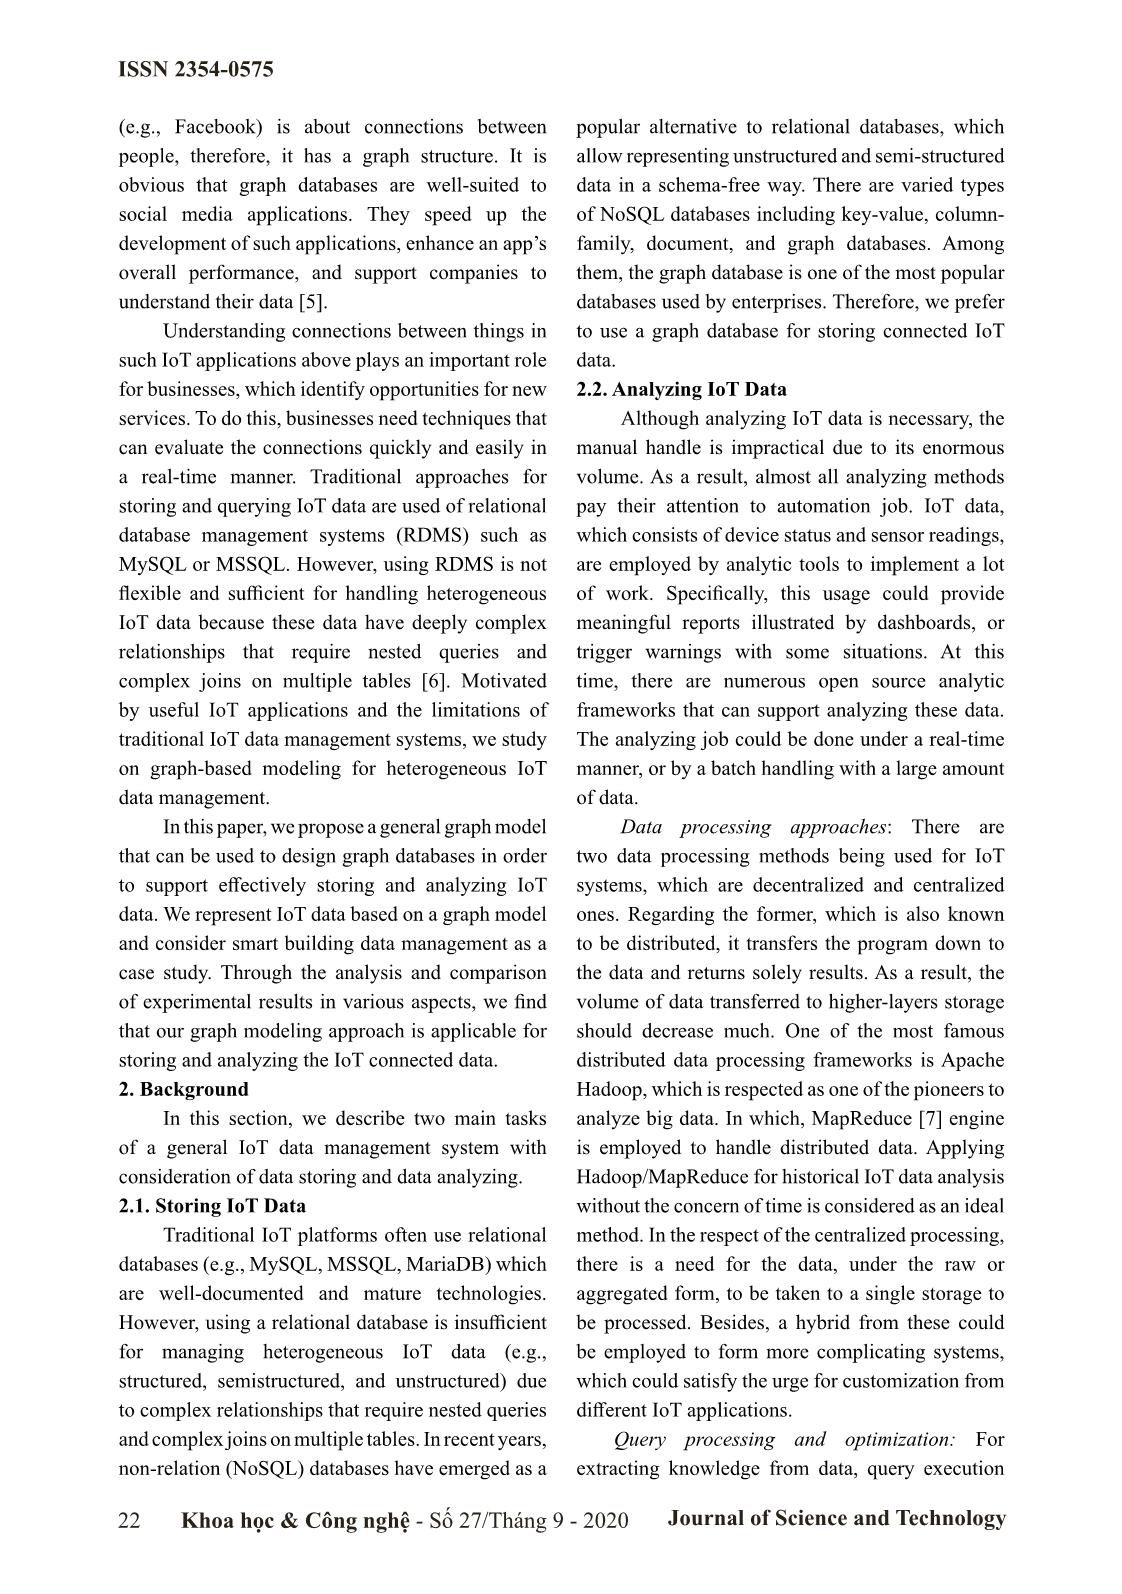
A conceptual view of IoT data could be
represented as in Figure 1. That is fused by a social
graph, a spatial graph, and a things graph into one
graph model, and incorporates the relationships
among them. The graph components are explained
in more detail as follows.
Figure 1. A conceptual view of IoT Graph Data
a) Things Graph
This graph represents entities including
sensors and devices and their connectivity. Each
node represents a sensor or a device with different
attributes such as SensorID, Name, Type, Position,
Status, Timestamp, and Value. An edge represents
the relationship between two sensors/devices, and
two types of edge-label are used in things graph
including Connects and Links.
b) Spatial Graph
This graph represents locations and their
proximity. Each node is a place with attributes such
as LocationID, PlaceName, and Coordinates. Each
edge indicates the proximity between two locations.
Besides, a node in the Spatial Graph could be
connected by nodes in the Things Graph, which
indicates that some sensors/devices are employed at
certain locations. This relation between a thing and
a location is represented by using AsignedTo type
edge. Also, a node in the Spatial Graph could be
connected by another node from the Social Graph
to show who is in a specific location. There are
four edge types to represent these kinds of relations
including WorksAt, WorksFor, StudiesAt, and
LivesAt.
c) Social Graph
This graph represents people who are using
IoT devices and their relationship. Each node is
a person with some attributes such as ID, Name,
Age, and Title. An edge represents the relationship
between two people. Furthermore, a node of Social
Graph could be connected to a node from Spatial
Graph to show where a person is and connected to
a node from Things Graph to indicate which things
are used by a person.
3.2. IoT Graph Data Modeling
Graph data modeling is the translation of
a dataset in a conceptual view to a graph model.
During the graph modeling process, we determine
which entities in the dataset should be nodes (or
vertex), which should be edges, and which should be
properties. The result is a blueprint of whole entities,
relationships, and properties in the dataset. We can
use that blueprint to create a visualization model.
In fact, an entity or a relationship could have
several properties. For instance, a person is identified
by his/her national ID, first name, last name, birth
of date, and he/she might have a relationship as
a colleague with another person since 2019. For
representing data in detail and rich information, a
comprehensive graph model is introduced which is
named a property graph. The property graph is first
introduced in [9], and a formal definition is given
by Angles et al. in [10]. In the later one, a property
graph is defined as a tuple (V, E, ρ, λ, δ), where V is
a set of nodes and E is a set of edges in the graph,
ISSN 2354-0575
Journal of Science and Technology24 Khoa học & Công nghệ - Số 27/Tháng 9 - 2020
ρ is a total function E → V × V, λ is a total function
that defines labels on both V and E, δ is a partial
function that maps a property of a node or an edge
to a value. We present an extension of the property
graph to support data modeling to be easy and more
clear.
Property Graph. A property graph is a tuple G =
(V, E, Σ, Θ, F, λ, P, ϑ, ϱ), where:
• V: is a finite set of nodes (vertices)
• E: is a finite set of edges
• Σ: is a finite set of labels for edges
• Θ: is a finite set of labels for nodes
• F: is the function mapping each node v ∈ V to a
label from Θ.
• λ: is the function mapping each edge e ∈ E to a
label from Σ.
• P: is a finite set of property names for vertices/edges
• ϑ: is the function mapping each node v ∈ V with a
given property p ∈ P to a specific value.
• ϱ: is the function mapping each edge e ∈ E with a
given property p ∈ P to a specific value.
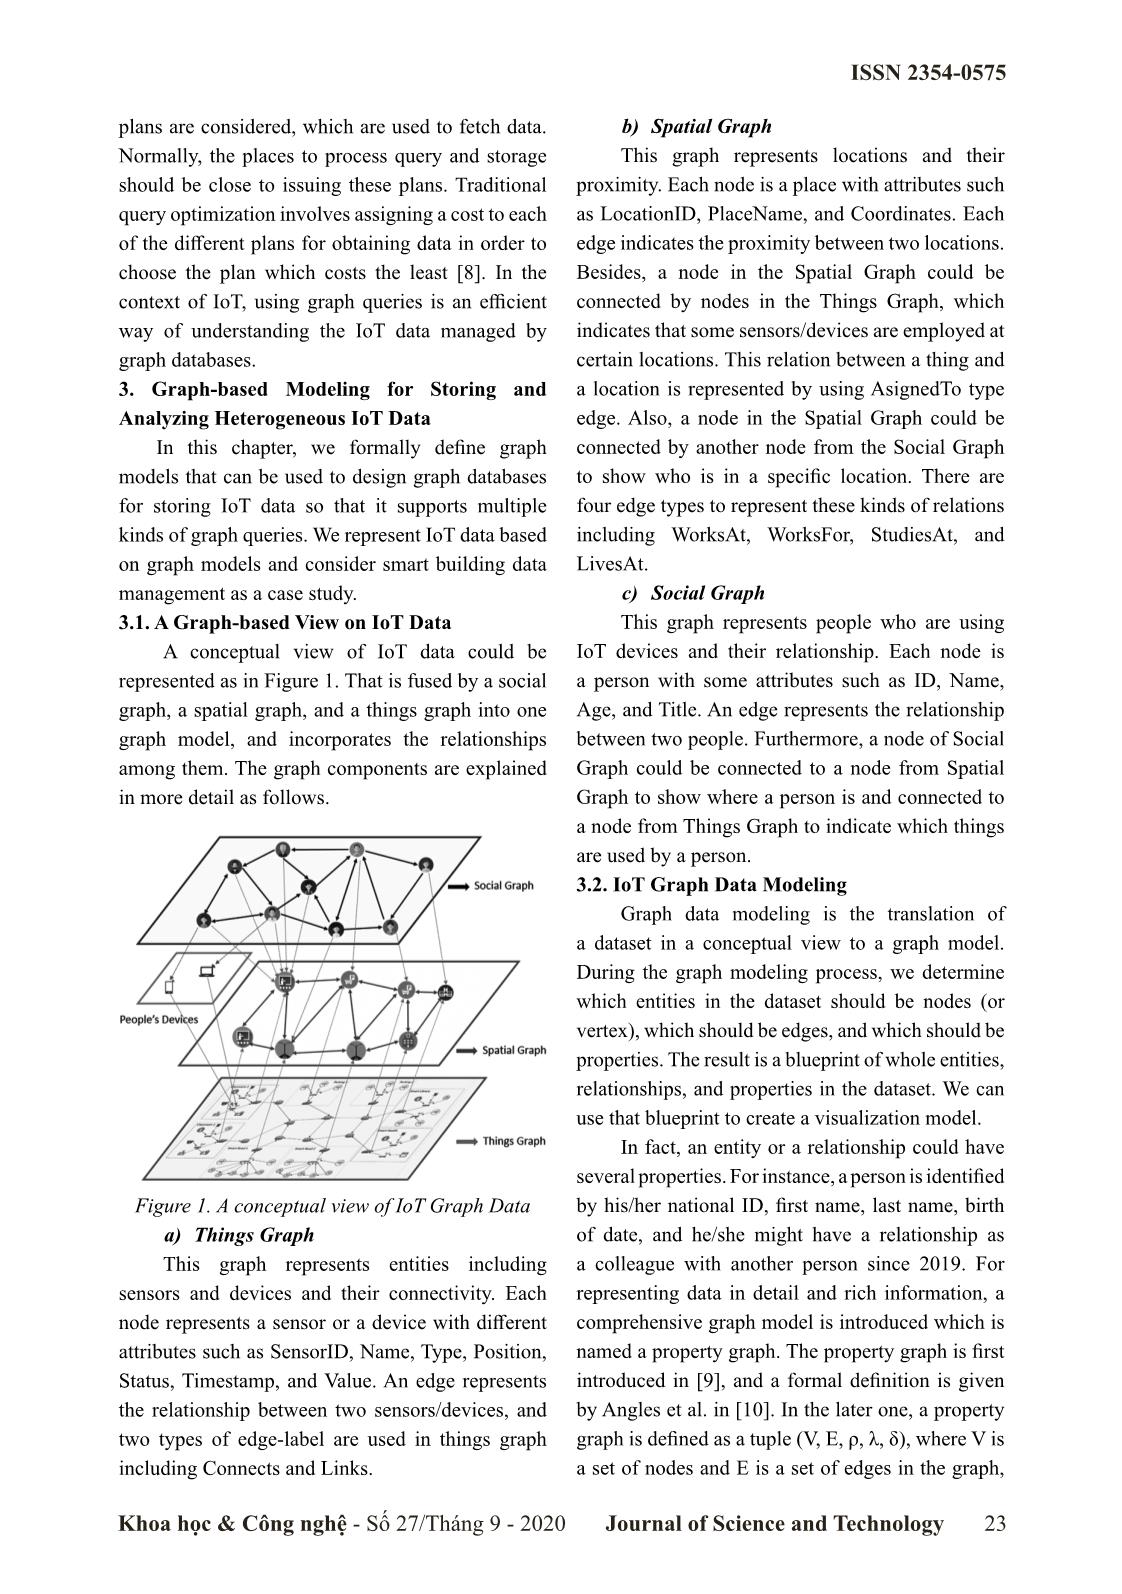
Figure 2. An example of IoT graph data modeling
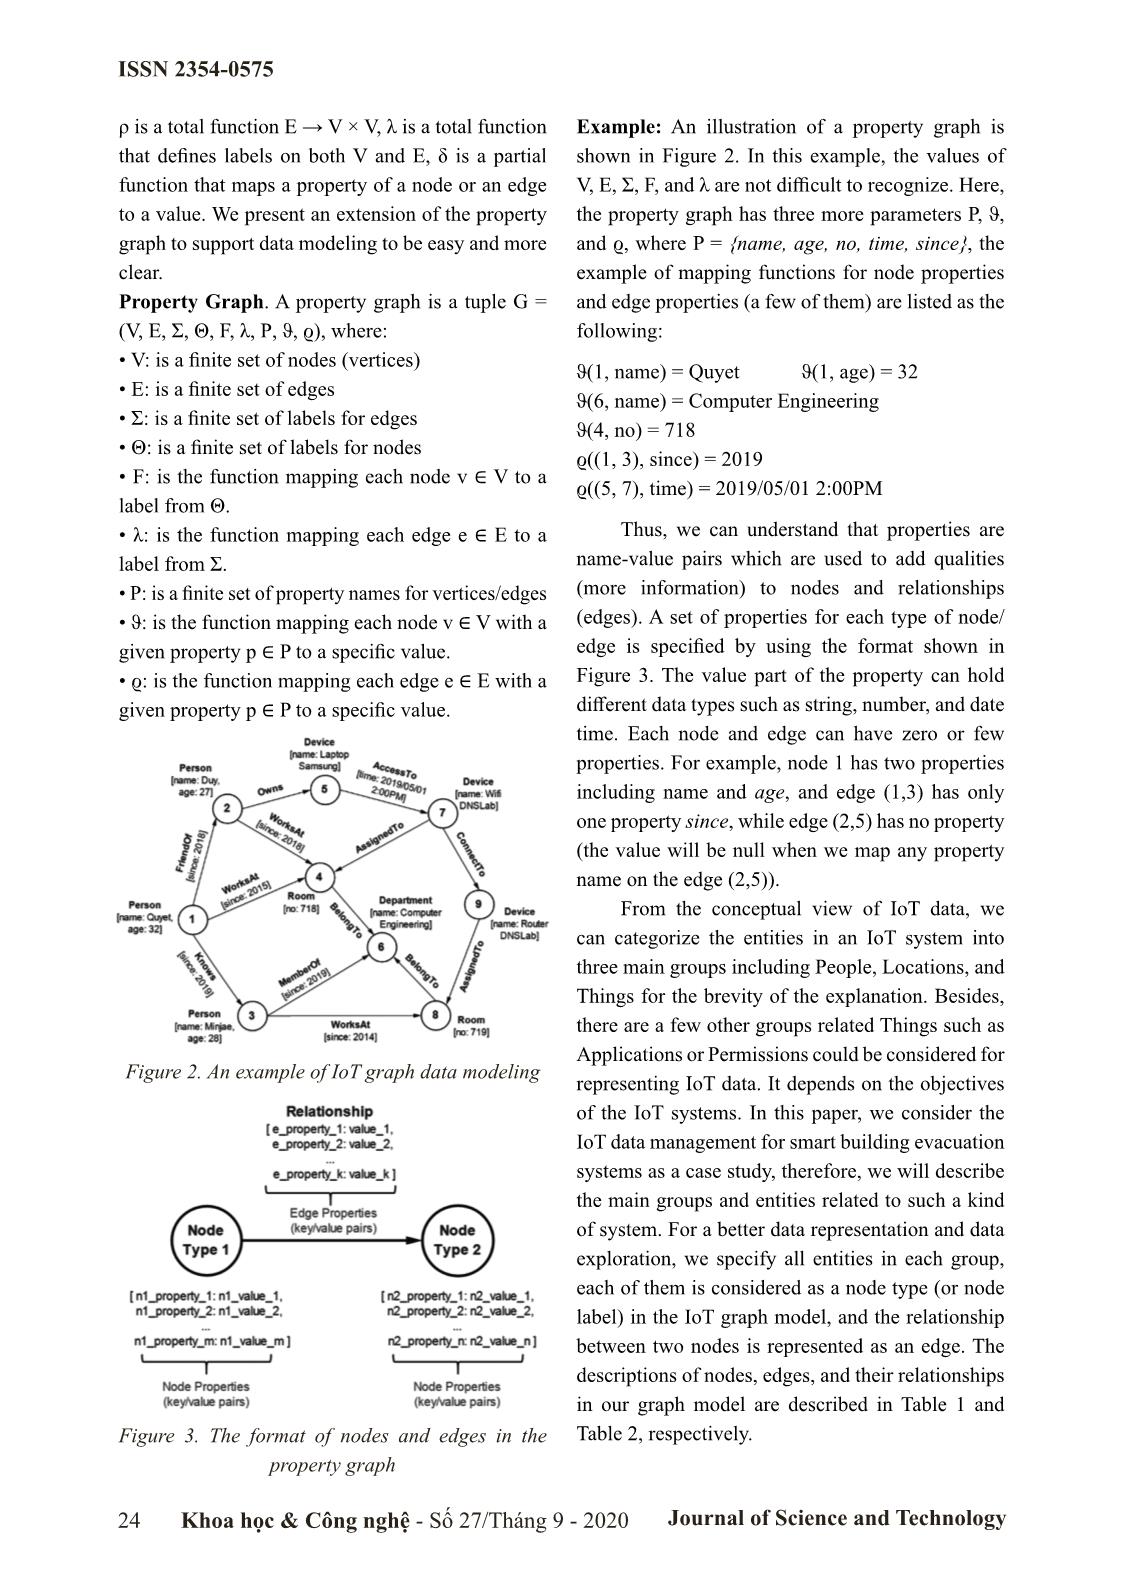
Figure 3. The format of nodes and edges in the
property graph
Example: An illustration of a property graph is
shown in Figure 2. In this example, the values of
V, E, Σ, F, and λ are not difficult to recognize. Here,
the property graph has three more parameters P, ϑ,
and ϱ, where P = {name, age, no, time, since}, the
example of mapping functions for node properties
and edge properties (a few of them) are listed as the
following:
ϑ(1, name) = Quyet ϑ(1, age) = 32
ϑ(6, name) = Computer Engineering
ϑ(4, no) = 718
ϱ((1, 3), since) = 2019
ϱ((5, 7), time) = 2019/05/01 2:00PM
Thus, we can understand that properties are
name-value pairs which are used to add qualities
(more information) to nodes and relationships
(edges). A set of properties for each type of node/
edge is specified by using the format shown in
Figure 3. The value part of the property can hold
different data types such as string, number, and date
time. Each node and edge can have zero or few
properties. For example, node 1 has two properties
including name and age, and edge (1,3) has only
one property since, while edge (2,5) has no property
(the value will be null when we map any property
name on the edge (2,5)).
From the conceptual view of IoT data, we
can categorize the entities in an IoT system into
three main groups including People, Locations, and
Things for the brevity of the explanation. Besides,
there are a few other groups related Things such as
Applications or Permissions could be considered for
representing IoT data. It depends on the objectives
of the IoT systems. In this paper, we consider the
IoT data management for smart building evacuation
systems as a case study, therefore, we will describe
the main groups and entities related to such a kind
of system. For a better data representation and data
exploration, we specify all entities in each group,
each of them is considered as a node type (or node
label) in the IoT graph model, and the relationship
between two nodes is represented as an edge. The
descriptions of nodes, edges, and their relationships
in our graph model are described in Table 1 and
Table 2, respectively.
ISSN 2354-0575
Khoa học & Công nghệ - Số 27/Tháng 9 - 2020 Journal of Science and Technology 25
Table 1. Node Types Description
Table 2. Edge Types Description
4. Experimental Evaluation
Exp-1: Analysis of IoT Graph Data
In this experiment, we analyze the graph
characteristics with the changes in heterogeneous
IoT data. To do this, we first generate a graph
database by using gMark [11]. This graph follows
the model that we presented in the previous section.
It has 36,000 nodes, 273,610 edges, and 19 edge-
labels. The occurrence of labels follows the given
Zipfian or uniform distribution. We then extract
from the graph to obtain other six smaller graphs
which contain only one or two kinds of graph from
things, social, and spatial graphs. Finally, we use
Gephi [12] to analyze the changes of parameters
of these graphs. Specifically, we consider the
following graph parameters:
• Graph size: the number of nodes (|V|) and
edges (|E|).
• Number of relationships (|L|): the number of
different labels in the graphs.
• Average degree: in a directed graph, it is
defined as the fraction of the number of edges to the
number of nodes.
• Average path length: the average number of
steps along the shortest paths for all possible pairs
of nodes.
• Diameter (D): the number of edges in the
shortest path between the most distant nodes.
• Strongly connected components (|C|): the
maximal strongly connected subgraph, in which, a
subgraph is called a strongly connected component
if there is a path between all pairs of nodes.
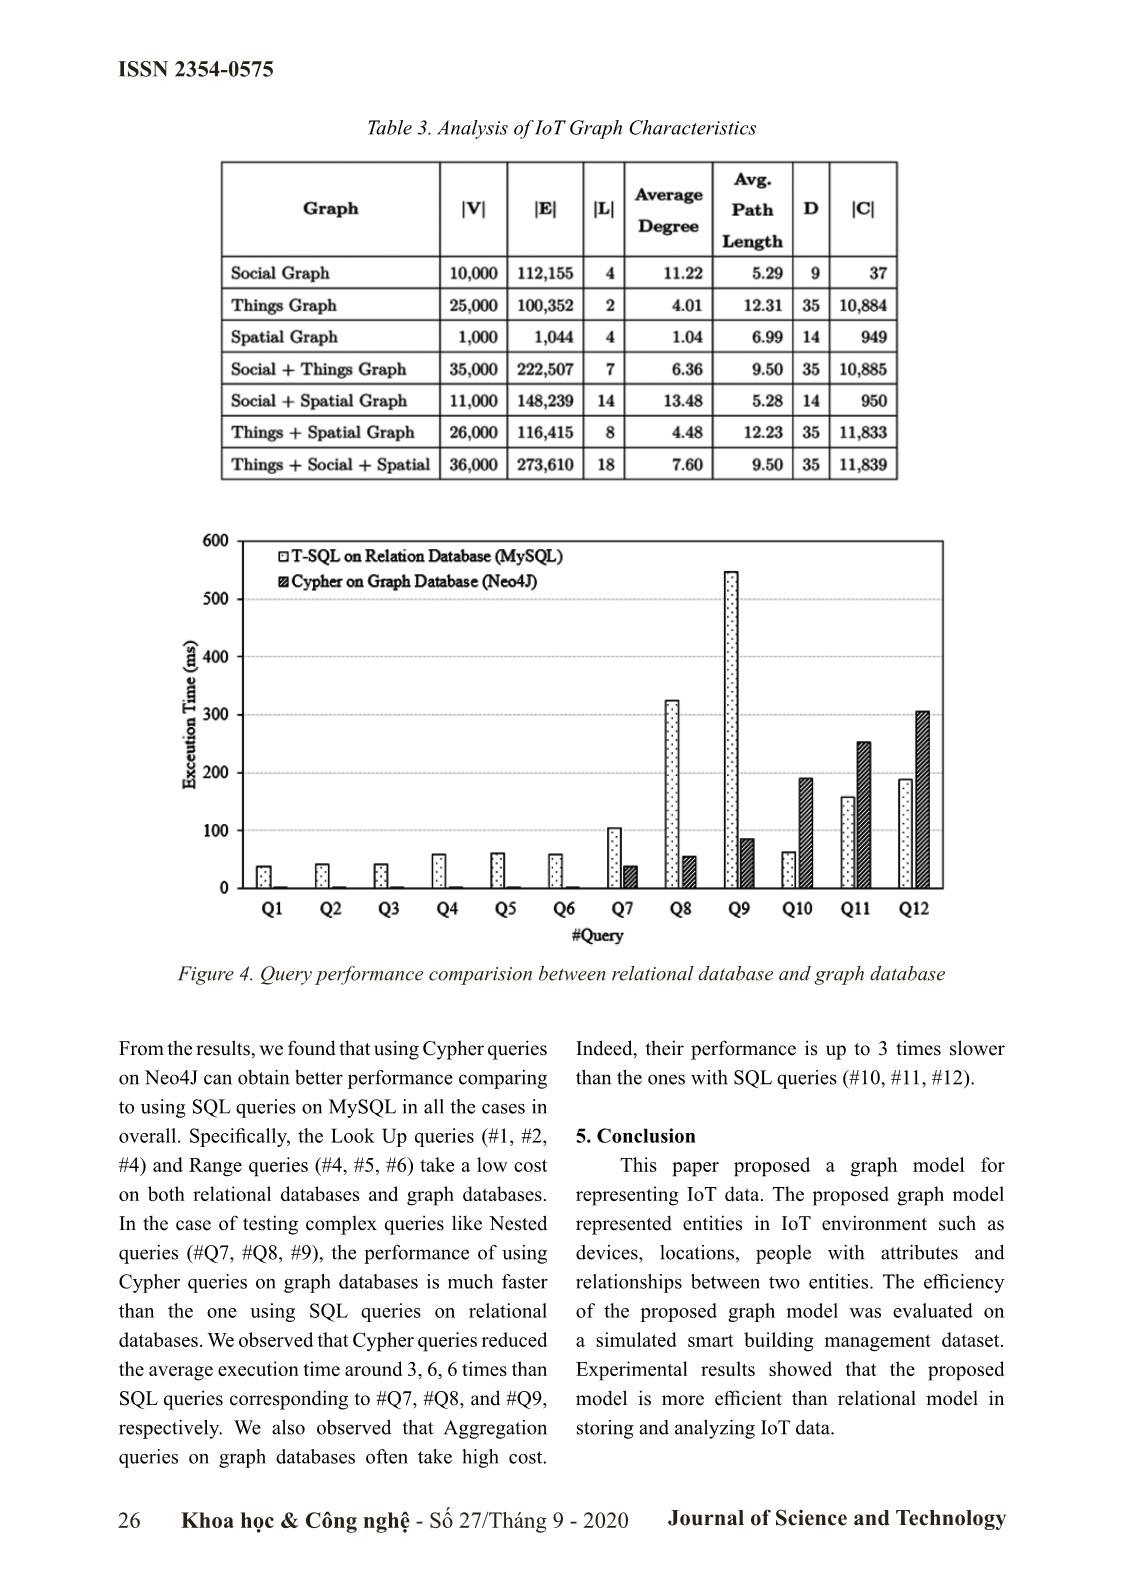
Table 3 illustrates the results of analyzing
graph parameters. We observe that when different
graphs are fused together, it could generate a more
complex graph with the increase of the number of
relationships, the average degree, the average path
length, and the value of other parameters. This
causes substantial searching cost and long response
time due to the large size of the graph and/or
complex queries.
Exp-2: Evaluation of Query Performance
We evaluate the efficiency of analyzing IoT
data using graph query. To do this, we compare the
query performance between T-SQL queries on a
relational database and Cypher queries on a graph
database. We use the IoT dataset generated in Exp-
1. We convert and import this dataset into 14 tables
in MySQL with 256,318 records. The dataset is also
imported to a graph database, Neo4j, with 36,000
nodes and 273,610 edges.
In this experiment, we use four common types
of query including Look Up, Range, Complex
(Join/Nested), and Aggregation, which are often
used to extract knowledge from IoT data We write
twelve queries, each type of query has three queries.
The queries are written in both SQL language for
running on MySQL and Cypher language for
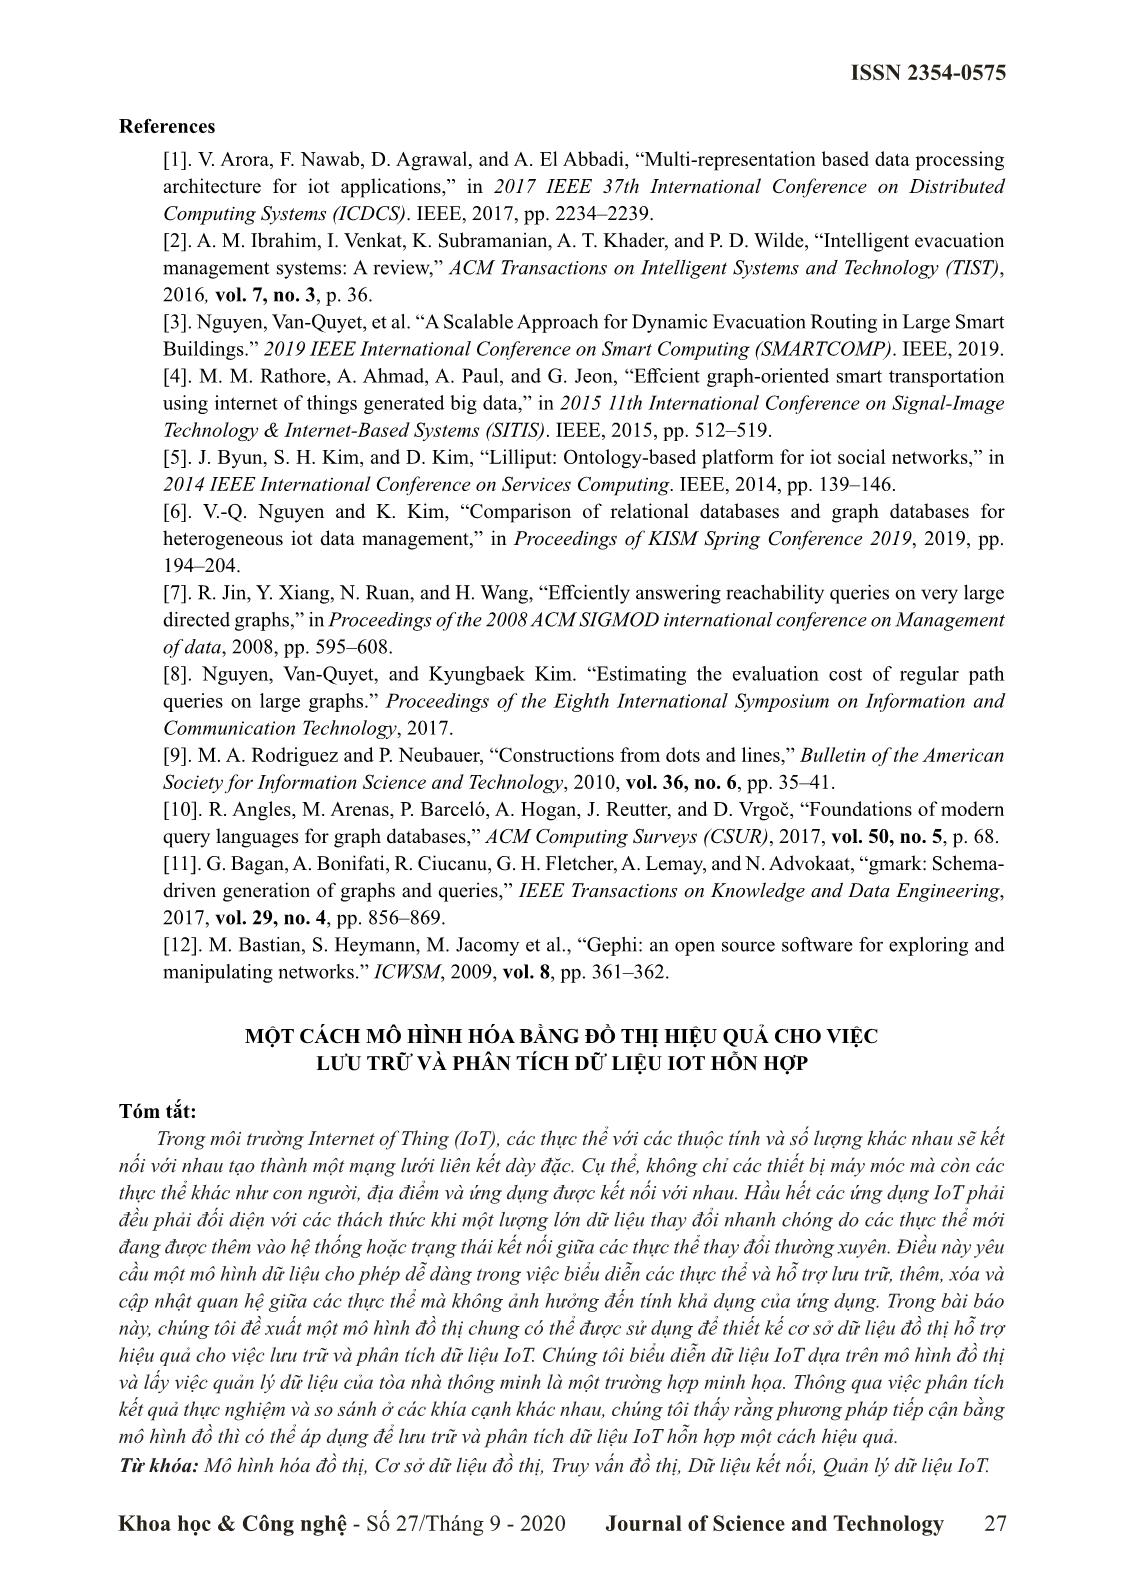
running on Neo4J. The experimental results are
illustrated in Figure 4.
ISSN 2354-0575
Journal of Science and Technology26 Khoa học & Công nghệ - Số 27/Tháng 9 - 2020
Table 3. Analysis of IoT Graph Characteristics
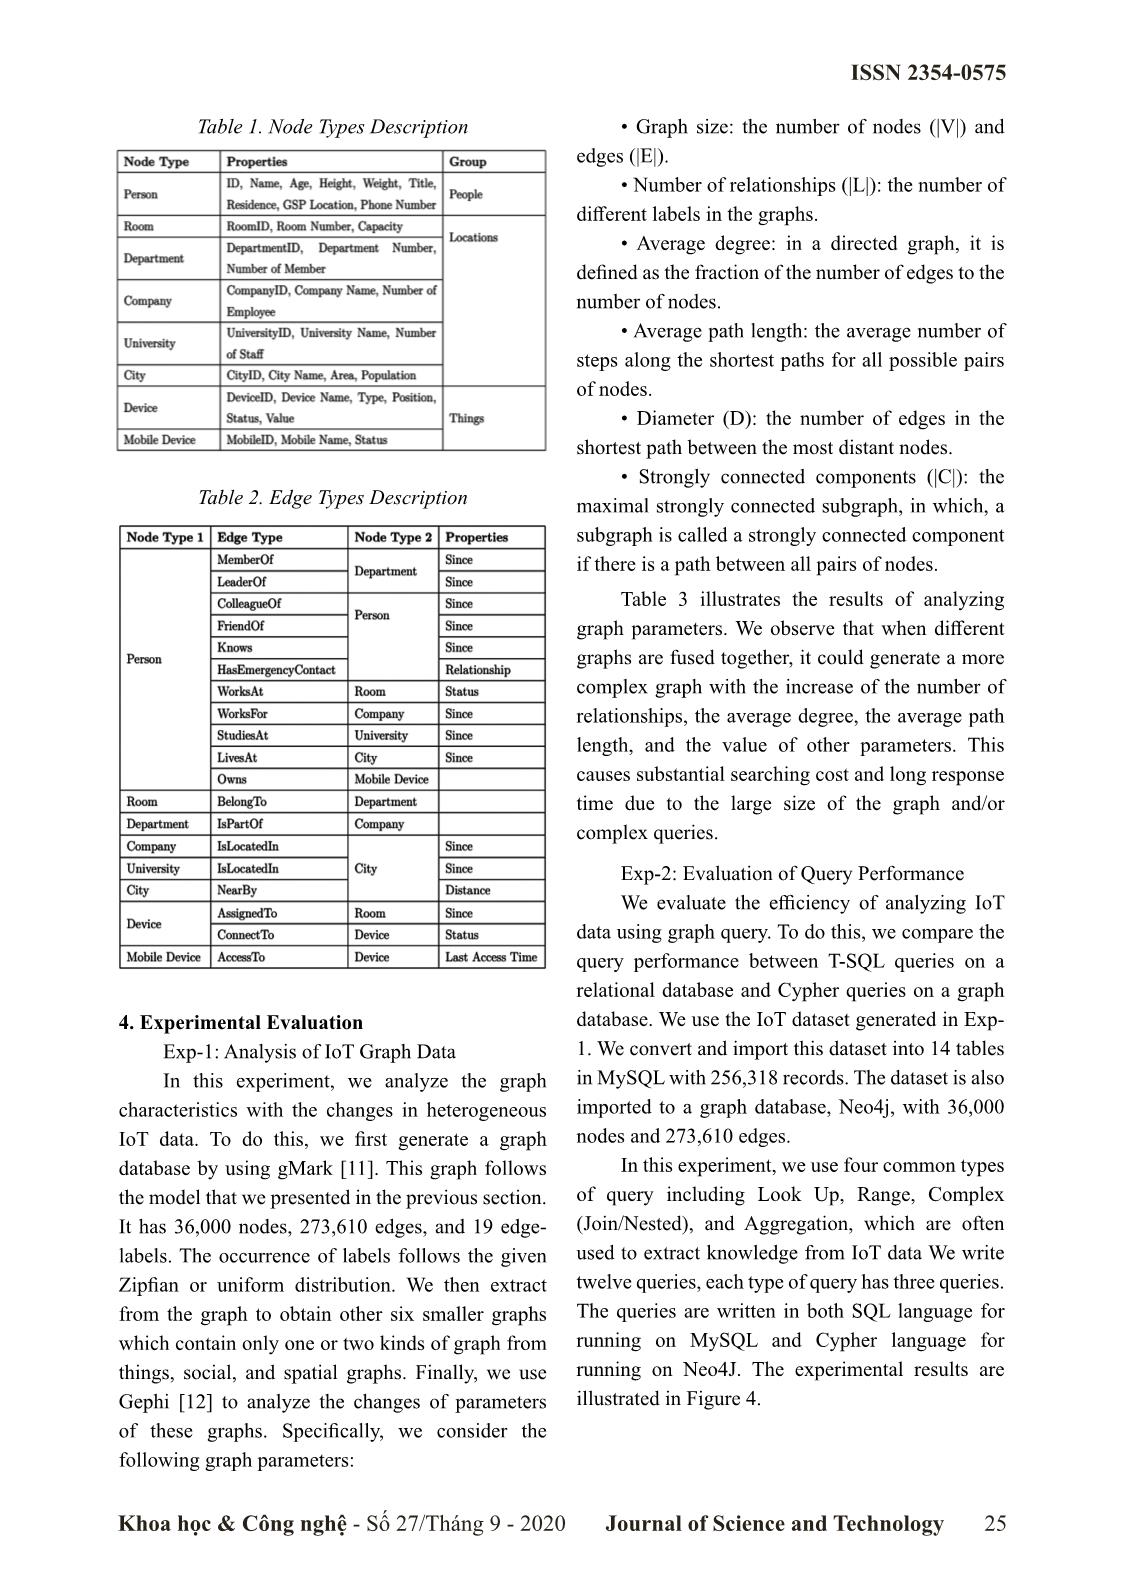
Figure 4. Query performance comparision between relational database and graph database
From the results, we found that using Cypher queries
on Neo4J can obtain better performance comparing
to using SQL queries on MySQL in all the cases in
overall. Specifically, the Look Up queries (#1, #2,
#4) and Range queries (#4, #5, #6) take a low cost
on both relational databases and graph databases.
In the case of testing complex queries like Nested
queries (#Q7, #Q8, #9), the performance of using
Cypher queries on graph databases is much faster
than the one using SQL queries on relational
databases. We observed that Cypher queries reduced
the average execution time around 3, 6, 6 times than
SQL queries corresponding to #Q7, #Q8, and #Q9,
respectively. We also observed that Aggregation
queries on graph databases often take high cost.
Indeed, their performance is up to 3 times slower
than the ones with SQL queries (#10, #11, #12).
5. Conclusion
This paper proposed a graph model for
representing IoT data. The proposed graph model
represented entities in IoT environment such as
devices, locations, people with attributes and
relationships between two entities. The efficiency
of the proposed graph model was evaluated on
a simulated smart building management dataset.
Experimental results showed that the proposed
model is more efficient than relational model in
storing and analyzing IoT data.
ISSN 2354-0575
Khoa học & Công nghệ - Số 27/Tháng 9 - 2020 Journal of Science and Technology 27
References
[1]. V. Arora, F. Nawab, D. Agrawal, and A. El Abbadi, “Multi-representation based data processing
architecture for iot applications,” in 2017 IEEE 37th International Conference on Distributed
Computing Systems (ICDCS). IEEE, 2017, pp. 2234–2239.
[2]. A. M. Ibrahim, I. Venkat, K. Subramanian, A. T. Khader, and P. D. Wilde, “Intelligent evacuation
management systems: A review,” ACM Transactions on Intelligent Systems and Technology (TIST),
2016, vol. 7, no. 3, p. 36.
[3]. Nguyen, Van-Quyet, et al. “A Scalable Approach for Dynamic Evacuation Routing in Large Smart
Buildings.” 2019 IEEE International Conference on Smart Computing (SMARTCOMP). IEEE, 2019.
[4]. M. M. Rathore, A. Ahmad, A. Paul, and G. Jeon, “Effcient graph-oriented smart transportation
using internet of things generated big data,” in 2015 11th International Conference on Signal-Image
Technology & Internet-Based Systems (SITIS). IEEE, 2015, pp. 512–519.
[5]. J. Byun, S. H. Kim, and D. Kim, “Lilliput: Ontology-based platform for iot social networks,” in
2014 IEEE International Conference on Services Computing. IEEE, 2014, pp. 139–146.
[6]. V.-Q. Nguyen and K. Kim, “Comparison of relational databases and graph databases for
heterogeneous iot data management,” in Proceedings of KISM Spring Conference 2019, 2019, pp.
194–204.
[7]. R. Jin, Y. Xiang, N. Ruan, and H. Wang, “Effciently answering reachability queries on very large
directed graphs,” in Proceedings of the 2008 ACM SIGMOD international conference on Management
of data, 2008, pp. 595–608.
[8]. Nguyen, Van-Quyet, and Kyungbaek Kim. “Estimating the evaluation cost of regular path
queries on large graphs.” Proceedings of the Eighth International Symposium on Information and
Communication Technology, 2017.
[9]. M. A. Rodriguez and P. Neubauer, “Constructions from dots and lines,” Bulletin of the American
Society for Information Science and Technology, 2010, vol. 36, no. 6, pp. 35–41.
[10]. R. Angles, M. Arenas, P. Barceló, A. Hogan, J. Reutter, and D. Vrgoč, “Foundations of modern
query languages for graph databases,” ACM Computing Surveys (CSUR), 2017, vol. 50, no. 5, p. 68.
[11]. G. Bagan, A. Bonifati, R. Ciucanu, G. H. Fletcher, A. Lemay, and N. Advokaat, “gmark: Schema-
driven generation of graphs and queries,” IEEE Transactions on Knowledge and Data Engineering,
2017, vol. 29, no. 4, pp. 856–869.
[12]. M. Bastian, S. Heymann, M. Jacomy et al., “Gephi: an open source software for exploring and
manipulating networks.” ICWSM, 2009, vol. 8, pp. 361–362.
MỘT CÁCH MÔ HÌNH HÓA BẰNG ĐỒ THỊ HIỆU QUẢ CHO VIỆC
LƯU TRỮ VÀ PHÂN TÍCH DỮ LIỆU IOT HỖN HỢP
Tóm tắt:
 Trong môi trường Internet of Thing (IoT), các thực thể với các thuộc tính và số lượng khác nhau sẽ kết
nối với nhau tạo thành một mạng lưới liên kết dày đặc. Cụ thể, không chỉ các thiết bị máy móc mà còn các
thực thể khác như con người, địa điểm và ứng dụng được kết nối với nhau. Hầu hết các ứng dụng IoT phải
đều phải đối diện với các thách thức khi một lượng lớn dữ liệu thay đổi nhanh chóng do các thực thể mới
đang được thêm vào hệ thống hoặc trạng thái kết nối giữa các thực thể thay đổi thường xuyên. Điều này yêu
cầu một mô hình dữ liệu cho phép dễ dàng trong việc biểu diễn các thực thể và hỗ trợ lưu trữ, thêm, xóa và
cập nhật quan hệ giữa các thực thể mà không ảnh hưởng đến tính khả dụng của ứng dụng. Trong bài báo
này, chúng tôi đề xuất một mô hình đồ thị chung có thể được sử dụng để thiết kế cơ sở dữ liệu đồ thị hỗ trợ
hiệu quả cho việc lưu trữ và phân tích dữ liệu IoT. Chúng tôi biểu diễn dữ liệu IoT dựa trên mô hình đồ thị
và lấy việc quản lý dữ liệu của tòa nhà thông minh là một trường hợp minh họa. Thông qua việc phân tích
kết quả thực nghiệm và so sánh ở các khía cạnh khác nhau, chúng tôi thấy rằng phương pháp tiếp cận bằng
mô hình đồ thì có thể áp dụng để lưu trữ và phân tích dữ liệu IoT hỗn hợp một cách hiệu quả.
Từ khóa: Mô hình hóa đồ thị, Cơ sở dữ liệu đồ thị, Truy vấn đồ thị, Dữ liệu kết nối, Quản lý dữ liệu IoT.
File đính kèm:
 an_efficient_graph_modeling_approach_for_storing_and_analyzi.pdf

