Some results of NAA collaborative study in white rice performed at Dalat nuclear research institute
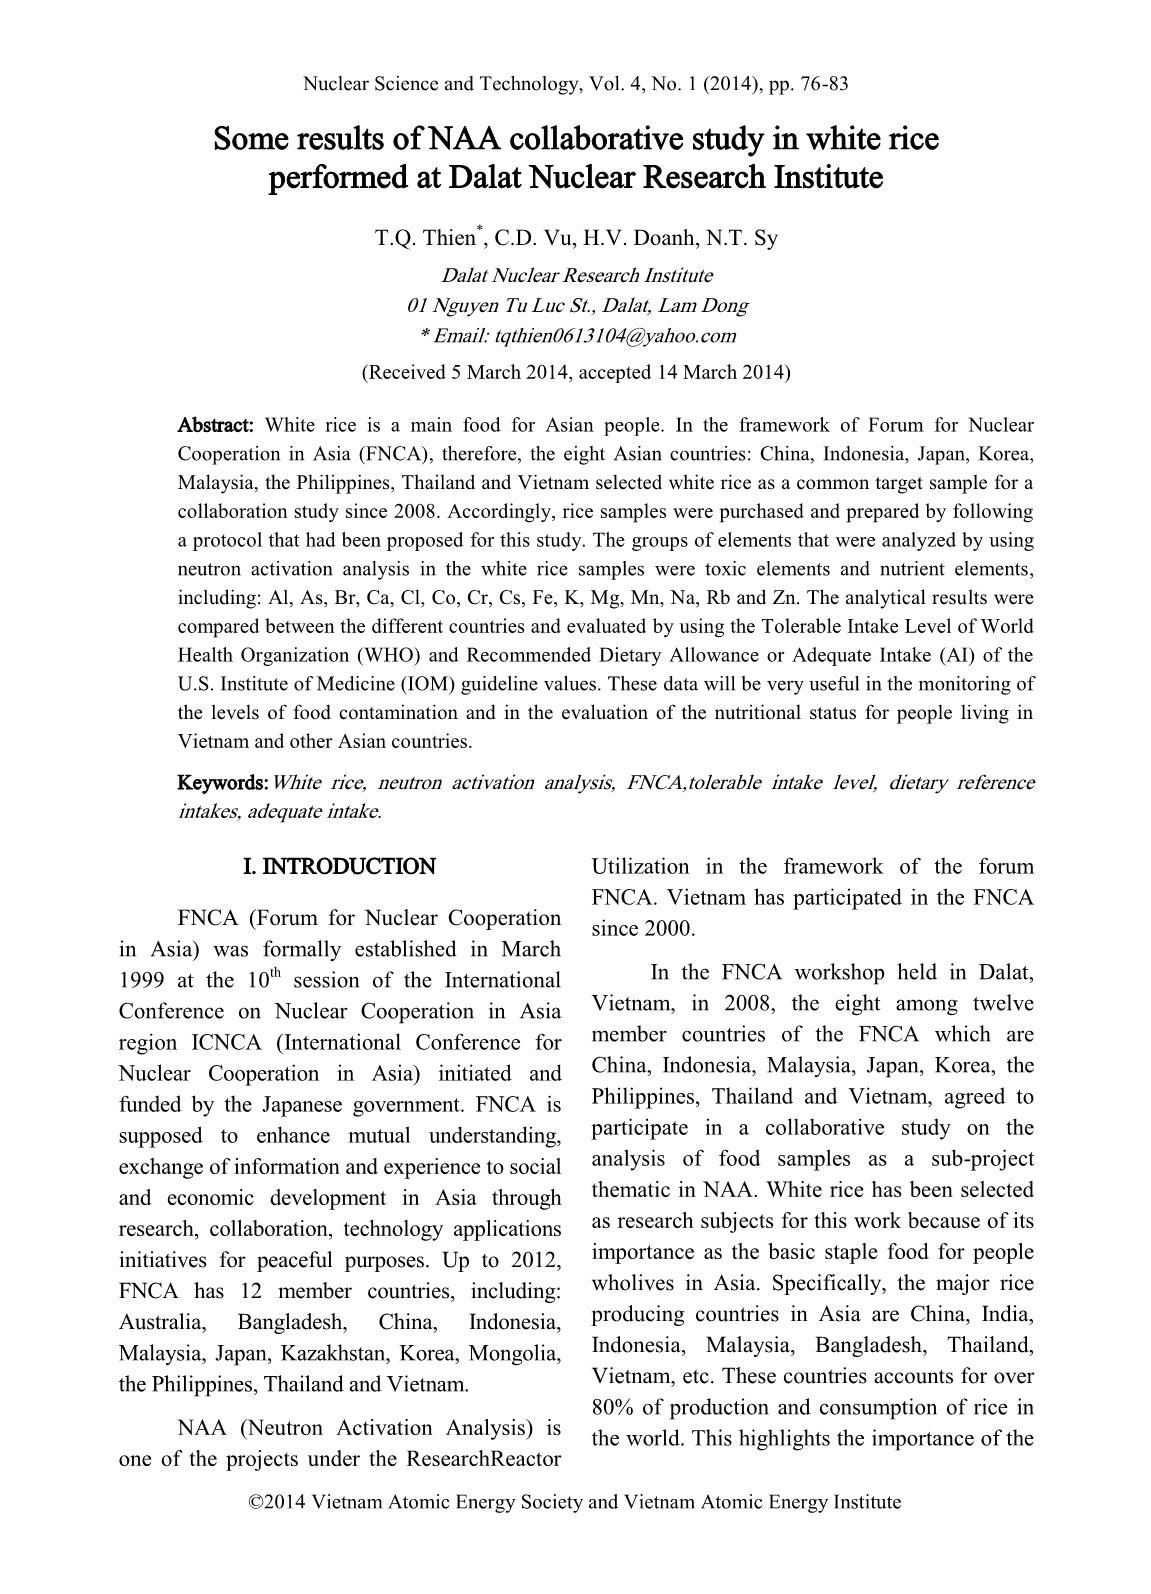
White rice is a main food for Asian people. In the framework of Forum for Nuclear
Cooperation in Asia (FNCA), therefore, the eight Asian countries: China, Indonesia, Japan, Korea,
Malaysia, the Philippines, Thailand and Vietnam selected white rice as a common target sample for a
collaboration study since 2008. Accordingly, rice samples were purchased and prepared by following
a protocol that had been proposed for this study. The groups of elements that were analyzed by using
neutron activation analysis in the white rice samples were toxic elements and nutrient elements,
including: Al, As, Br, Ca, Cl, Co, Cr, Cs, Fe, K, Mg, Mn, Na, Rb and Zn. The analytical results were
compared between the different countries and evaluated by using the Tolerable Intake Level of World
Health Organization (WHO) and Recommended Dietary Allowance or Adequate Intake (AI) of the
U.S. Institute of Medicine (IOM) guideline values. These data will be very useful in the monitoring of
the levels of food contamination and in the evaluation of the nutritional status for people living in
Vietnam and other Asian countries.
Trang 1
Trang 2
Trang 3
Trang 4
Trang 5
Trang 6
Trang 7
Trang 8
Tóm tắt nội dung tài liệu: Some results of NAA collaborative study in white rice performed at Dalat nuclear research institute
tions. The HPGe detector with
SOME RESULTS OF NAA COLLABORATIVE STUDY IN WHITE RICE ...
78
multichannel analysis system was used to
measure the gamma rays from the sample after
irradiation. The concentration of the elements
was calculated using the relative method and/or
k-zero method.
III. RESULTS AND DISCUSSION
A. The content of elements in white rice
samples
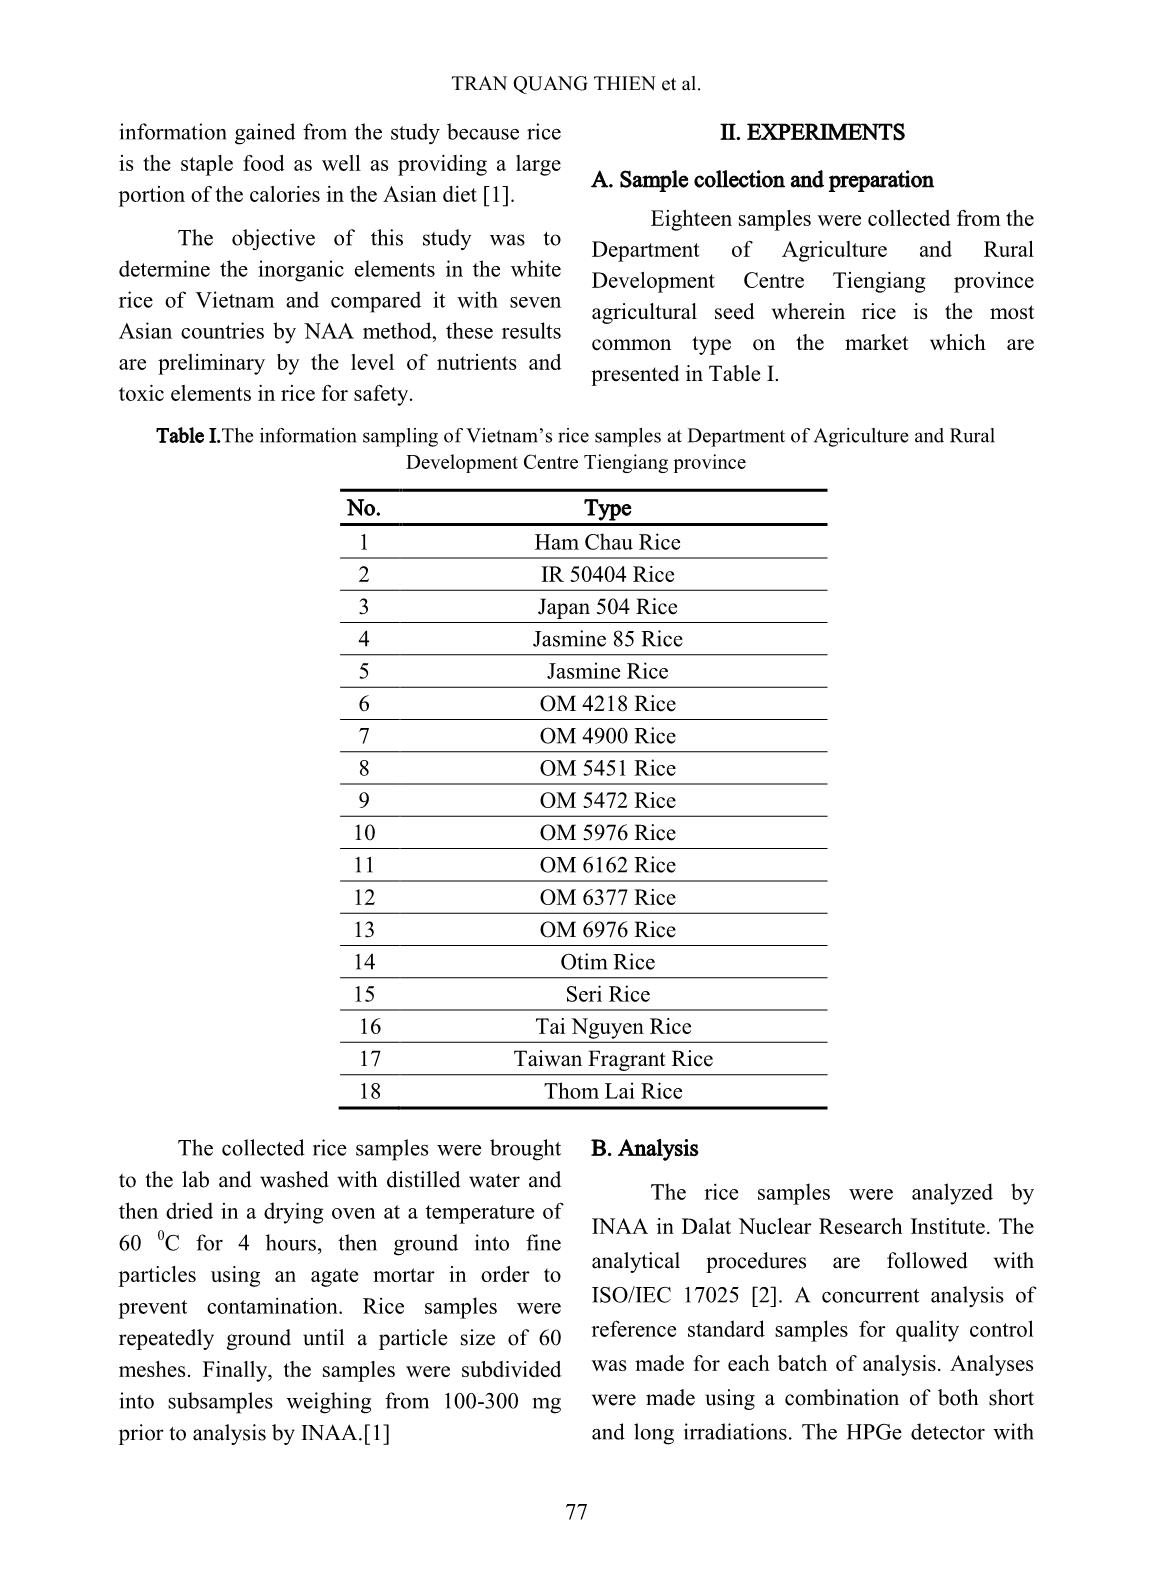
The result of standard reference material
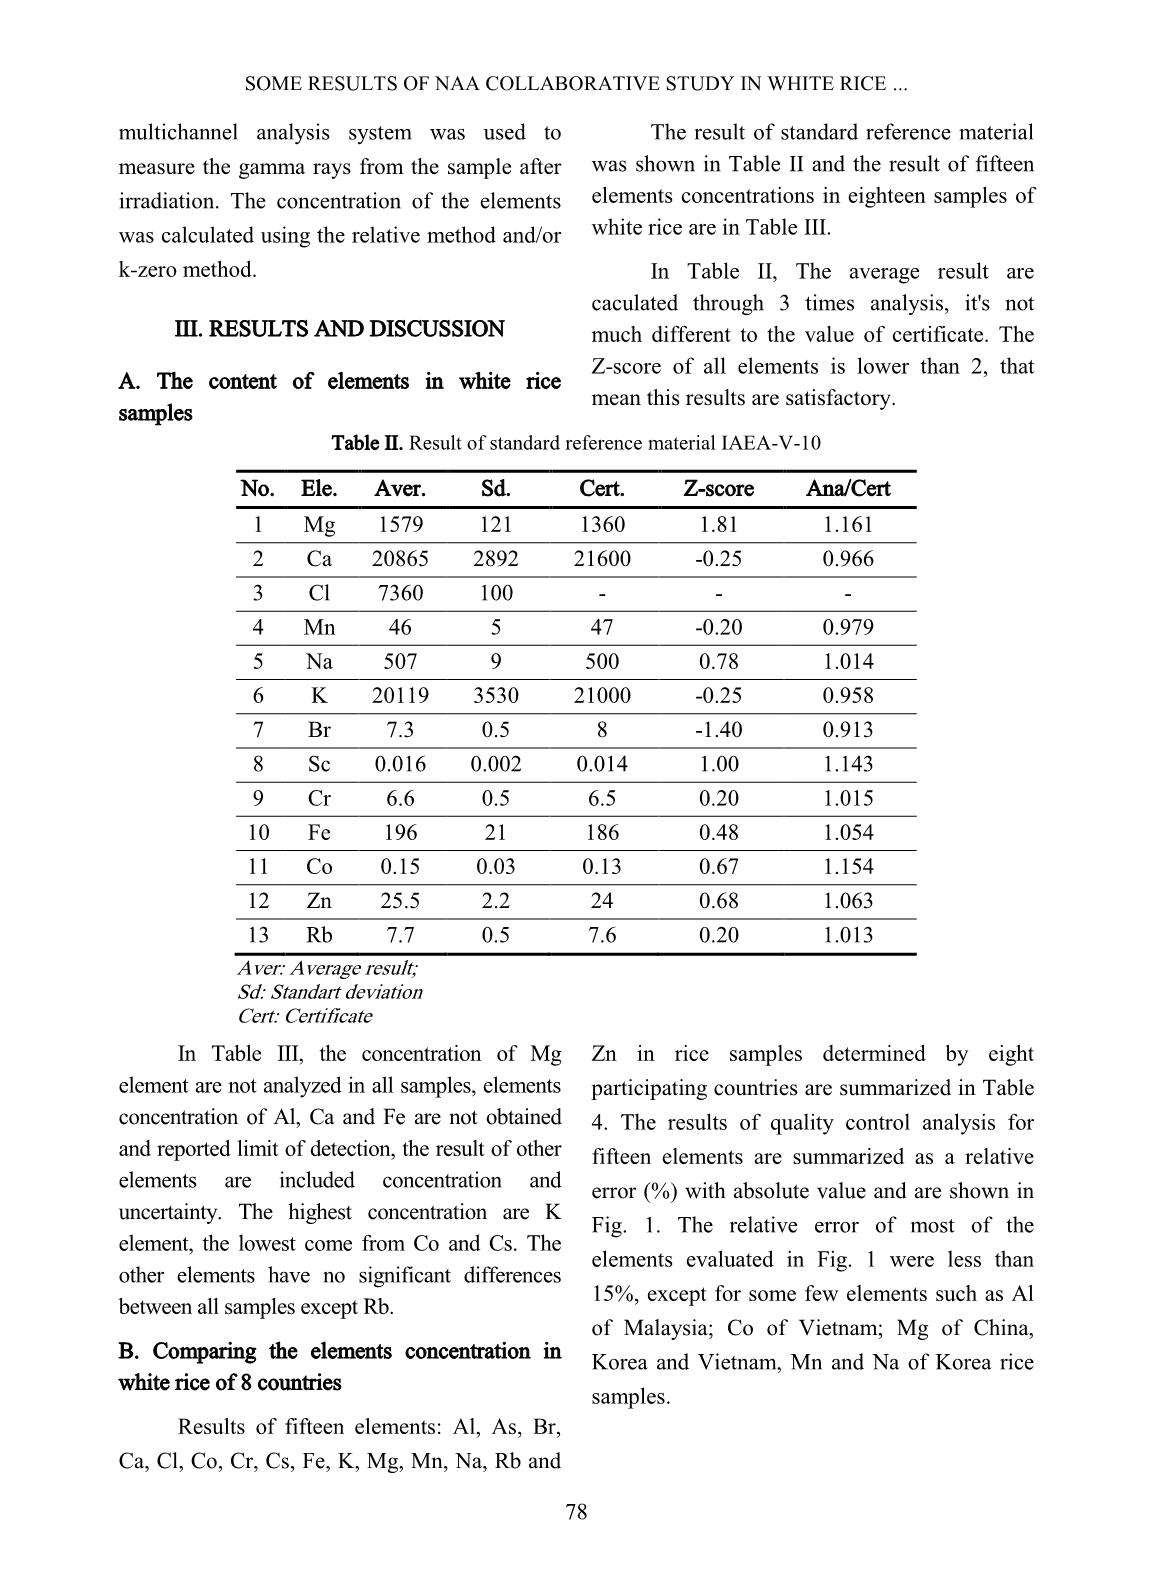
was shown in Table II and the result of fifteen
elements concentrations in eighteen samples of
white rice are in Table III.
In Table II, The average result are
caculated through 3 times analysis, it's not
much different to the value of certificate. The
Z-score of all elements is lower than 2, that
mean this results are satisfactory.
Table II. Result of standard reference material IAEA-V-10
No. Ele. Aver. Sd. Cert. Z-score Ana/Cert
1 Mg 1579 121 1360 1.81 1.161
2 Ca 20865 2892 21600 -0.25 0.966
3 Cl 7360 100 - - -
4 Mn 46 5 47 -0.20 0.979
5 Na 507 9 500 0.78 1.014
6 K 20119 3530 21000 -0.25 0.958
7 Br 7.3 0.5 8 -1.40 0.913
8 Sc 0.016 0.002 0.014 1.00 1.143
9 Cr 6.6 0.5 6.5 0.20 1.015
10 Fe 196 21 186 0.48 1.054
11 Co 0.15 0.03 0.13 0.67 1.154
12 Zn 25.5 2.2 24 0.68 1.063
13 Rb 7.7 0.5 7.6 0.20 1.013
Aver: Average result;
Sd: Standart deviation
Cert: Certificate
In Table III, the concentration of Mg
element are not analyzed in all samples, elements
concentration of Al, Ca and Fe are not obtained
and reported limit of detection, the result of other
elements are included concentration and
uncertainty. The highest concentration are K
element, the lowest come from Co and Cs. The
other elements have no significant differences
between all samples except Rb.
B. Comparing the elements concentration in
white rice of 8 countries
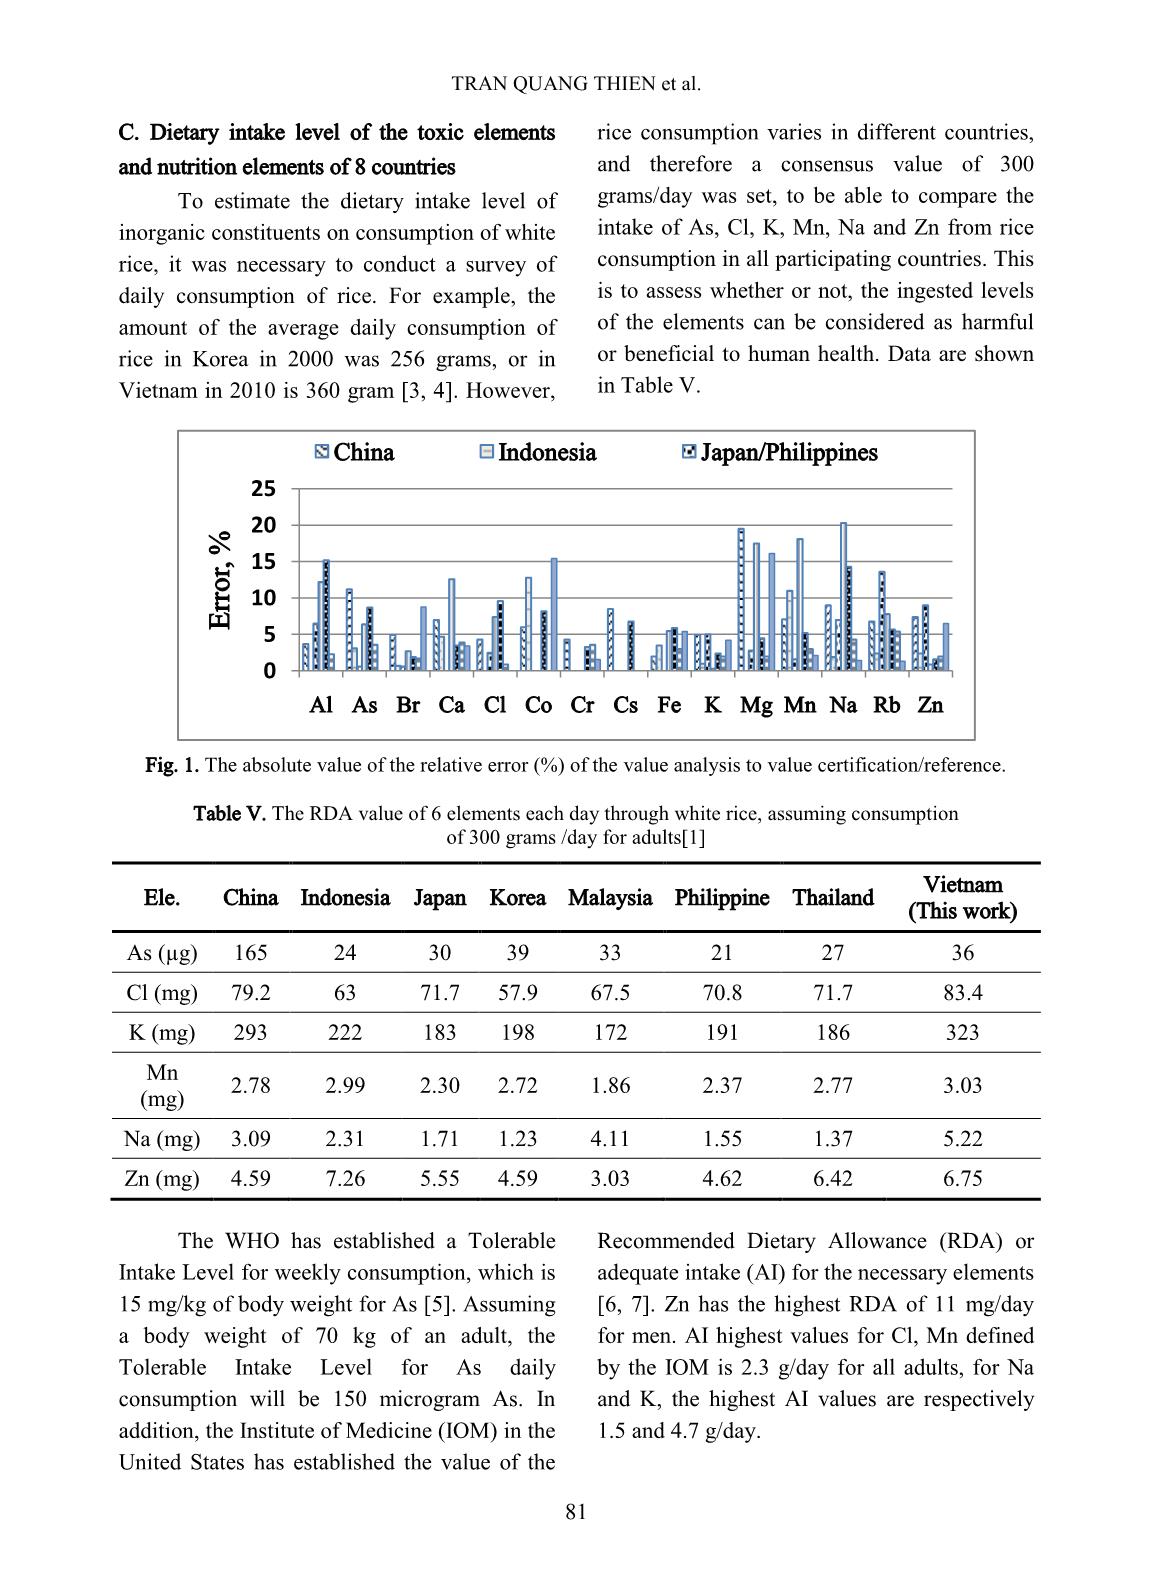
Results of fifteen elements: Al, As, Br,
Ca, Cl, Co, Cr, Cs, Fe, K, Mg, Mn, Na, Rb and
Zn in rice samples determined by eight
participating countries are summarized in Table
4. The results of quality control analysis for
fifteen elements are summarized as a relative
error (%) with absolute value and are shown in
Fig. 1. The relative error of most of the
elements evaluated in Fig. 1 were less than
15%, except for some few elements such as Al
of Malaysia; Co of Vietnam; Mg of China,
Korea and Vietnam, Mn and Na of Korea rice
samples.
TRAN QUANG THIEN et al.
79
Table III.The analytical results of eighteenwhite rice samples in Vietnam
No. Type
Al As Br Ca Cl Co Cr Cs Fe K Mg Mn Na Rb Zn
C. U. C. U. C. U. C. U. C. U. C. U. C. U. C. U. C. U. C. U. C. U. C. U. C. U. C. U. C. U.
1
Ham Chau
Rice
<3
0.12 0.02 0.43 0.05 <165
294 11 0.031 0.006 <0.4
0.026 0.007 <14
518 10 NA.
8.0 0.2 22.6 0.3 1.5 0.3 23.0 0.5
2 IR 50404 Rice <8
0.16 0.04 0.17 0.05 <160
242 11 0.026 0.008 <0.5
0.061 0.010 <10
1649 17 NA.
15.9 0.2 11.5 0.2 11.4 0.6 21.3 0.6
3
Japan 504
Rice
<4
0.06 0.02 0.78 0.07 <120
407 14 0.022 0.008 <0.4
0.019 0.008 <14
527 11 NA.
5.1 0.1 48.5 0.3 1.0 0.3 21.7 0.8
4
Jasmine 85
Rice
<5
0.13 0.03 0.31 0.07 <185
235 30 0.028 0.008 <0.5
0.056 0.012 <18
1543 17 NA.
19.1 0.1 18.2 0.3 10.3 0.7 22.8 0.8
5 Jasmine Rice <4
0.12 0.02 0.22 0.04 <100
192 10 0.030 0.008 <0.5
0.052 0.007 <20
453 9 NA.
3.5 0.1 9.0 0.2 1.9 0.4 19.2 0.6
6 OM 4218 Rice <5
0.15 0.04 0.22 0.06 <130
282 25 0.031 0.008 <0.6
0.045 0.009 <17
1548 16 NA.
12.8 0.1 17.1 0.3 8.3 0.6 22.2 0.7
7 OM 4900 Rice <7
0.10 0.03 0.34 0.07 <140
346 31 0.043 0.008 <0.5
0.044 0.010 <19
1780 18 NA.
16.0 0.1 14.8 0.3 5.9 0.5 26.2 0.7
8 OM 5451 Rice <7
0.15 0.03 0.29 0.06 <120
199 23 0.036 0.007 <0.6
0.046 0.008 <16
1254 16 NA.
11.8 0.1 18.8 0.3 11.4 0.7 22.6 0.7
9 OM 5472 Rice <4
0.11 0.03 0.26 0.06 <100
293 22 0.034 0.007 <0.5
0.047 0.011 <22
1414 15 NA.
11.9 0.1 14.9 0.2 9.7 0.6 24.8 0.7
10 OM 5976 Rice <5
0.11 0.03 0.18 0.05 <110
186 11 0.031 0.009 <0.6
0.043 0.011 <17
1227 14 NA.
12.7 0.1 11.3 0.2 10.7 0.6 24.0 0.7
11 OM 6162 Rice
<1
0
0.08 0.03 0.17 0.05 <120
307 13 0.043 0.009 <0.4
0.039 0.011 <16
1509 16 NA.
13.9 0.2 12.6 0.2 8.3 0.6 23.7 0.7
12 OM 6377 Rice <7
0.14 0.03 0.23 0.06 <120
266 27 0.058 0.009 <0.6
0.063 0.011 <13
1636 16 NA.
16.8 0.1 13.1 0.2 15.7 0.7 23.4 0.8
13 OM 6976 Rice <6
0.11 0.03 0.34 0.05 <100
382 14 0.027 0.007 <0.5
0.038 0.009 <19
1487 16 NA.
6.7 0.3 13.5 0.2 4.8 0.5 25.0 0.7
14 Otim Rice <4
0.17 0.03 0.47 0.04 <100
225 11 0.044 0.009 <0.3
0.051 0.013 <28
568 11 NA.
7.5 0.1 14.4 0.2 2.8 0.5 21.4 0.7
15 Seri Rice <4
0.22 0.02 0.18 0.04 <135
236 11 0.041 0.009 <0.4
0.074 0.011 <21
501 9 NA.
5.4 0.1 13.5 0.2 8.2 0.7 21.1 0.7
16
Tai Nguyen
Rice
<3
0.06 0.02 0.65 0.07 <100
378 12 0.039 0.009 <0.5
0.016 0.007 <16
470 9 NA.
5.2 0.1 40.9 0.3 1.0 0.3 17.5 0.7
17 Taiwan Rice <5
0.11 0.03 0.23 0.04 <110
330 12 0.024 0.010 HL
0.066 0.010 <22
842 13 NA.
5.9 0.1 10.5 0.2 7.5 0.6 24.8 0.9
18 Thom Lai Rice <3
0.08 0.02 0.40 0.04 <110
208 9 0.031 0.008 <0.5
0.029 0.007 <14
463 8 NA.
3.9 0.1 7.8 0.2 1.2 0.4 19.8 0.6
Average <5 0.12 0.33 <124 278 0.034 <0.5 0.045 <18 1077 NA. 10.1 17.4 6.8 22.5
Unit: mg/kg; C. : Concentration; U. : Uncertainty; NA. : Not Applicable
SOME RESULTS OF NAA COLLABORATIVE STUDY IN WHITE RICE ...
80
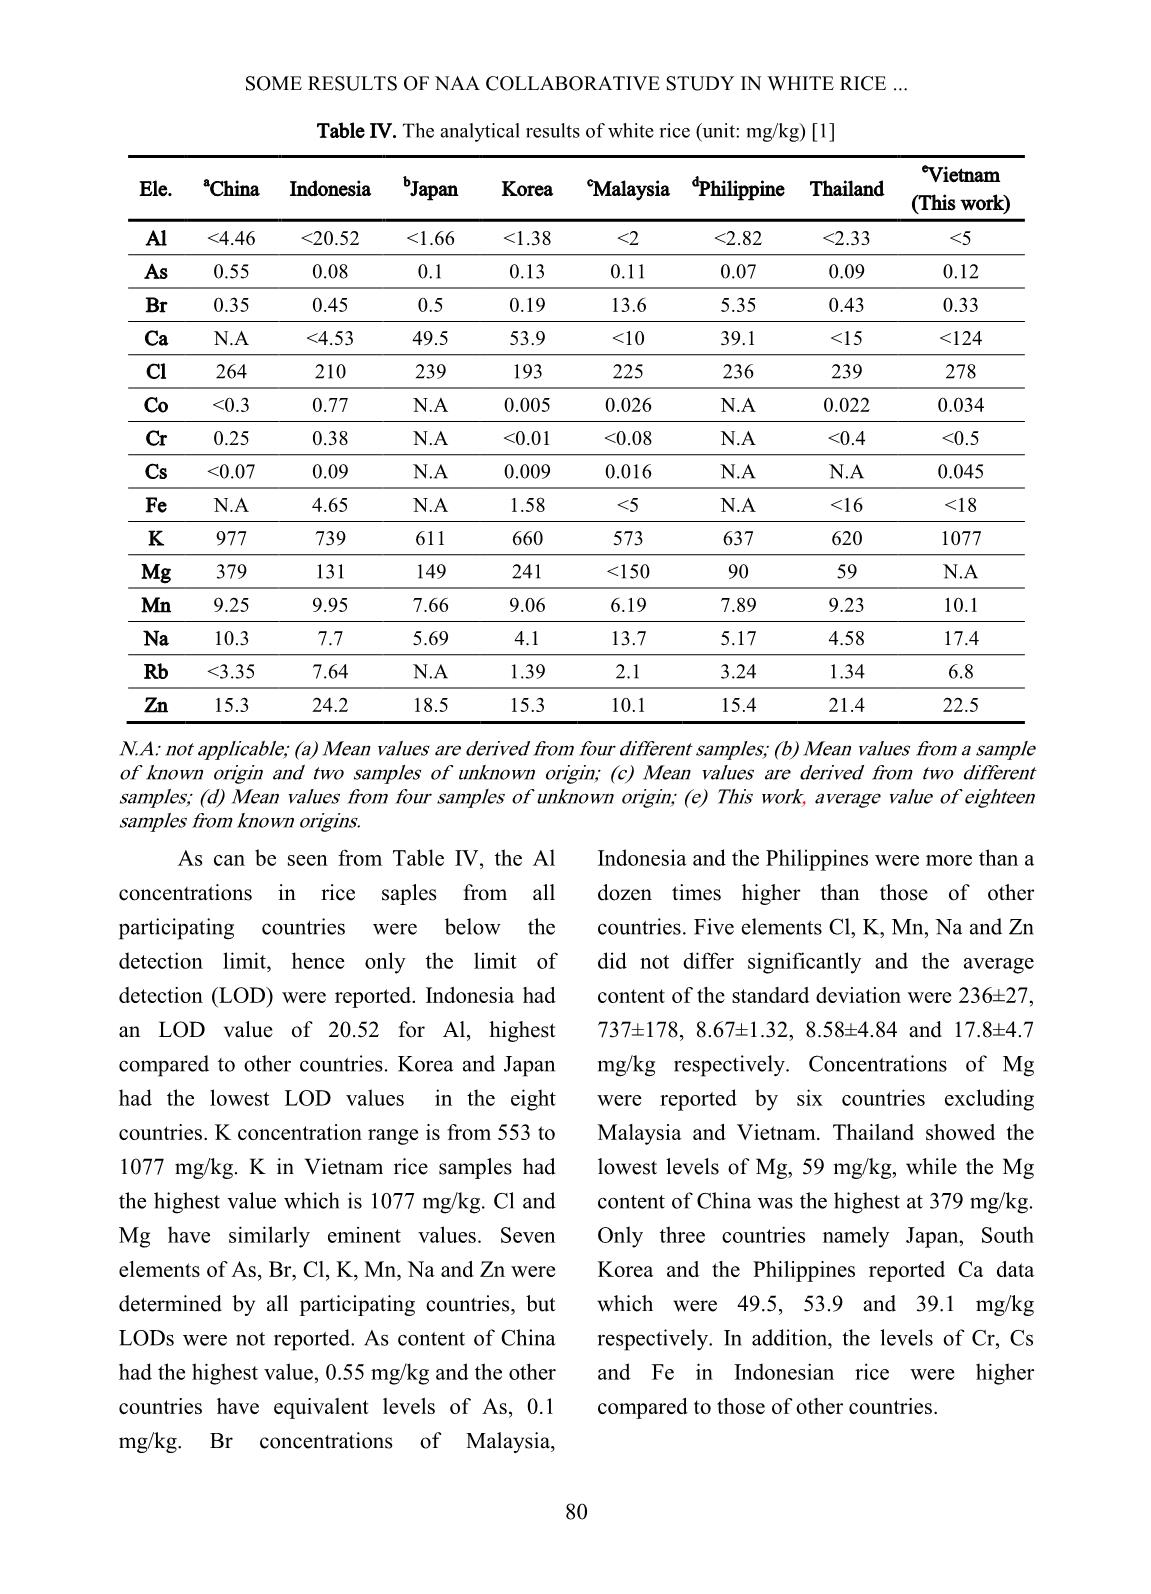
Table IV. The analytical results of white rice (unit: mg/kg) [1]
Ele.
a
China Indonesia
b
Japan Korea
c
Malaysia
d
Philippine Thailand
e
Vietnam
(This work)
Al <4.46 <20.52 <1.66 <1.38 <2 <2.82 <2.33 <5
As 0.55 0.08 0.1 0.13 0.11 0.07 0.09 0.12
Br 0.35 0.45 0.5 0.19 13.6 5.35 0.43 0.33
Ca N.A <4.53 49.5 53.9 <10 39.1 <15 <124
Cl 264 210 239 193 225 236 239 278
Co <0.3 0.77 N.A 0.005 0.026 N.A 0.022 0.034
Cr 0.25 0.38 N.A <0.01 <0.08 N.A <0.4 <0.5
Cs <0.07 0.09 N.A 0.009 0.016 N.A N.A 0.045
Fe N.A 4.65 N.A 1.58 <5 N.A <16 <18
K 977 739 611 660 573 637 620 1077
Mg 379 131 149 241 <150 90 59 N.A
Mn 9.25 9.95 7.66 9.06 6.19 7.89 9.23 10.1
Na 10.3 7.7 5.69 4.1 13.7 5.17 4.58 17.4
Rb <3.35 7.64 N.A 1.39 2.1 3.24 1.34 6.8
Zn 15.3 24.2 18.5 15.3 10.1 15.4 21.4 22.5
N.A: not applicable; (a) Mean values are derived from four different samples; (b) Mean values from a sample
of known origin and two samples of unknown origin; (c) Mean values are derived from two different
samples; (d) Mean values from four samples of unknown origin; (e) This work, average value of eighteen
samples from known origins.
As can be seen from Table IV, the Al
concentrations in rice saples from all
participating countries were below the
detection limit, hence only the limit of
detection (LOD) were reported. Indonesia had
an LOD value of 20.52 for Al, highest
compared to other countries. Korea and Japan
had the lowest LOD values in the eight
countries. K concentration range is from 553 to
1077 mg/kg. K in Vietnam rice samples had
the highest value which is 1077 mg/kg. Cl and
Mg have similarly eminent values. Seven
elements of As, Br, Cl, K, Mn, Na and Zn were
determined by all participating countries, but
LODs were not reported. As content of China
had the highest value, 0.55 mg/kg and the other
countries have equivalent levels of As, 0.1
mg/kg. Br concentrations of Malaysia,
Indonesia and the Philippines were more than a
dozen times higher than those of other
countries. Five elements Cl, K, Mn, Na and Zn
did not differ significantly and the average
content of the standard deviation were 236±27,
737±178, 8.67±1.32, 8.58±4.84 and 17.8±4.7
mg/kg respectively. Concentrations of Mg
were reported by six countries excluding
Malaysia and Vietnam. Thailand showed the
lowest levels of Mg, 59 mg/kg, while the Mg
content of China was the highest at 379 mg/kg.
Only three countries namely Japan, South
Korea and the Philippines reported Ca data
which were 49.5, 53.9 and 39.1 mg/kg
respectively. In addition, the levels of Cr, Cs
and Fe in Indonesian rice were higher
compared to those of other countries.
TRAN QUANG THIEN et al.
81
C. Dietary intake level of the toxic elements
and nutrition elements of 8 countries
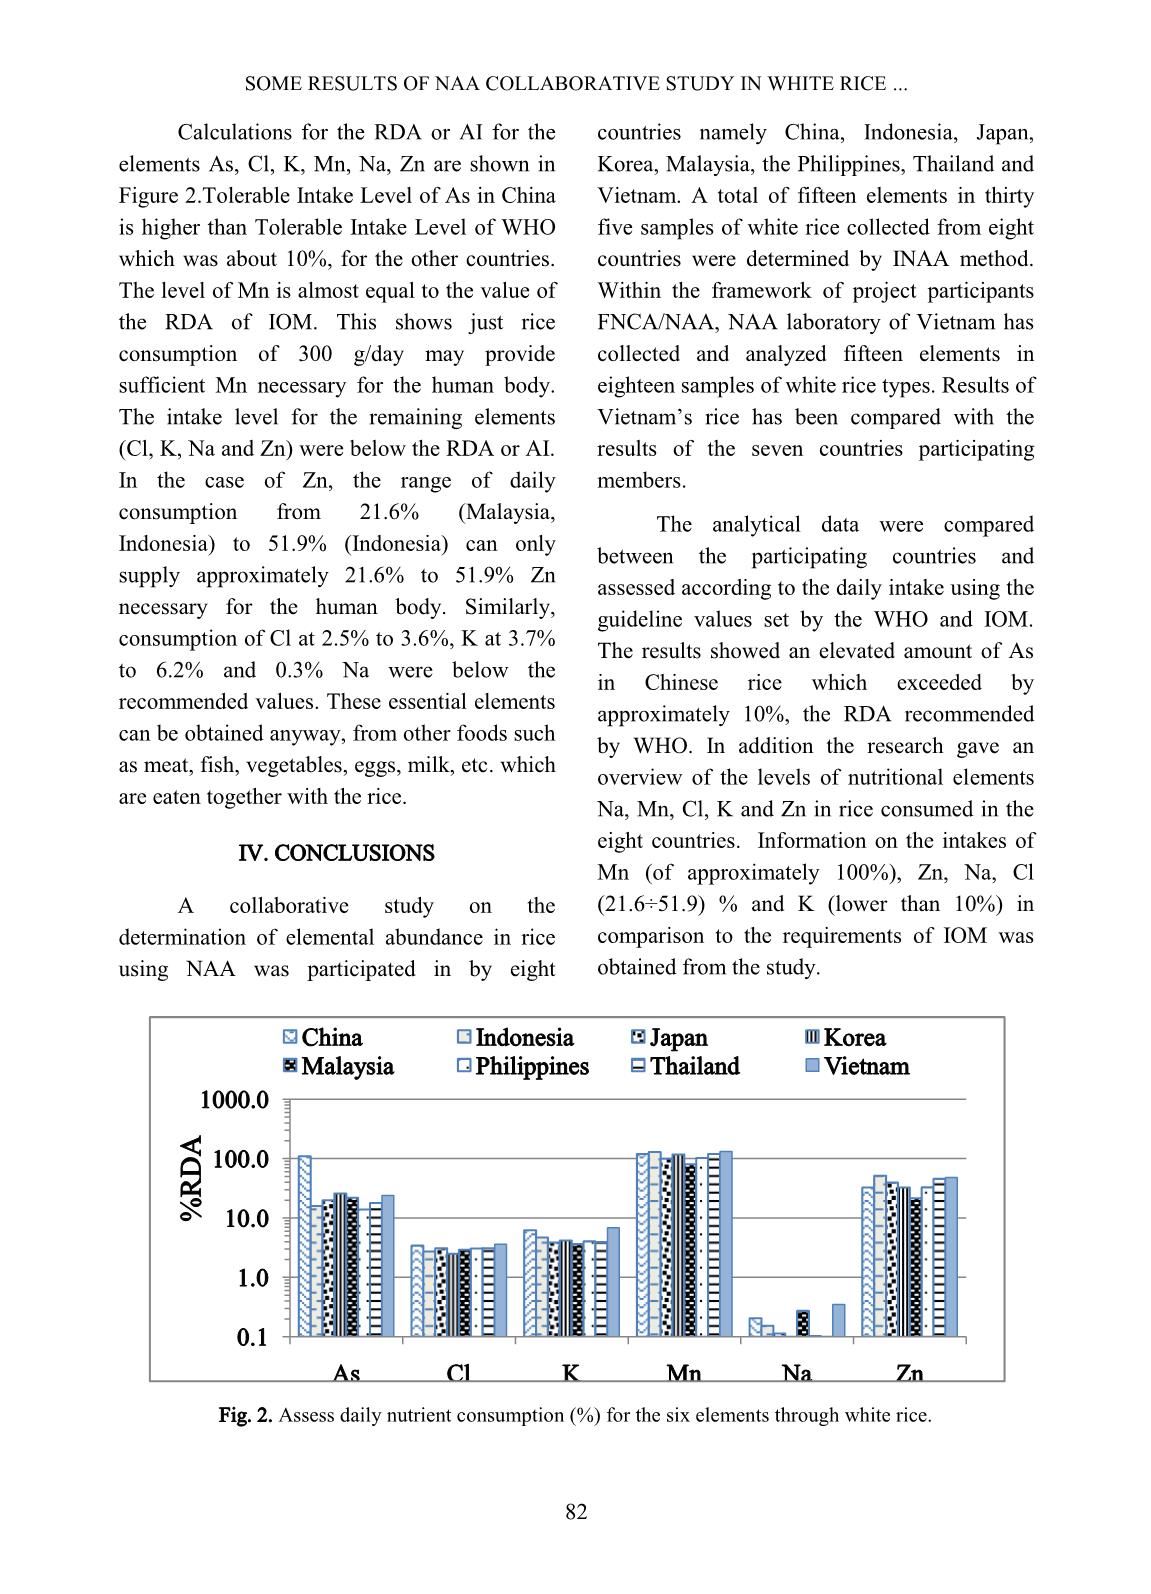
To estimate the dietary intake level of
inorganic constituents on consumption of white
rice, it was necessary to conduct a survey of
daily consumption of rice. For example, the
amount of the average daily consumption of
rice in Korea in 2000 was 256 grams, or in
Vietnam in 2010 is 360 gram [3, 4]. However,
rice consumption varies in different countries,
and therefore a consensus value of 300
grams/day was set, to be able to compare the
intake of As, Cl, K, Mn, Na and Zn from rice
consumption in all participating countries. This
is to assess whether or not, the ingested levels
of the elements can be considered as harmful
or beneficial to human health. Data are shown
in Table V.
Fig. 1. The absolute value of the relative error (%) of the value analysis to value certification/reference.
Table V. The RDA value of 6 elements each day through white rice, assuming consumption
of 300 grams /day for adults[1]
Ele. China Indonesia Japan Korea Malaysia Philippine Thailand
Vietnam
(This work)
As (µg) 165 24 30 39 33 21 27 36
Cl (mg) 79.2 63 71.7 57.9 67.5 70.8 71.7 83.4
K (mg) 293 222 183 198 172 191 186 323
Mn
(mg)
2.78 2.99 2.30 2.72 1.86 2.37 2.77 3.03
Na (mg) 3.09 2.31 1.71 1.23 4.11 1.55 1.37 5.22
Zn (mg) 4.59 7.26 5.55 4.59 3.03 4.62 6.42 6.75
The WHO has established a Tolerable
Intake Level for weekly consumption, which is
15 mg/kg of body weight for As [5]. Assuming
a body weight of 70 kg of an adult, the
Tolerable Intake Level for As daily
consumption will be 150 microgram As. In
addition, the Institute of Medicine (IOM) in the
United States has established the value of the
Recommended Dietary Allowance (RDA) or
adequate intake (AI) for the necessary elements
[6, 7]. Zn has the highest RDA of 11 mg/day
for men. AI highest values for Cl, Mn defined
by the IOM is 2.3 g/day for all adults, for Na
and K, the highest AI values are respectively
1.5 and 4.7 g/day.
0
5
10
15
20
25
Al As Br Ca Cl Co Cr Cs Fe K Mg Mn Na Rb Zn
E
rr
o
r,
 %
China Indonesia Japan/Philippines
SOME RESULTS OF NAA COLLABORATIVE STUDY IN WHITE RICE ...
82
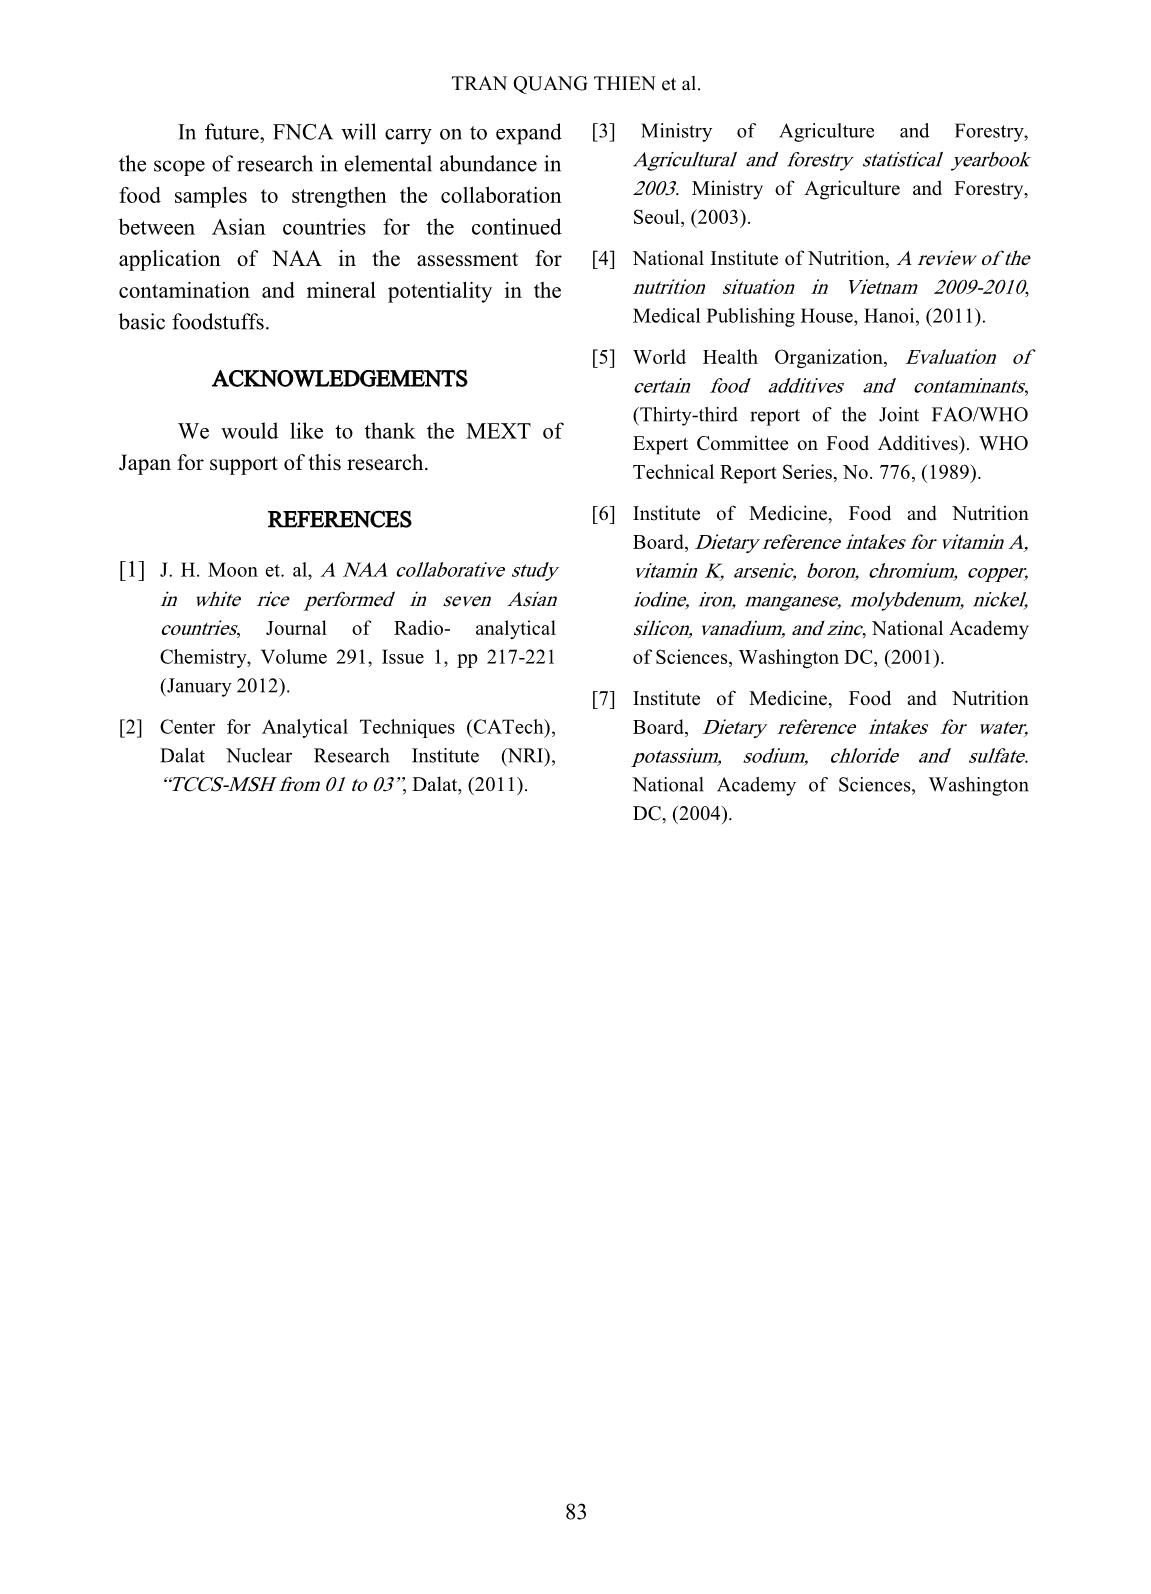
Calculations for the RDA or AI for the
elements As, Cl, K, Mn, Na, Zn are shown in
Figure 2.Tolerable Intake Level of As in China
is higher than Tolerable Intake Level of WHO
which was about 10%, for the other countries.
The level of Mn is almost equal to the value of
the RDA of IOM. This shows just rice
consumption of 300 g/day may provide
sufficient Mn necessary for the human body.
The intake level for the remaining elements
(Cl, K, Na and Zn) were below the RDA or AI.
In the case of Zn, the range of daily
consumption from 21.6% (Malaysia,
Indonesia) to 51.9% (Indonesia) can only
supply approximately 21.6% to 51.9% Zn
necessary for the human body. Similarly,
consumption of Cl at 2.5% to 3.6%, K at 3.7%
to 6.2% and 0.3% Na were below the
recommended values. These essential elements
can be obtained anyway, from other foods such
as meat, fish, vegetables, eggs, milk, etc. which
are eaten together with the rice.
IV. CONCLUSIONS
A collaborative study on the
determination of elemental abundance in rice
using NAA was participated in by eight
countries namely China, Indonesia, Japan,
Korea, Malaysia, the Philippines, Thailand and
Vietnam. A total of fifteen elements in thirty
five samples of white rice collected from eight
countries were determined by INAA method.
Within the framework of project participants
FNCA/NAA, NAA laboratory of Vietnam has
collected and analyzed fifteen elements in
eighteen samples of white rice types. Results of
Vietnam’s rice has been compared with the
results of the seven countries participating
members.
The analytical data were compared
between the participating countries and
assessed according to the daily intake using the
guideline values set by the WHO and IOM.
The results showed an elevated amount of As
in Chinese rice which exceeded by
approximately 10%, the RDA recommended
by WHO. In addition the research gave an
overview of the levels of nutritional elements
Na, Mn, Cl, K and Zn in rice consumed in the
eight countries. Information on the intakes of
Mn (of approximately 100%), Zn, Na, Cl
(21.6÷51.9) % and K (lower than 10%) in
comparison to the requirements of IOM was
obtained from the study.
Fig. 2. Assess daily nutrient consumption (%) for the six elements through white rice.
0.1
1.0
10.0
100.0
1000.0
As Cl K Mn Na Zn
%
R
D
A
China Indonesia Japan Korea
Malaysia Philippines Thailand Vietnam
TRAN QUANG THIEN et al.
83
In future, FNCA will carry on to expand
the scope of research in elemental abundance in
food samples to strengthen the collaboration
between Asian countries for the continued
application of NAA in the assessment for
contamination and mineral potentiality in the
basic foodstuffs.
ACKNOWLEDGEMENTS
We would like to thank the MEXT of
Japan for support of this research.
REFERENCES
[1] J. H. Moon et. al, A NAA collaborative study
in white rice performed in seven Asian
countries, Journal of Radio- analytical
Chemistry, Volume 291, Issue 1, pp 217-221
(January 2012).
[2] Center for Analytical Techniques (CATech),
Dalat Nuclear Research Institute (NRI),
“TCCS-MSH from 01 to 03”, Dalat, (2011).
[3] Ministry of Agriculture and Forestry,
Agricultural and forestry statistical yearbook
2003. Ministry of Agriculture and Forestry,
Seoul, (2003).
[4] National Institute of Nutrition, A review of the
nutrition situation in Vietnam 2009-2010,
Medical Publishing House, Hanoi, (2011).
[5] World Health Organization, Evaluation of
certain food additives and contaminants,
(Thirty-third report of the Joint FAO/WHO
Expert Committee on Food Additives). WHO
Technical Report Series, No. 776, (1989).
[6] Institute of Medicine, Food and Nutrition
Board, Dietary reference intakes for vitamin A,
vitamin K, arsenic, boron, chromium, copper,
iodine, iron, manganese, molybdenum, nickel,
silicon, vanadium, and zinc, National Academy
of Sciences, Washington DC, (2001).
[7] Institute of Medicine, Food and Nutrition
Board, Dietary reference intakes for water,
potassium, sodium, chloride and sulfate.
National Academy of Sciences, Washington
DC, (2004).
File đính kèm:
 some_results_of_naa_collaborative_study_in_white_rice_perfor.pdf

