Some main results of commissioning of the Dalat research reactor with low enriched fuel
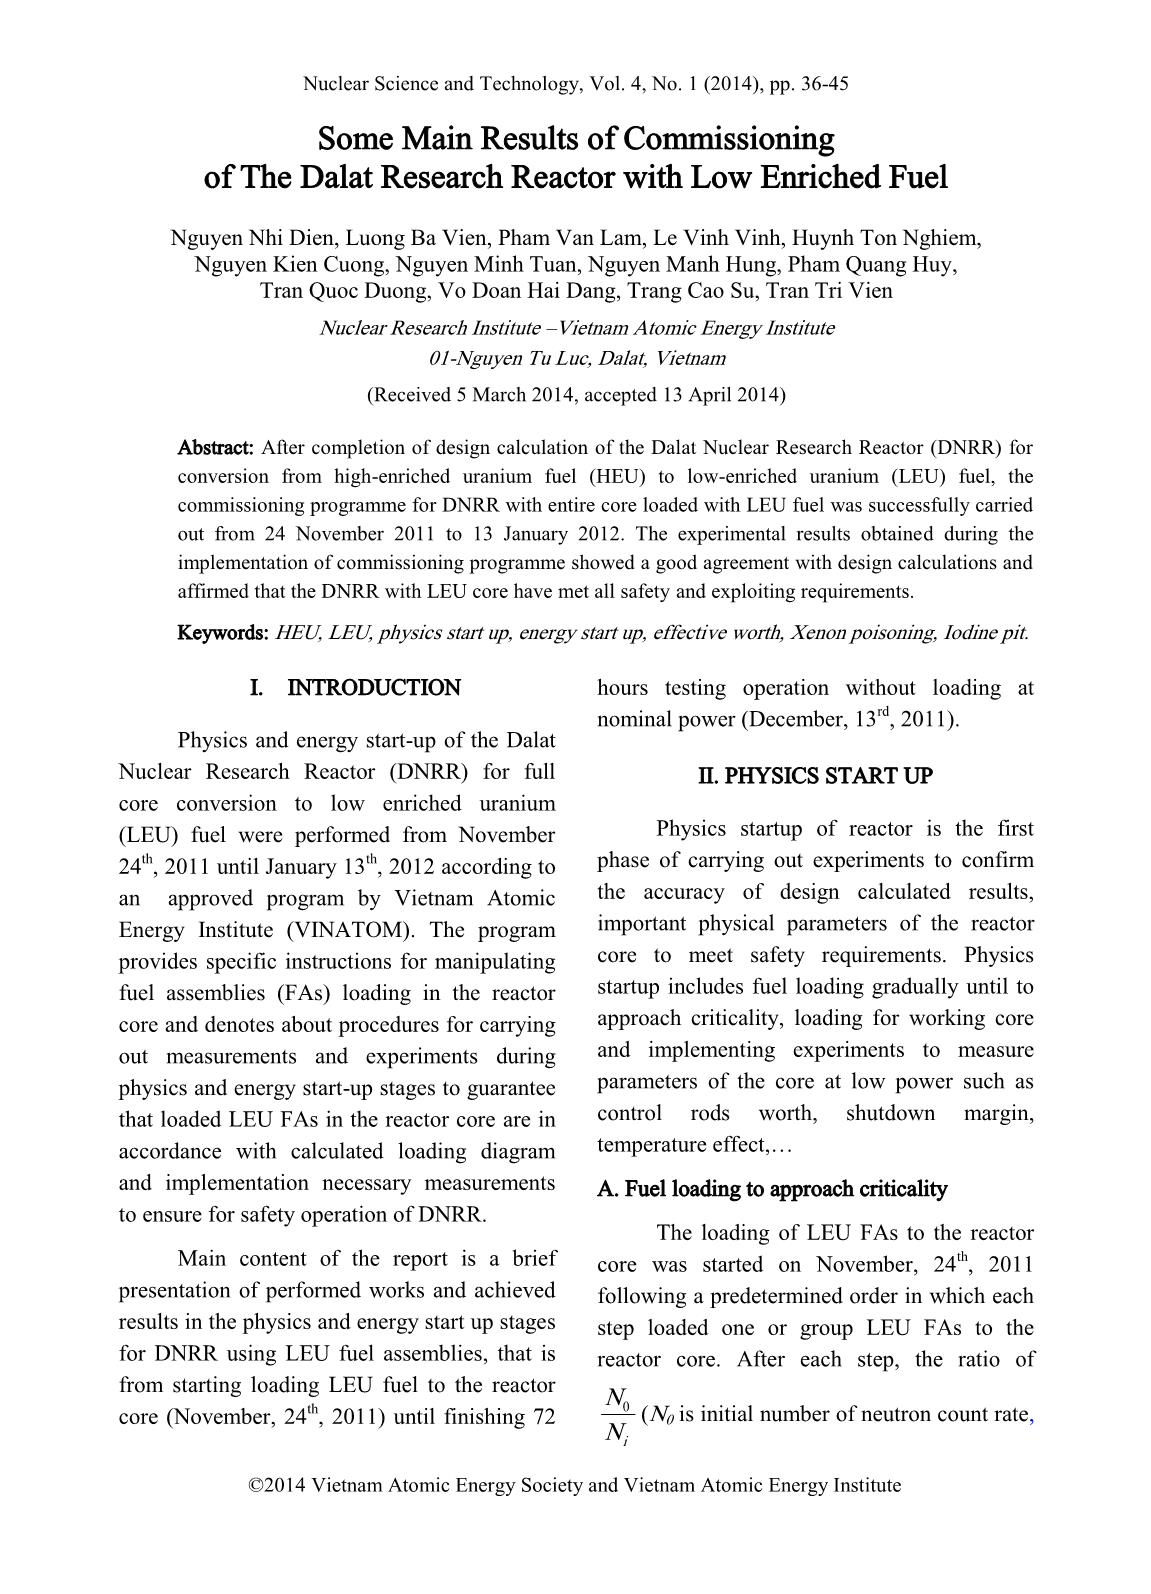
After completion of design calculation of the Dalat Nuclear Research Reactor (DNRR) for
conversion from high-enriched uranium fuel (HEU) to low-enriched uranium (LEU) fuel, the
commissioning programme for DNRR with entire core loaded with LEU fuel was successfully carried
out from 24 November 2011 to 13 January 2012. The experimental results obtained during the
implementation of commissioning programme showed a good agreement with design calculations and
affirmed that the DNRR with LEU core have met all safety and exploiting requirements.
Trang 1
Trang 2
Trang 3
Trang 4
Trang 5
Trang 6
Trang 7
Trang 8
Trang 9
Trang 10
Bạn đang xem tài liệu "Some main results of commissioning of the Dalat research reactor with low enriched fuel", để tải tài liệu gốc về máy hãy click vào nút Download ở trên
Tóm tắt nội dung tài liệu: Some main results of commissioning of the Dalat research reactor with low enriched fuel
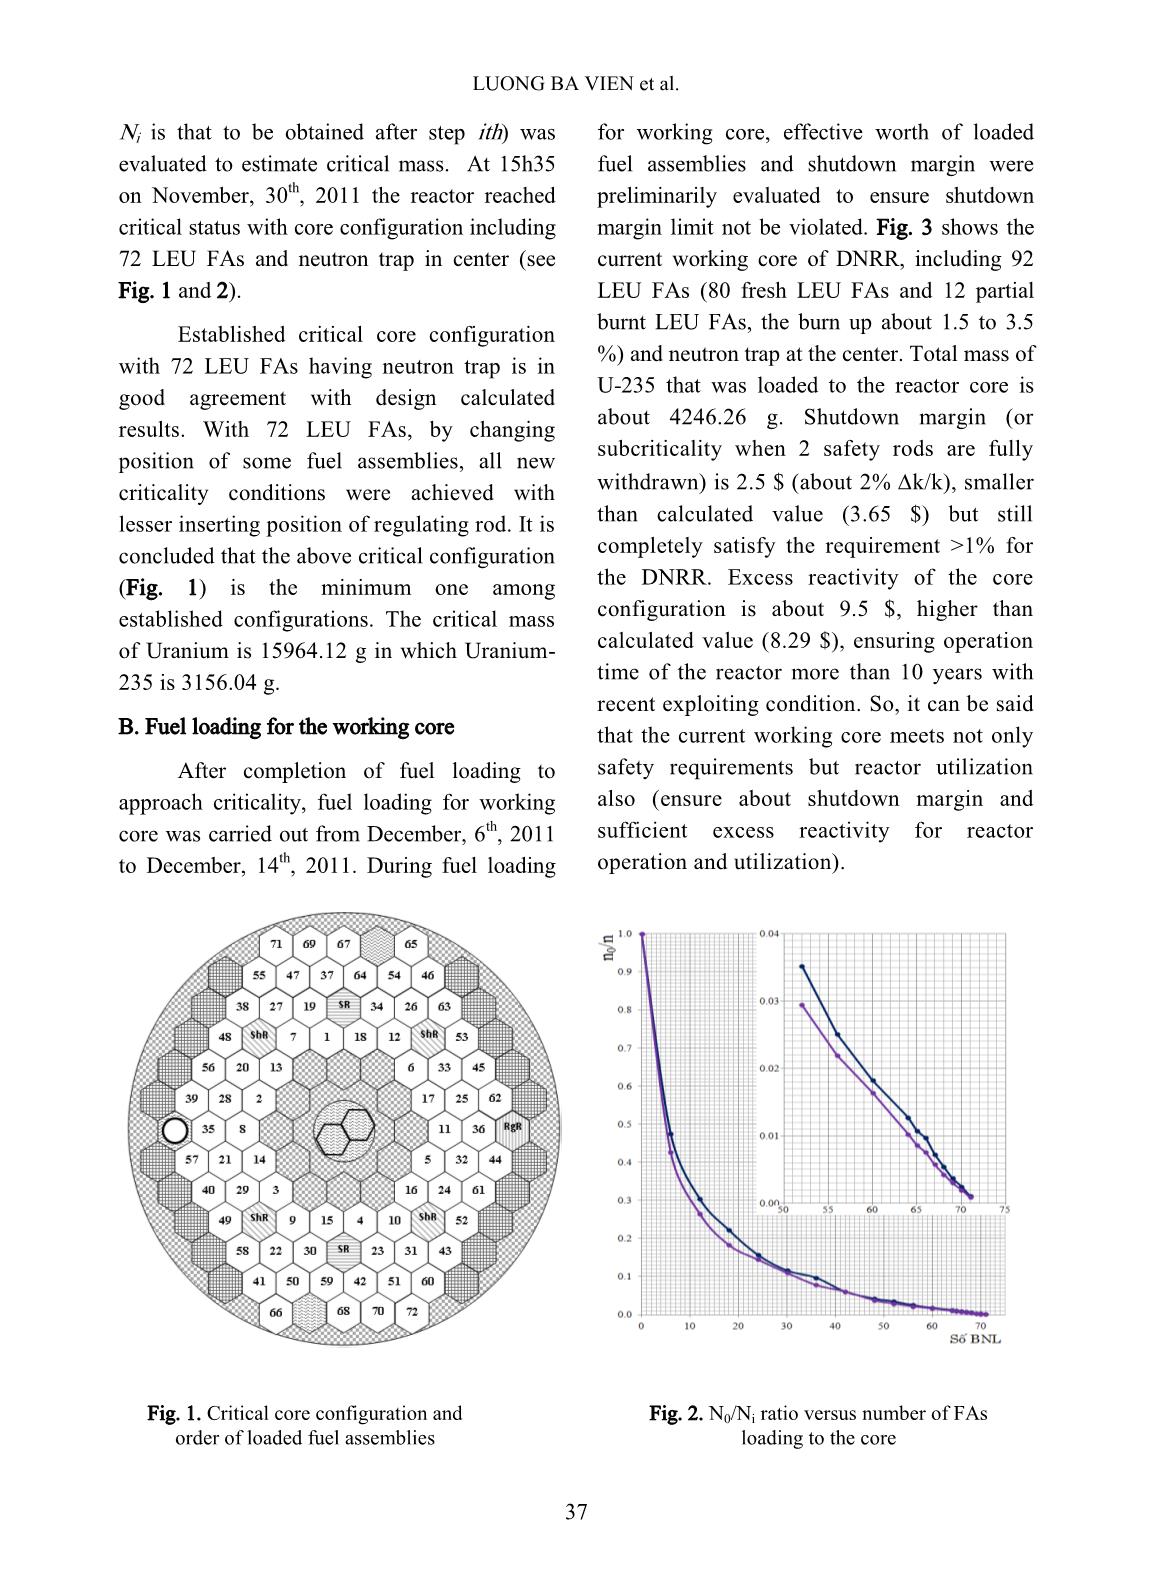
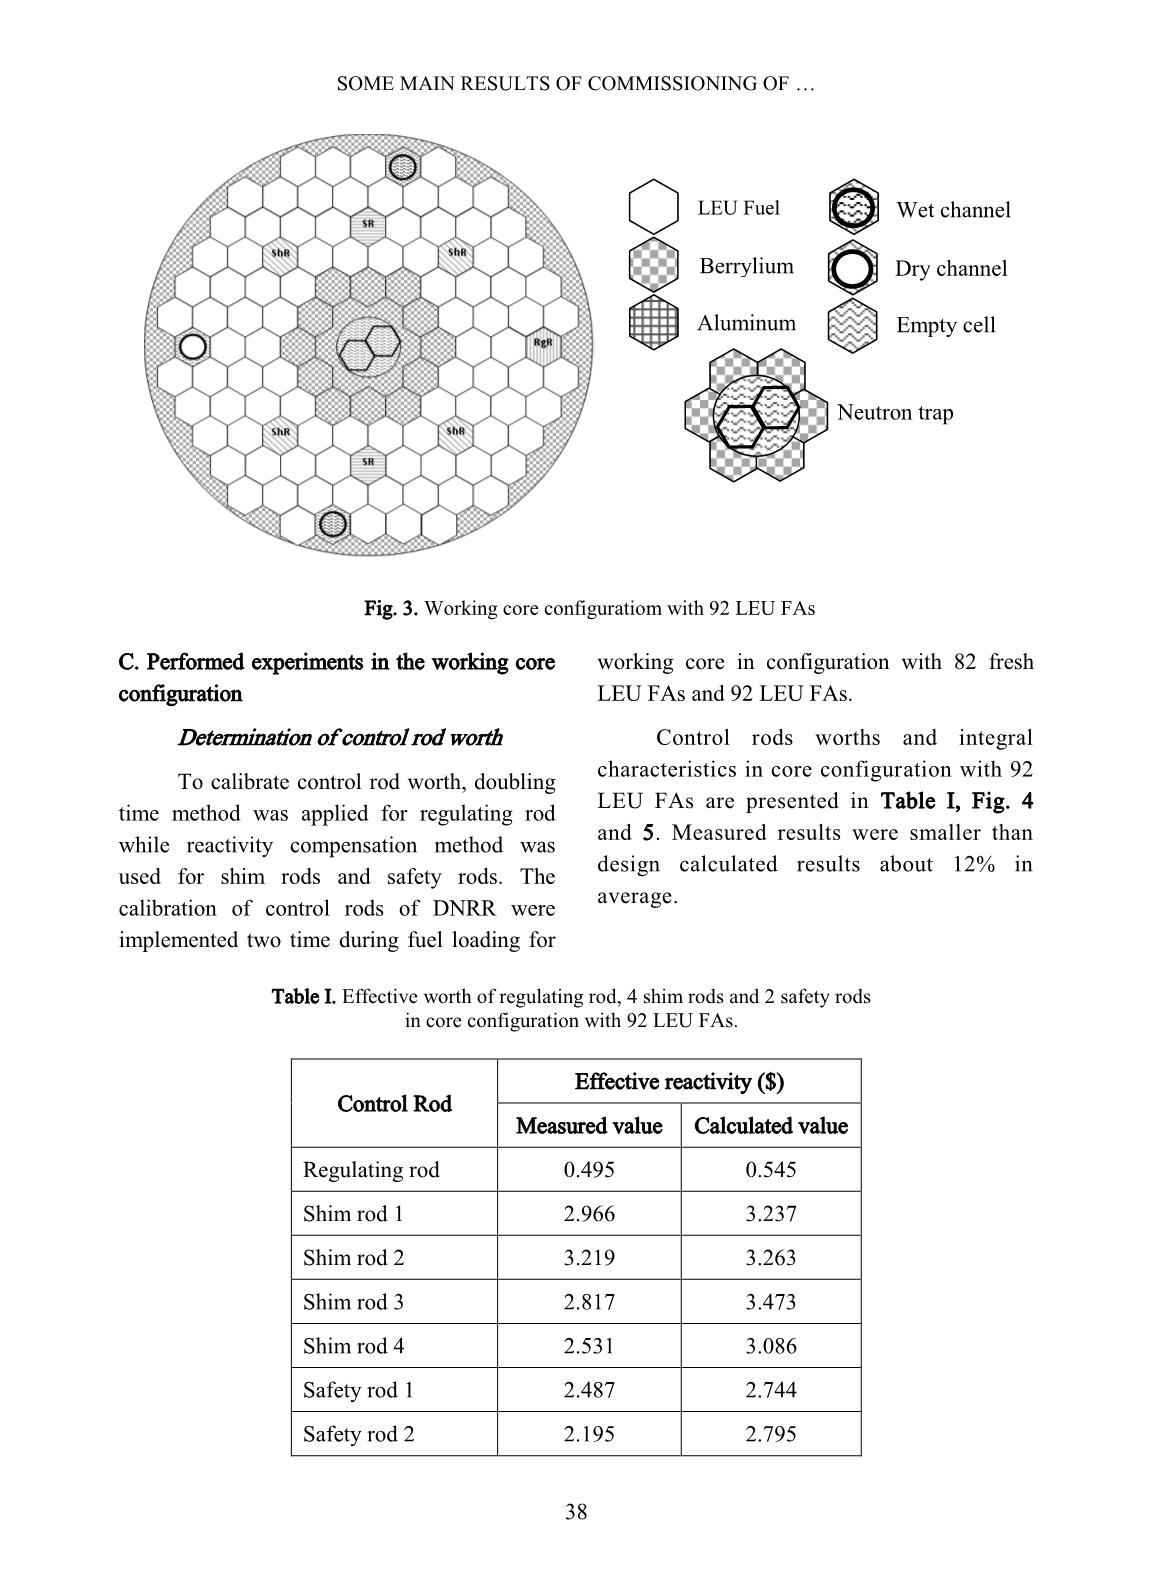
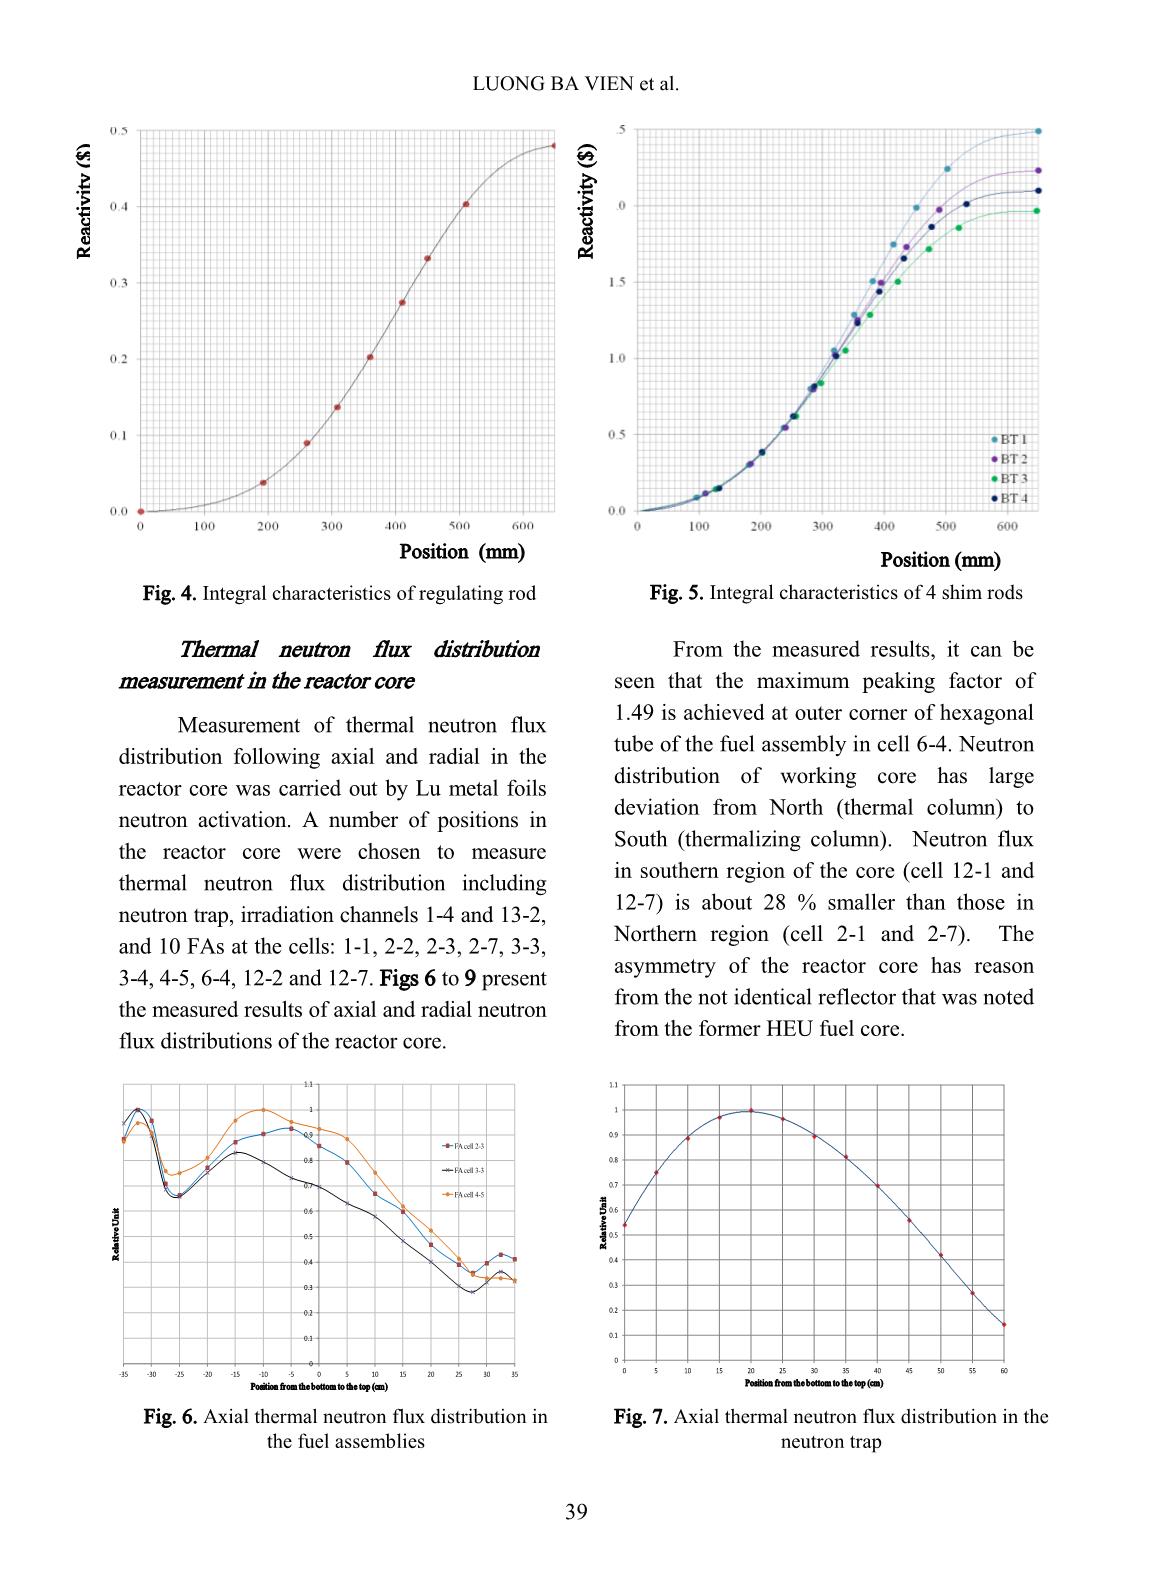
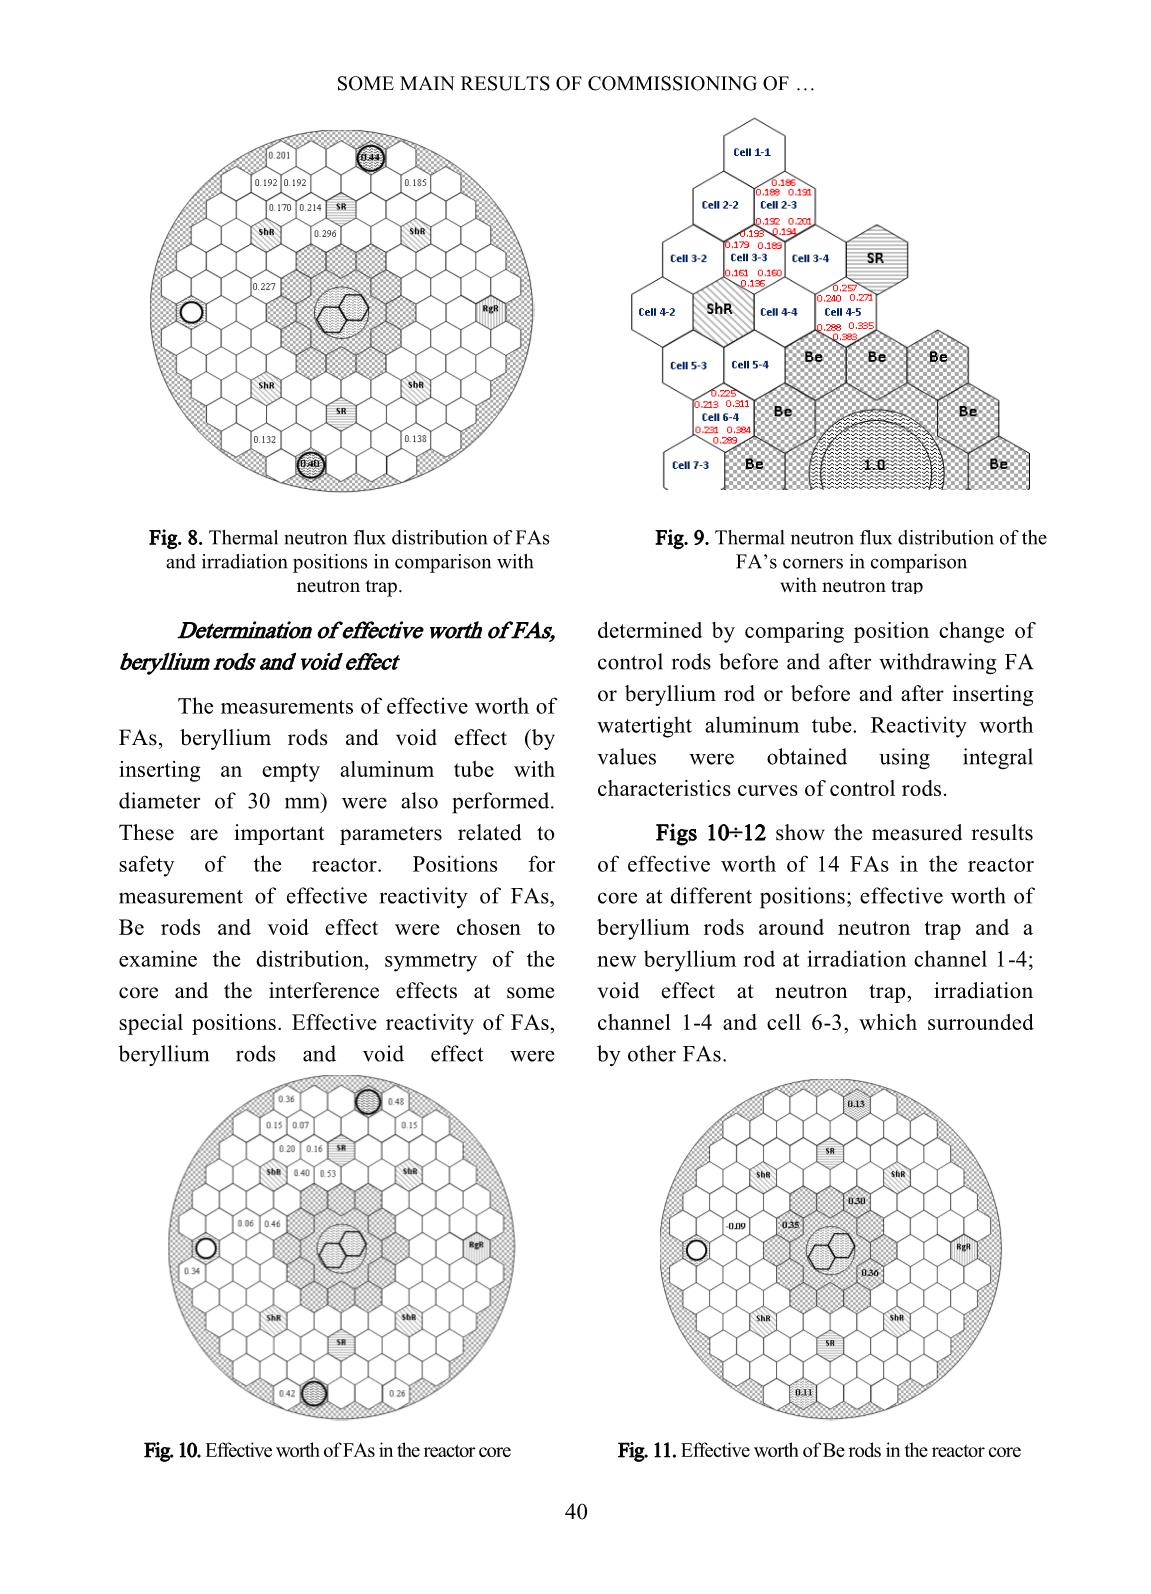
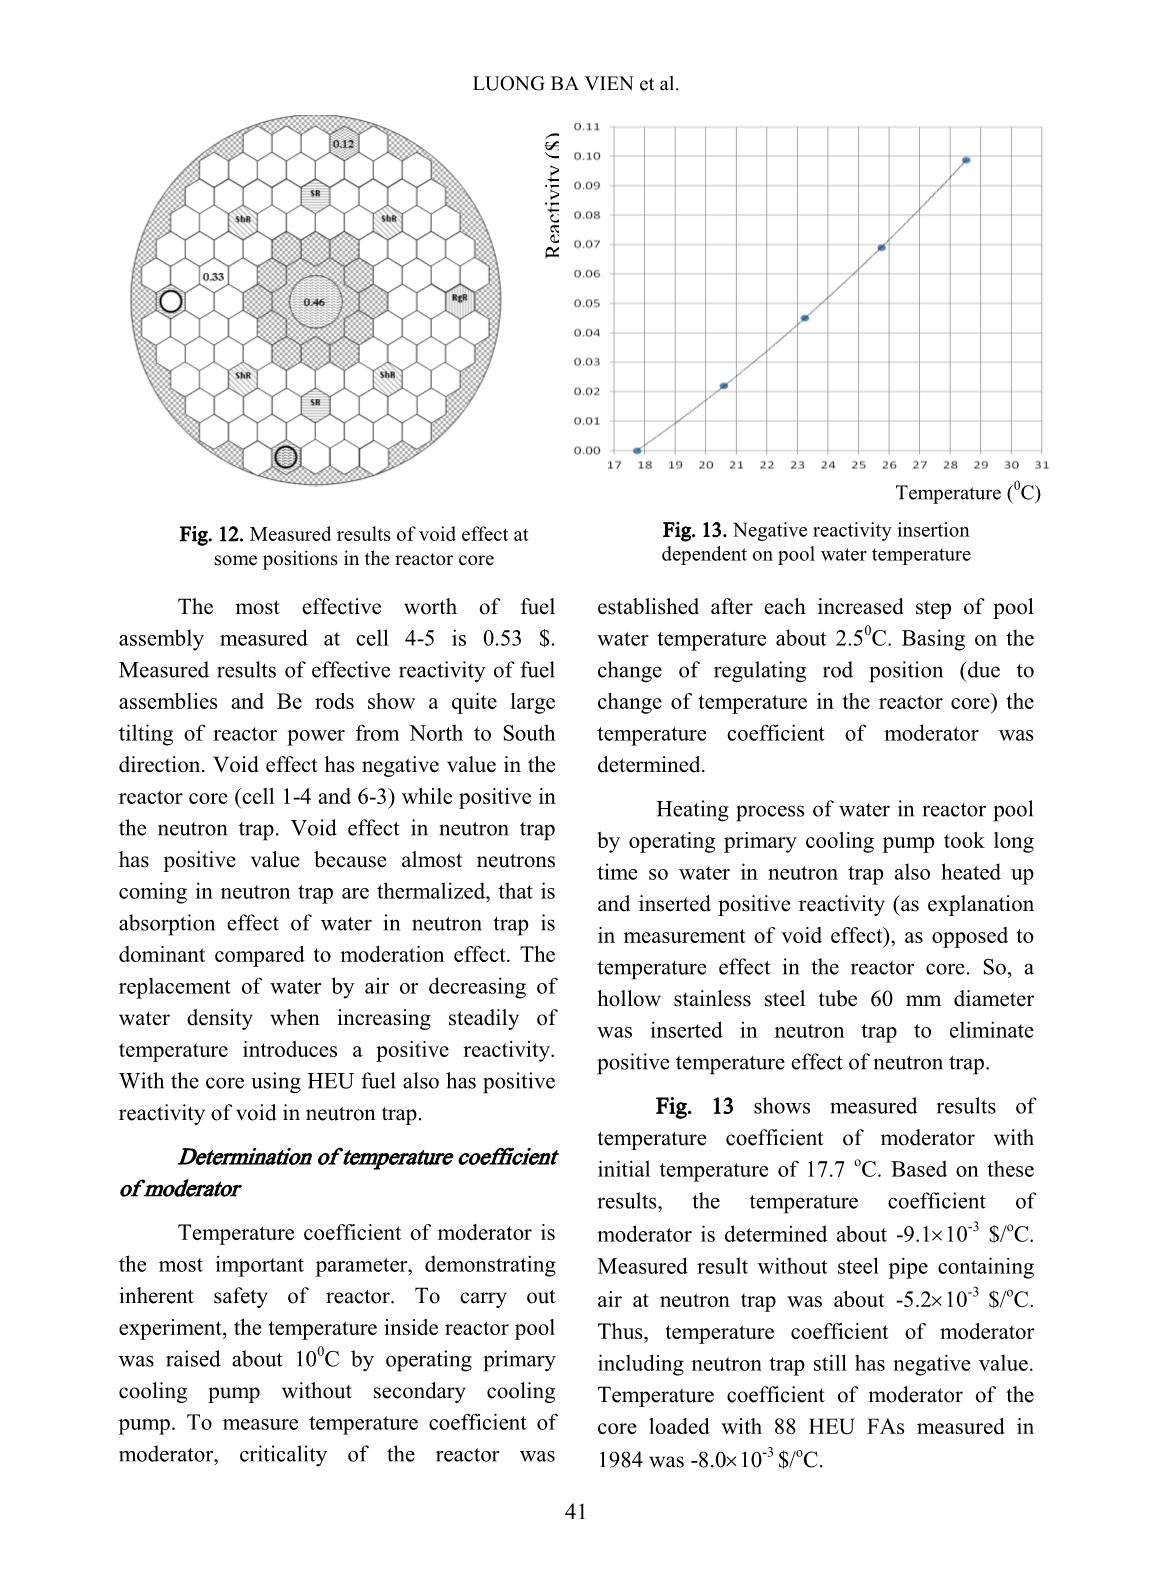
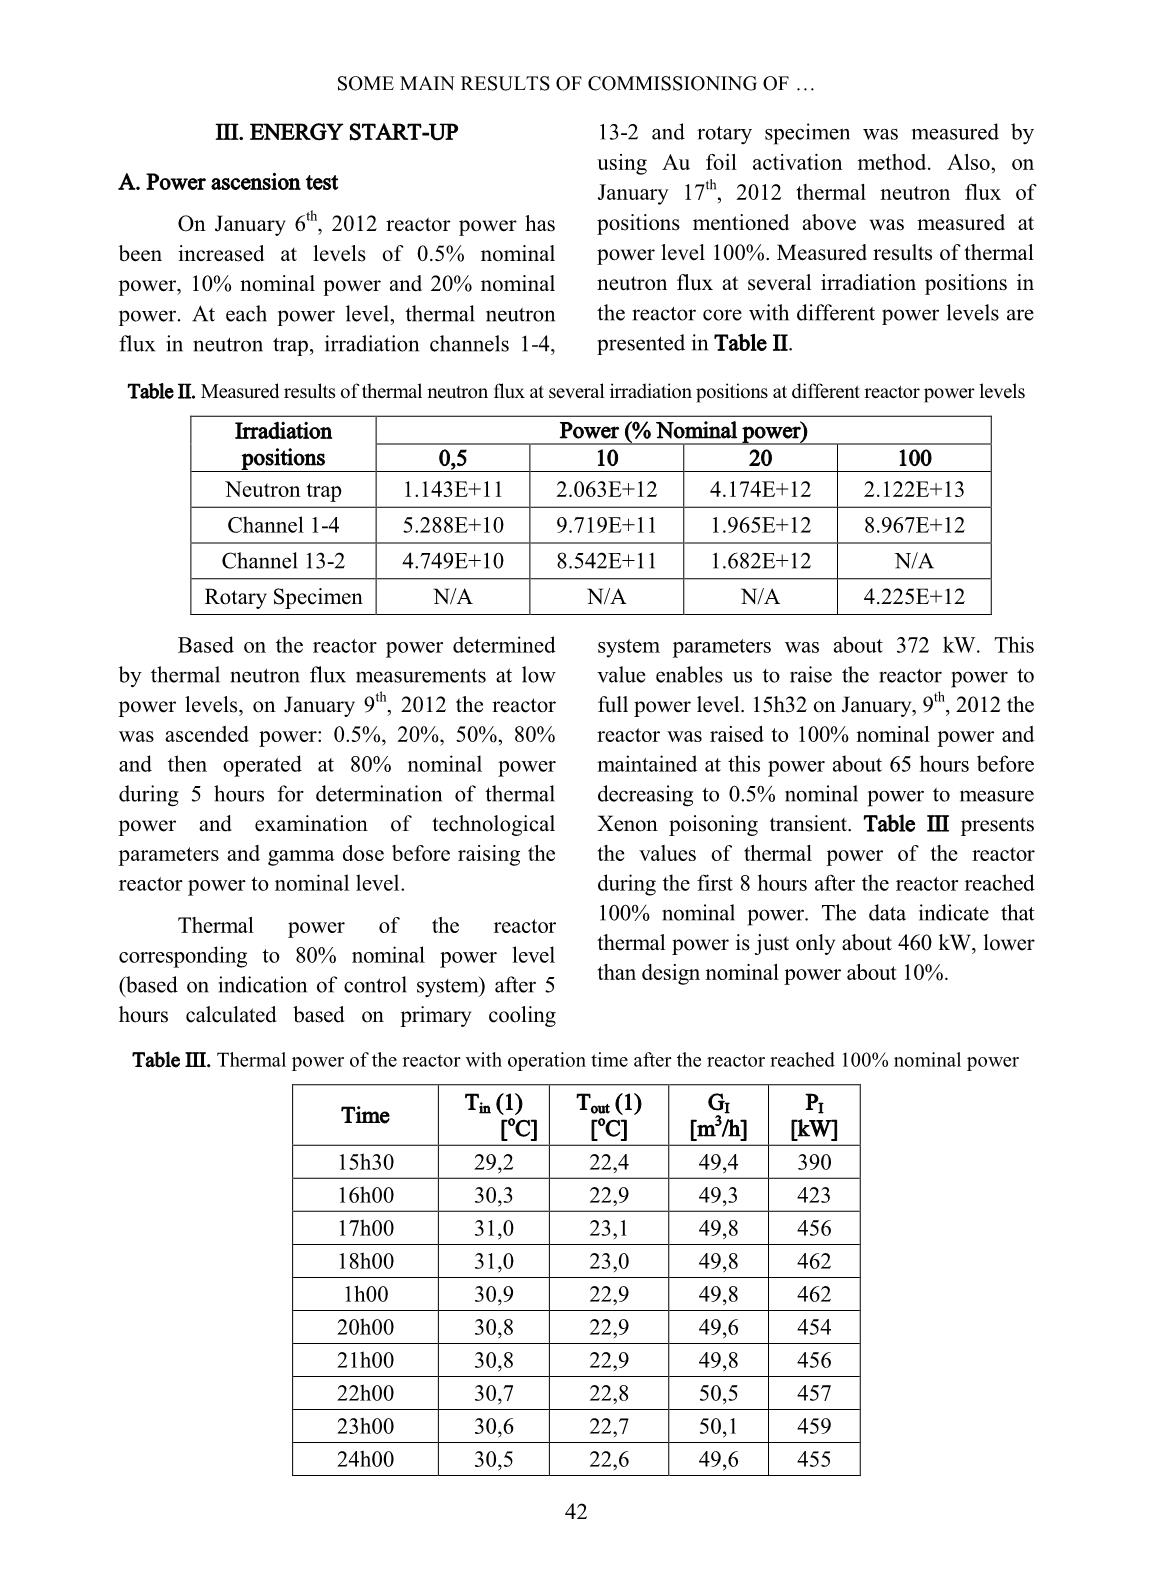
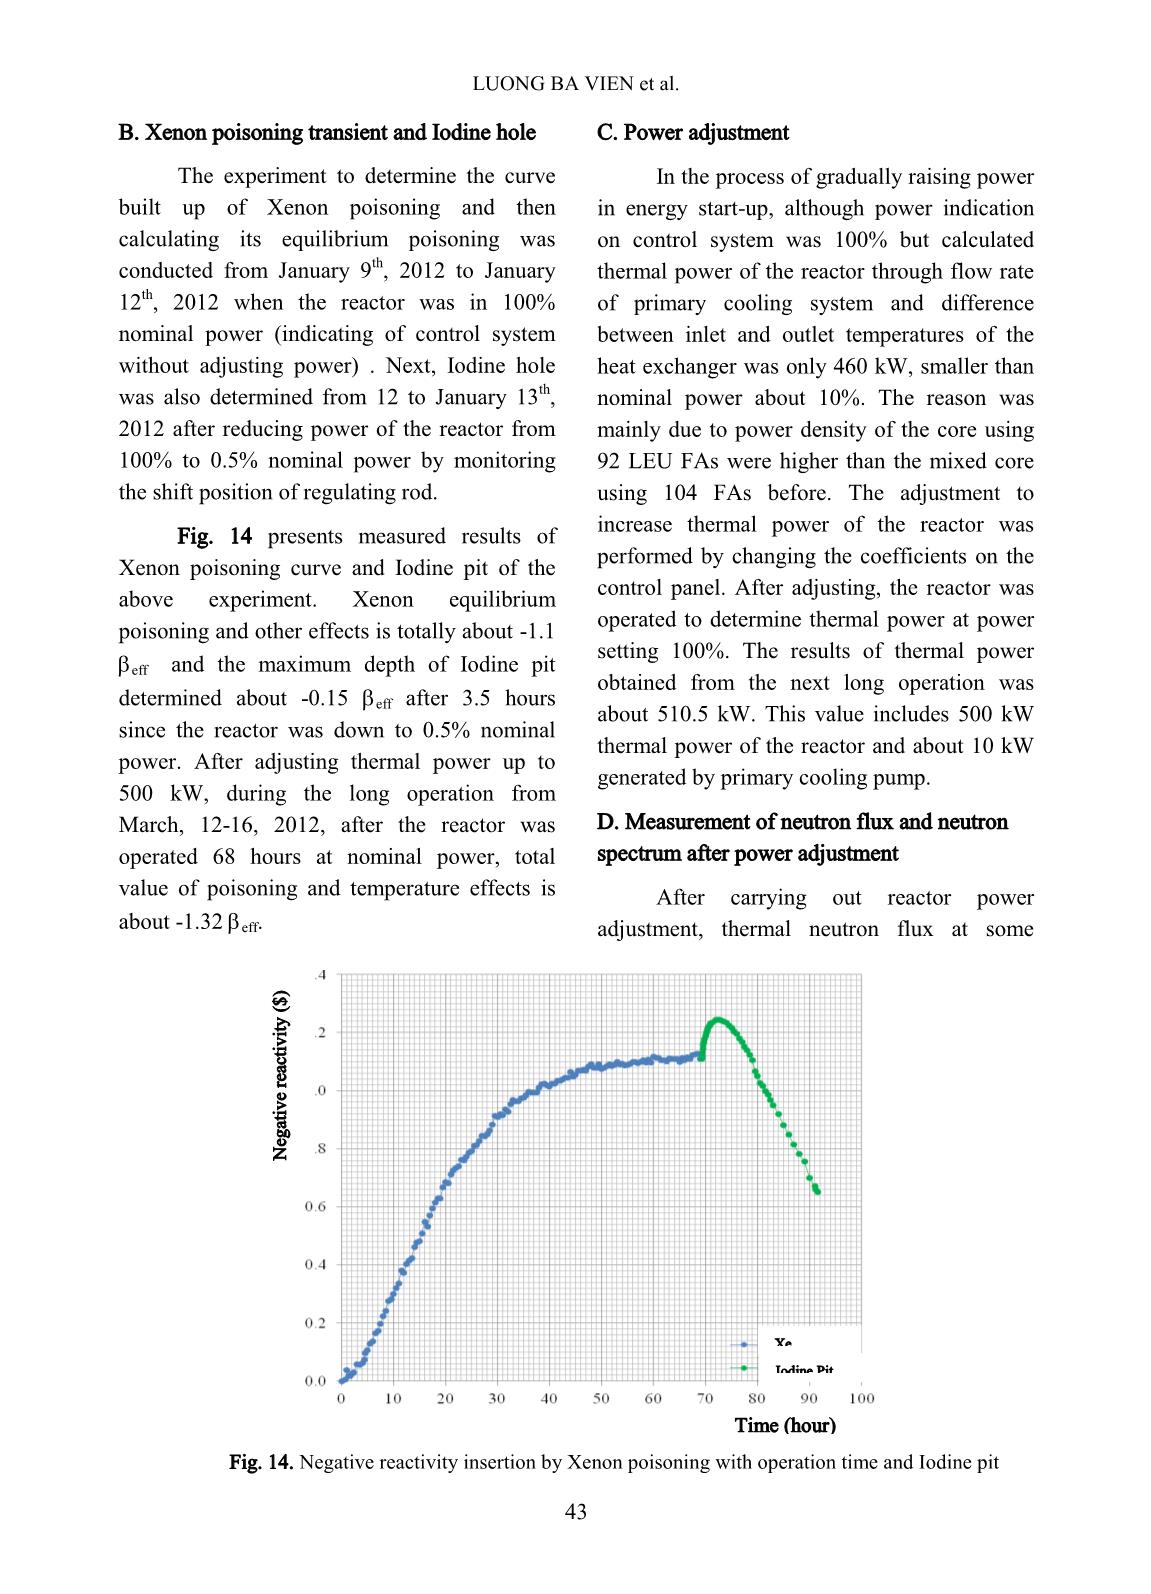
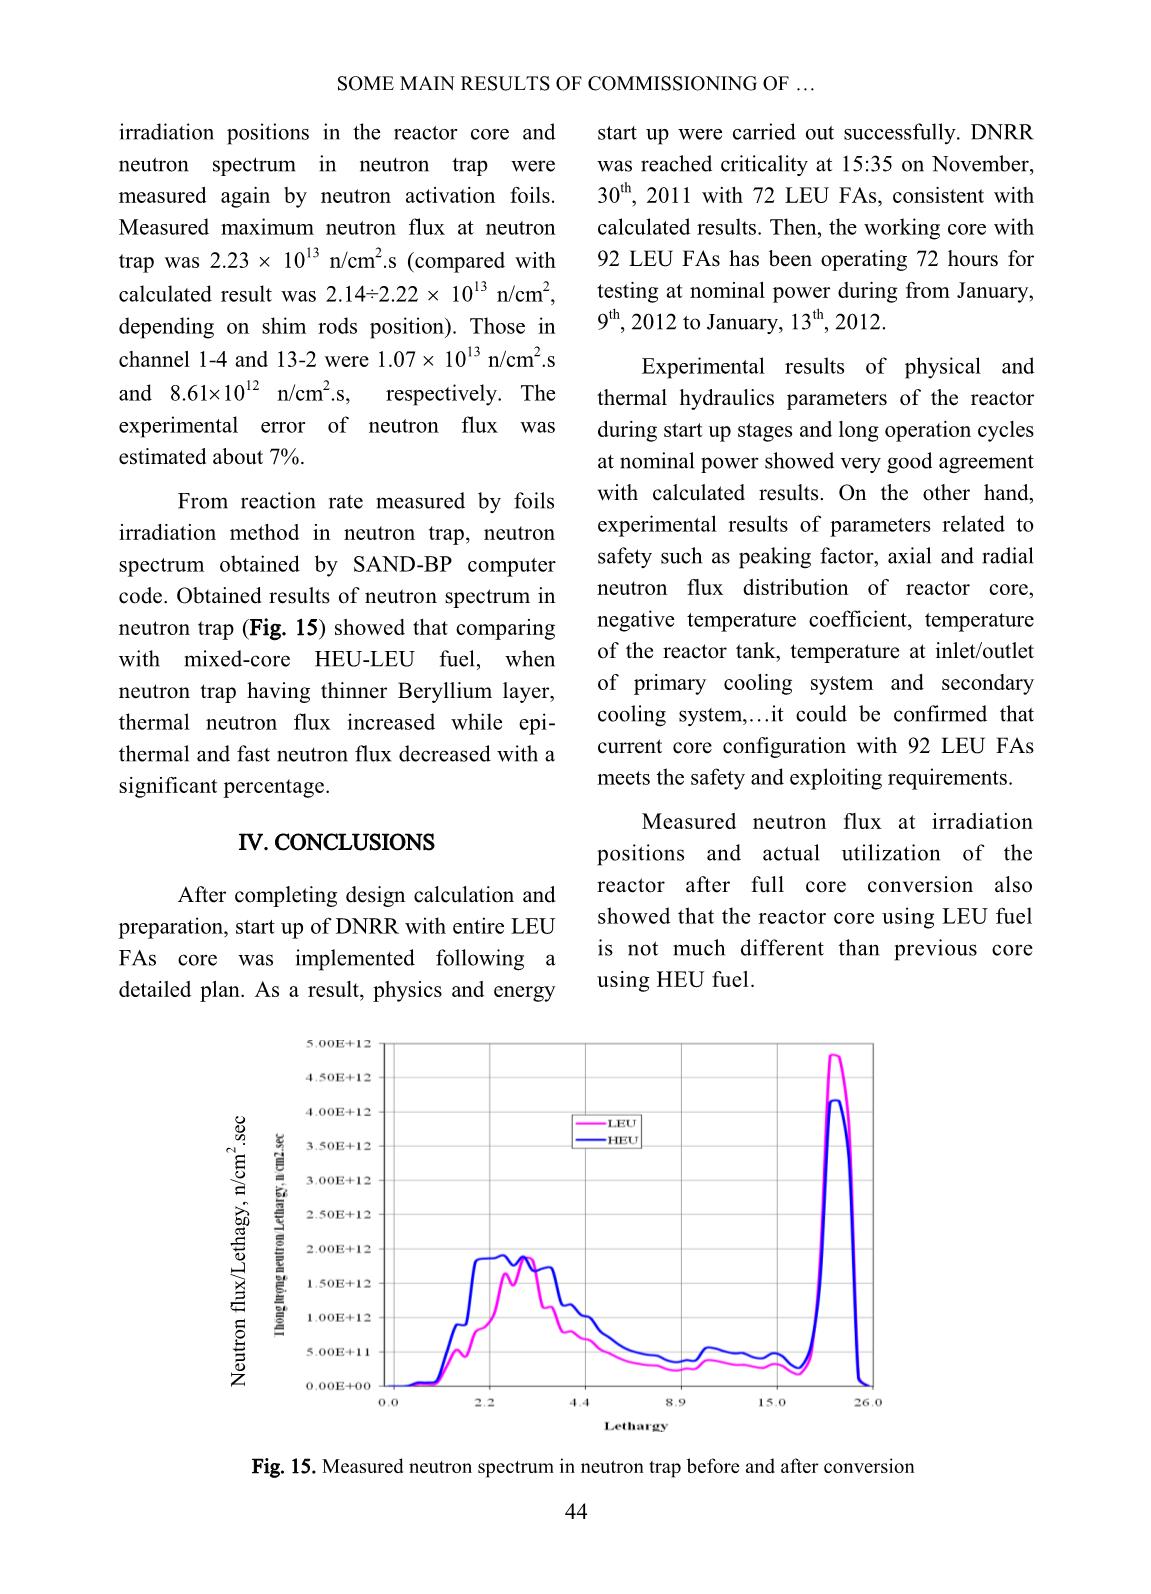
ut by Lu metal foils neutron activation. A number of positions in the reactor core were chosen to measure thermal neutron flux distribution including neutron trap, irradiation channels 1-4 and 13-2, and 10 FAs at the cells: 1-1, 2-2, 2-3, 2-7, 3-3, 3-4, 4-5, 6-4, 12-2 and 12-7. Figs 6 to 9 present the measured results of axial and radial neutron flux distributions of the reactor core. From the measured results, it can be seen that the maximum peaking factor of 1.49 is achieved at outer corner of hexagonal tube of the fuel assembly in cell 6-4. Neutron distribution of working core has large deviation from North (thermal column) to South (thermalizing column). Neutron flux in southern region of the core (cell 12-1 and 12-7) is about 28 % smaller than those in Northern region (cell 2-1 and 2-7). The asymmetry of the reactor core has reason from the not identical reflector that was noted from the former HEU fuel core. Position (mm) R ea ct iv it y ( $ ) Position (mm) R ea ct iv it y ( $ ) Fig. 4. Integral characteristics of regulating rod Fig. 5. Integral characteristics of 4 shim rods 0 0.1 0.2 0.3 0.4 0.5 0.6 0.7 0.8 0.9 1 1.1 -35 -30 -25 -20 -15 -10 -5 0 5 10 15 20 25 30 35 R e la ti v e U n it Position from the bottom to the top (cm) FA cell 2-3 FA cell 3-3 FA cell 4-5 0 0.1 0.2 0.3 0.4 0.5 0.6 0.7 0.8 0.9 1 1.1 0 5 10 15 20 25 30 35 40 45 50 55 60 R e la ti v e U n it Position from the bottom to the top (cm) Fig. 6. Axial thermal neutron flux distribution in the fuel assemblies Fig. 7. Axial thermal neutron flux distribution in the neutron trap SOME MAIN RESULTS OF COMMISSIONING OF 40 Determination of effective worth of FAs, beryllium rods and void effect The measurements of effective worth of FAs, beryllium rods and void effect (by inserting an empty aluminum tube with diameter of 30 mm) were also performed. These are important parameters related to safety of the reactor. Positions for measurement of effective reactivity of FAs, Be rods and void effect were chosen to examine the distribution, symmetry of the core and the interference effects at some special positions. Effective reactivity of FAs, beryllium rods and void effect were determined by comparing position change of control rods before and after withdrawing FA or beryllium rod or before and after inserting watertight aluminum tube. Reactivity worth values were obtained using integral characteristics curves of control rods. Figs 10÷12 show the measured results of effective worth of 14 FAs in the reactor core at different positions; effective worth of beryllium rods around neutron trap and a new beryllium rod at irradiation channel 1-4; void effect at neutron trap, irradiation channel 1-4 and cell 6-3, which surrounded by other FAs. Fig. 8. Thermal neutron flux distribution of FAs and irradiation positions in comparison with neutron trap. Fig. 9. Thermal neutron flux distribution of the FA’s corners in comparison with neutron trap Fig. 10. Effective worth of FAs in the reactor core Fig. 11. Effective worth of Be rods in the reactor core LUONG BA VIEN et al. 41 . The most effective worth of fuel assembly measured at cell 4-5 is 0.53 $. Measured results of effective reactivity of fuel assemblies and Be rods show a quite large tilting of reactor power from North to South direction. Void effect has negative value in the reactor core (cell 1-4 and 6-3) while positive in the neutron trap. Void effect in neutron trap has positive value because almost neutrons coming in neutron trap are thermalized, that is absorption effect of water in neutron trap is dominant compared to moderation effect. The replacement of water by air or decreasing of water density when increasing steadily of temperature introduces a positive reactivity. With the core using HEU fuel also has positive reactivity of void in neutron trap. Determination of temperature coefficient of moderator Temperature coefficient of moderator is the most important parameter, demonstrating inherent safety of reactor. To carry out experiment, the temperature inside reactor pool was raised about 10 0 C by operating primary cooling pump without secondary cooling pump. To measure temperature coefficient of moderator, criticality of the reactor was established after each increased step of pool water temperature about 2.5 0 C. Basing on the change of regulating rod position (due to change of temperature in the reactor core) the temperature coefficient of moderator was determined. Heating process of water in reactor pool by operating primary cooling pump took long time so water in neutron trap also heated up and inserted positive reactivity (as explanation in measurement of void effect), as opposed to temperature effect in the reactor core. So, a hollow stainless steel tube 60 mm diameter was inserted in neutron trap to eliminate positive temperature effect of neutron trap. Fig. 13 shows measured results of temperature coefficient of moderator with initial temperature of 17.7 o C. Based on these results, the temperature coefficient of moderator is determined about -9.1 10-3 $/oC. Measured result without steel pipe containing air at neutron trap was about -5.2 10-3 $/oC. Thus, temperature coefficient of moderator including neutron trap still has negative value. Temperature coefficient of moderator of the core loaded with 88 HEU FAs measured in 1984 was -8.0 10-3 $/oC. Fig. 12. Measured results of void effect at some positions in the reactor core Fig. 13. Negative reactivity insertion dependent on pool water temperature temperature Temperature ( 0 C) R ea ct iv it y ( $ ) SOME MAIN RESULTS OF COMMISSIONING OF 42 III. ENERGY START-UP A. Power ascension test On January 6 th , 2012 reactor power has been increased at levels of 0.5% nominal power, 10% nominal power and 20% nominal power. At each power level, thermal neutron flux in neutron trap, irradiation channels 1-4, 13-2 and rotary specimen was measured by using Au foil activation method. Also, on January 17 th , 2012 thermal neutron flux of positions mentioned above was measured at power level 100%. Measured results of thermal neutron flux at several irradiation positions in the reactor core with different power levels are presented in Table II. Table II. Measured results of thermal neutron flux at several irradiation positions at different reactor power levels Irradiation positions Power (% Nominal power) 0,5 10 20 100 Neutron trap 1.143E+11 2.063E+12 4.174E+12 2.122E+13 Channel 1-4 5.288E+10 9.719E+11 1.965E+12 8.967E+12 Channel 13-2 4.749E+10 8.542E+11 1.682E+12 N/A Rotary Specimen N/A N/A N/A 4.225E+12 Based on the reactor power determined by thermal neutron flux measurements at low power levels, on January 9 th , 2012 the reactor was ascended power: 0.5%, 20%, 50%, 80% and then operated at 80% nominal power during 5 hours for determination of thermal power and examination of technological parameters and gamma dose before raising the reactor power to nominal level. Thermal power of the reactor corresponding to 80% nominal power level (based on indication of control system) after 5 hours calculated based on primary cooling system parameters was about 372 kW. This value enables us to raise the reactor power to full power level. 15h32 on January, 9 th , 2012 the reactor was raised to 100% nominal power and maintained at this power about 65 hours before decreasing to 0.5% nominal power to measure Xenon poisoning transient. Table III presents the values of thermal power of the reactor during the first 8 hours after the reactor reached 100% nominal power. The data indicate that thermal power is just only about 460 kW, lower than design nominal power about 10%. Table III. Thermal power of the reactor with operation time after the reactor reached 100% nominal power Time Tin (1) [ o C] Tout (1) [ o C] GI [m 3 /h] PI [kW] 15h30 29,2 22,4 49,4 390 16h00 30,3 22,9 49,3 423 17h00 31,0 23,1 49,8 456 18h00 31,0 23,0 49,8 462 1h00 30,9 22,9 49,8 462 20h00 30,8 22,9 49,6 454 21h00 30,8 22,9 49,8 456 22h00 30,7 22,8 50,5 457 23h00 30,6 22,7 50,1 459 24h00 30,5 22,6 49,6 455 LUONG BA VIEN et al. 43 B. Xenon poisoning transient and Iodine hole The experiment to determine the curve built up of Xenon poisoning and then calculating its equilibrium poisoning was conducted from January 9 th , 2012 to January 12 th , 2012 when the reactor was in 100% nominal power (indicating of control system without adjusting power) . Next, Iodine hole was also determined from 12 to January 13 th , 2012 after reducing power of the reactor from 100% to 0.5% nominal power by monitoring the shift position of regulating rod. Fig. 14 presents measured results of Xenon poisoning curve and Iodine pit of the above experiment. Xenon equilibrium poisoning and other effects is totally about -1.1 eff and the maximum depth of Iodine pit determined about -0.15 eff after 3.5 hours since the reactor was down to 0.5% nominal power. After adjusting thermal power up to 500 kW, during the long operation from March, 12-16, 2012, after the reactor was operated 68 hours at nominal power, total value of poisoning and temperature effects is about -1.32 eff. C. Power adjustment In the process of gradually raising power in energy start-up, although power indication on control system was 100% but calculated thermal power of the reactor through flow rate of primary cooling system and difference between inlet and outlet temperatures of the heat exchanger was only 460 kW, smaller than nominal power about 10%. The reason was mainly due to power density of the core using 92 LEU FAs were higher than the mixed core using 104 FAs before. The adjustment to increase thermal power of the reactor was performed by changing the coefficients on the control panel. After adjusting, the reactor was operated to determine thermal power at power setting 100%. The results of thermal power obtained from the next long operation was about 510.5 kW. This value includes 500 kW thermal power of the reactor and about 10 kW generated by primary cooling pump. D. Measurement of neutron flux and neutron spectrum after power adjustment After carrying out reactor power adjustment, thermal neutron flux at some Xe poisonning Iodine Pit PpppPithole Time (hour) N eg at iv e re ac ti v it y ( $ ) Fig. 14. Negative reactivity insertion by Xenon poisoning with operation time and Iodine pit SOME MAIN RESULTS OF COMMISSIONING OF 44 irradiation positions in the reactor core and neutron spectrum in neutron trap were measured again by neutron activation foils. Measured maximum neutron flux at neutron trap was 2.23 1013 n/cm2.s (compared with calculated result was 2.14÷2.22 1013 n/cm2, depending on shim rods position). Those in channel 1-4 and 13-2 were 1.07 1013 n/cm2.s and 8.61 1012 n/cm2.s, respectively. The experimental error of neutron flux was estimated about 7%. From reaction rate measured by foils irradiation method in neutron trap, neutron spectrum obtained by SAND-BP computer code. Obtained results of neutron spectrum in neutron trap (Fig. 15) showed that comparing with mixed-core HEU-LEU fuel, when neutron trap having thinner Beryllium layer, thermal neutron flux increased while epi- thermal and fast neutron flux decreased with a significant percentage. IV. CONCLUSIONS After completing design calculation and preparation, start up of DNRR with entire LEU FAs core was implemented following a detailed plan. As a result, physics and energy start up were carried out successfully. DNRR was reached criticality at 15:35 on November, 30 th , 2011 with 72 LEU FAs, consistent with calculated results. Then, the working core with 92 LEU FAs has been operating 72 hours for testing at nominal power during from January, 9 th , 2012 to January, 13 th , 2012. Experimental results of physical and thermal hydraulics parameters of the reactor during start up stages and long operation cycles at nominal power showed very good agreement with calculated results. On the other hand, experimental results of parameters related to safety such as peaking factor, axial and radial neutron flux distribution of reactor core, negative temperature coefficient, temperature of the reactor tank, temperature at inlet/outlet of primary cooling system and secondary cooling system,it could be confirmed that current core configuration with 92 LEU FAs meets the safety and exploiting requirements. Measured neutron flux at irradiation positions and actual utilization of the reactor after full core conversion also showed that the reactor core using LEU fuel is not much different than previous core using HEU fuel. Fig. 15. Measured neutron spectrum in neutron trap before and after conversion N eu tr o n f lu x /L et h ag y , n /c m 2 .s ec LUONG BA VIEN et al. 45 ACKNOWLEDGMENTS The NRI’s staffs that performed start up work of DNRR with entire LEU fuel core would like to express sincere gratitude to the leadership of Ministry of Science and Technology, Vietnam Atomic Energy Institute, Vietnam Agency for Radiation and Nuclear Safety, who have regularly regarded, guided and created the best condition for us to implement our works. We also express our thanks to Argonne National Laboratory and experts from RERTR program (Reduced Enrichment for Research and Test Reactors) and specialists, professionals in program RRRFR (Russian Research Reactor Fuel Return) has supported in finance as well as useful discussions during design calculation of full core conversion, upgrading equipments and carrying out start up of DNRR. REFERENCE [1] P. V. Lam, N. N. Dien, L. V. Vinh, H. T. Nghiem, L. B. Vien, N. K. Cuong, “Neutronics and Thermal Hydraulics Calculation for Full Core Conversion from HEU to LEU of the Dalat Nuclear Research Reactor”, RERTR Int’l Meeting, Lisbon, Portugal, 2010. [2] L. B. Vien, L. V. Vinh, H. T. Nghiem, N. K. Cuong, “Transient Analyses for Full Core Conversion from HEU to LEU of the Dalat Nuclear Research Reactor”, RERTR Int’l Meeting, Lisbon, Portugal, 2010. [3] “Process of physics and energy start up for full core conversion using LEU fuel of the Dalat Nuclear Research Reactor”, Nuclear Research Institute, 2011. [4] “Operation logbook of DNRR”, 2011-2012
File đính kèm:
 some_main_results_of_commissioning_of_the_dalat_research_rea.pdf

