Phương pháp phát hiện và đánh giá hư hại gấp nếp cho hệ thống kiểm tra chất lượng đường ray cao tốc
Ngành vận tải đường sắt giữ vai trò quan trọng trong nền kinh tế bởi khả năng vận chuyển khối lượng
hành khách và hàng hóa lớn với khoảng cách rất xa. Do vậy, việc đảm bảo an toàn cho các tuyến đường
sắt luôn được chú trọng. Sự phát triển của ngành thị giác máy tính giúp cho việc kiểm tra không phá hủy
trở nên khả thi. Tuy nhiên, các hệ thống kiểm tra đường ray dựa trên thị giác máy tính vẫn gặp những
trở ngại lớn từ nhiễu môi trường xung quanh và tính chất của các loại hư hại trên mặt ray. Những hư
hỏng xuất hiện trên đường ray cao tốc rất nhiều loại, trong đó loại gấp nếp có hình dạng, kích thước
thay đổi phức tạp. Về bản chất, loại hư hại này thường có màu sáng, có đổ bóng trải dọc theo chiều dài
ray. Do đó, phương pháp đơn giản và hiệu quả nhất phát hiện hư hại loại này là dựa trên mức xám cục
bộ. Bài báo này đề xuất phương pháp phát hiện và đánh giá những hư hỏng gấp nếp chủ yếu dựa trên
đường cong histogram trên cả hai hướng dọc và ngang. Các hư hại sơ bộ thu được từ quá trình phân
tích trên được kết hợp lại trong ảnh duy nhất để loại trừ nhiễu và hư hại giả. Những hư hại trên ảnh kết
quả được phân làm hai loại chính để đánh giá mức độ nguy hiểm của hư hại. Kết quả thực nghiệm cho
thấy, độ chính xác phát hiện ray có hư hại đạt 98,9% và phân loại đúng hư hại đạt 97,5%.
Trang 1
Trang 2
Trang 3
Trang 4
Trang 5
Trang 6
Trang 7
Trang 8

Trang 9
Tóm tắt nội dung tài liệu: Phương pháp phát hiện và đánh giá hư hại gấp nếp cho hệ thống kiểm tra chất lượng đường ray cao tốc
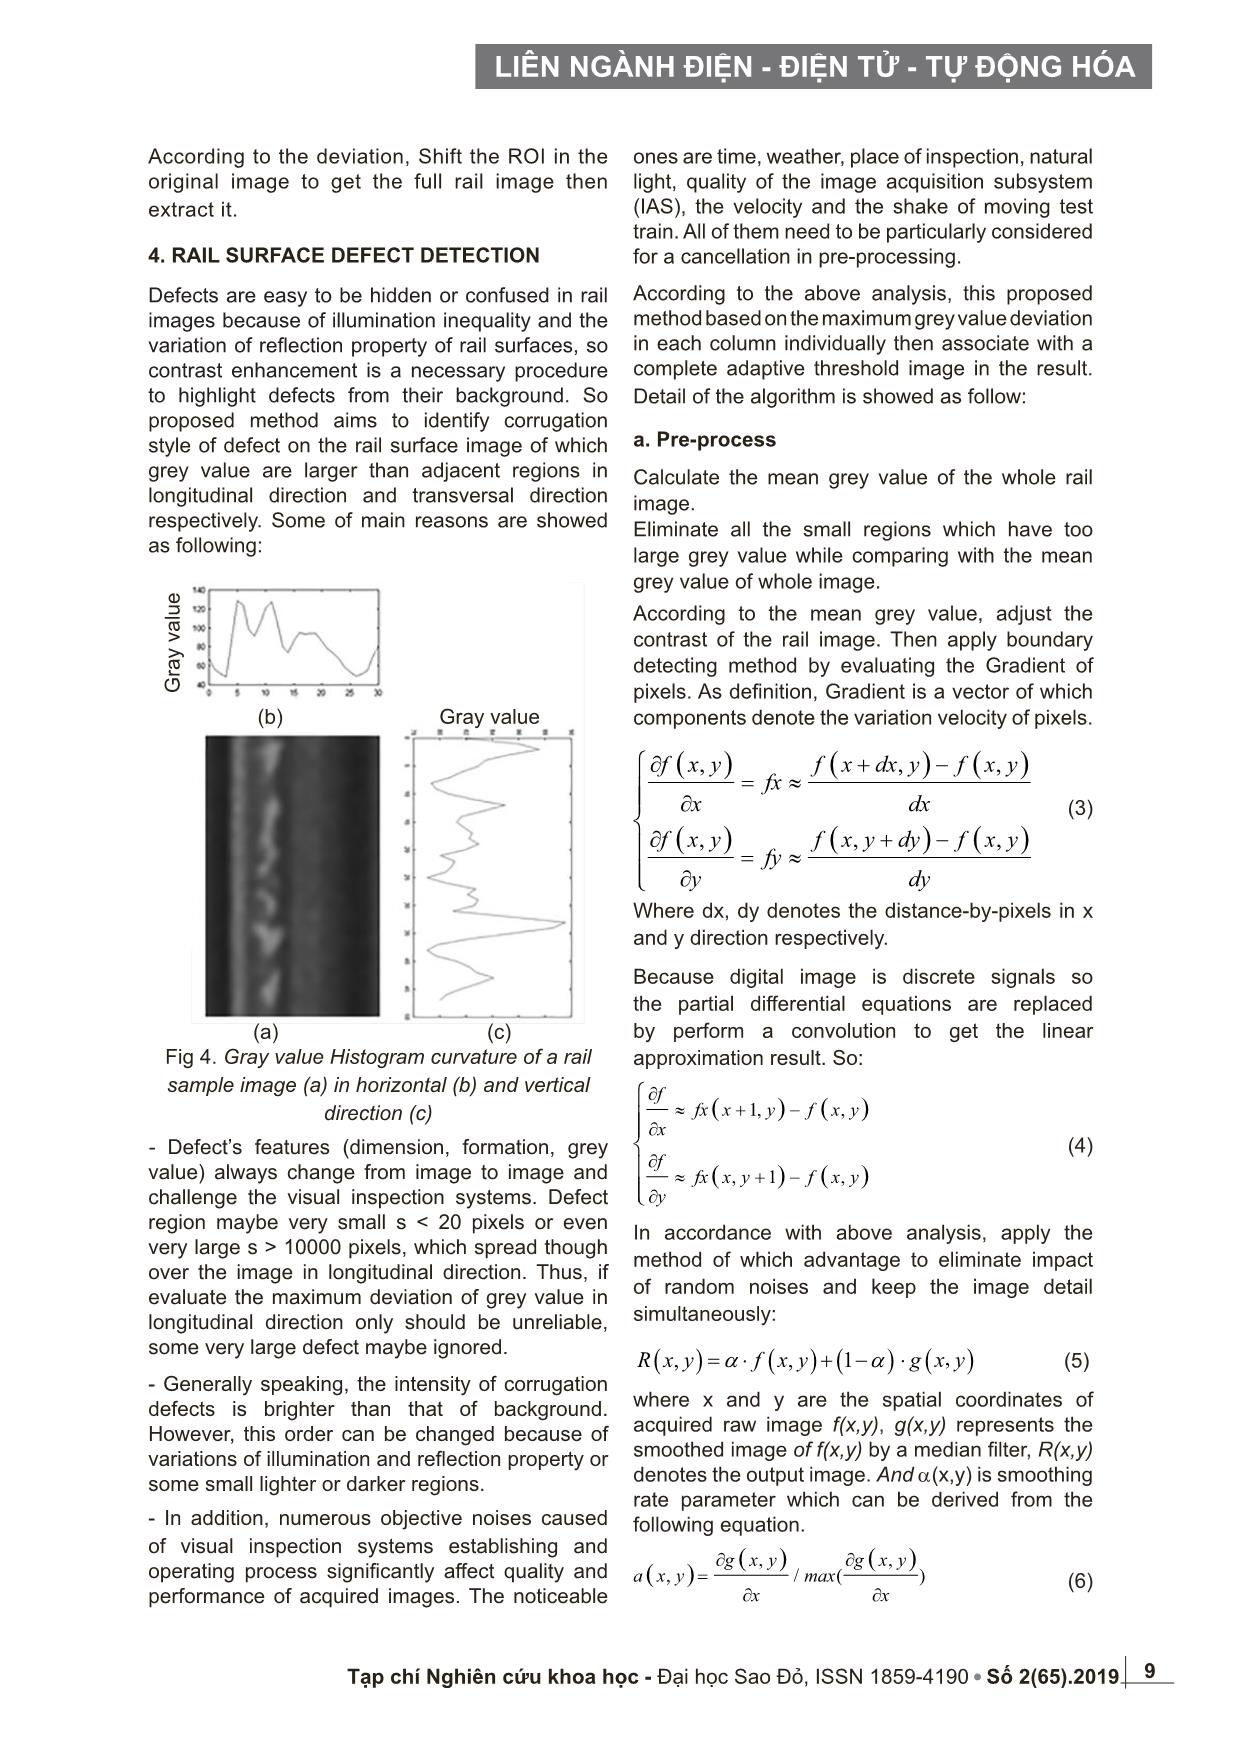
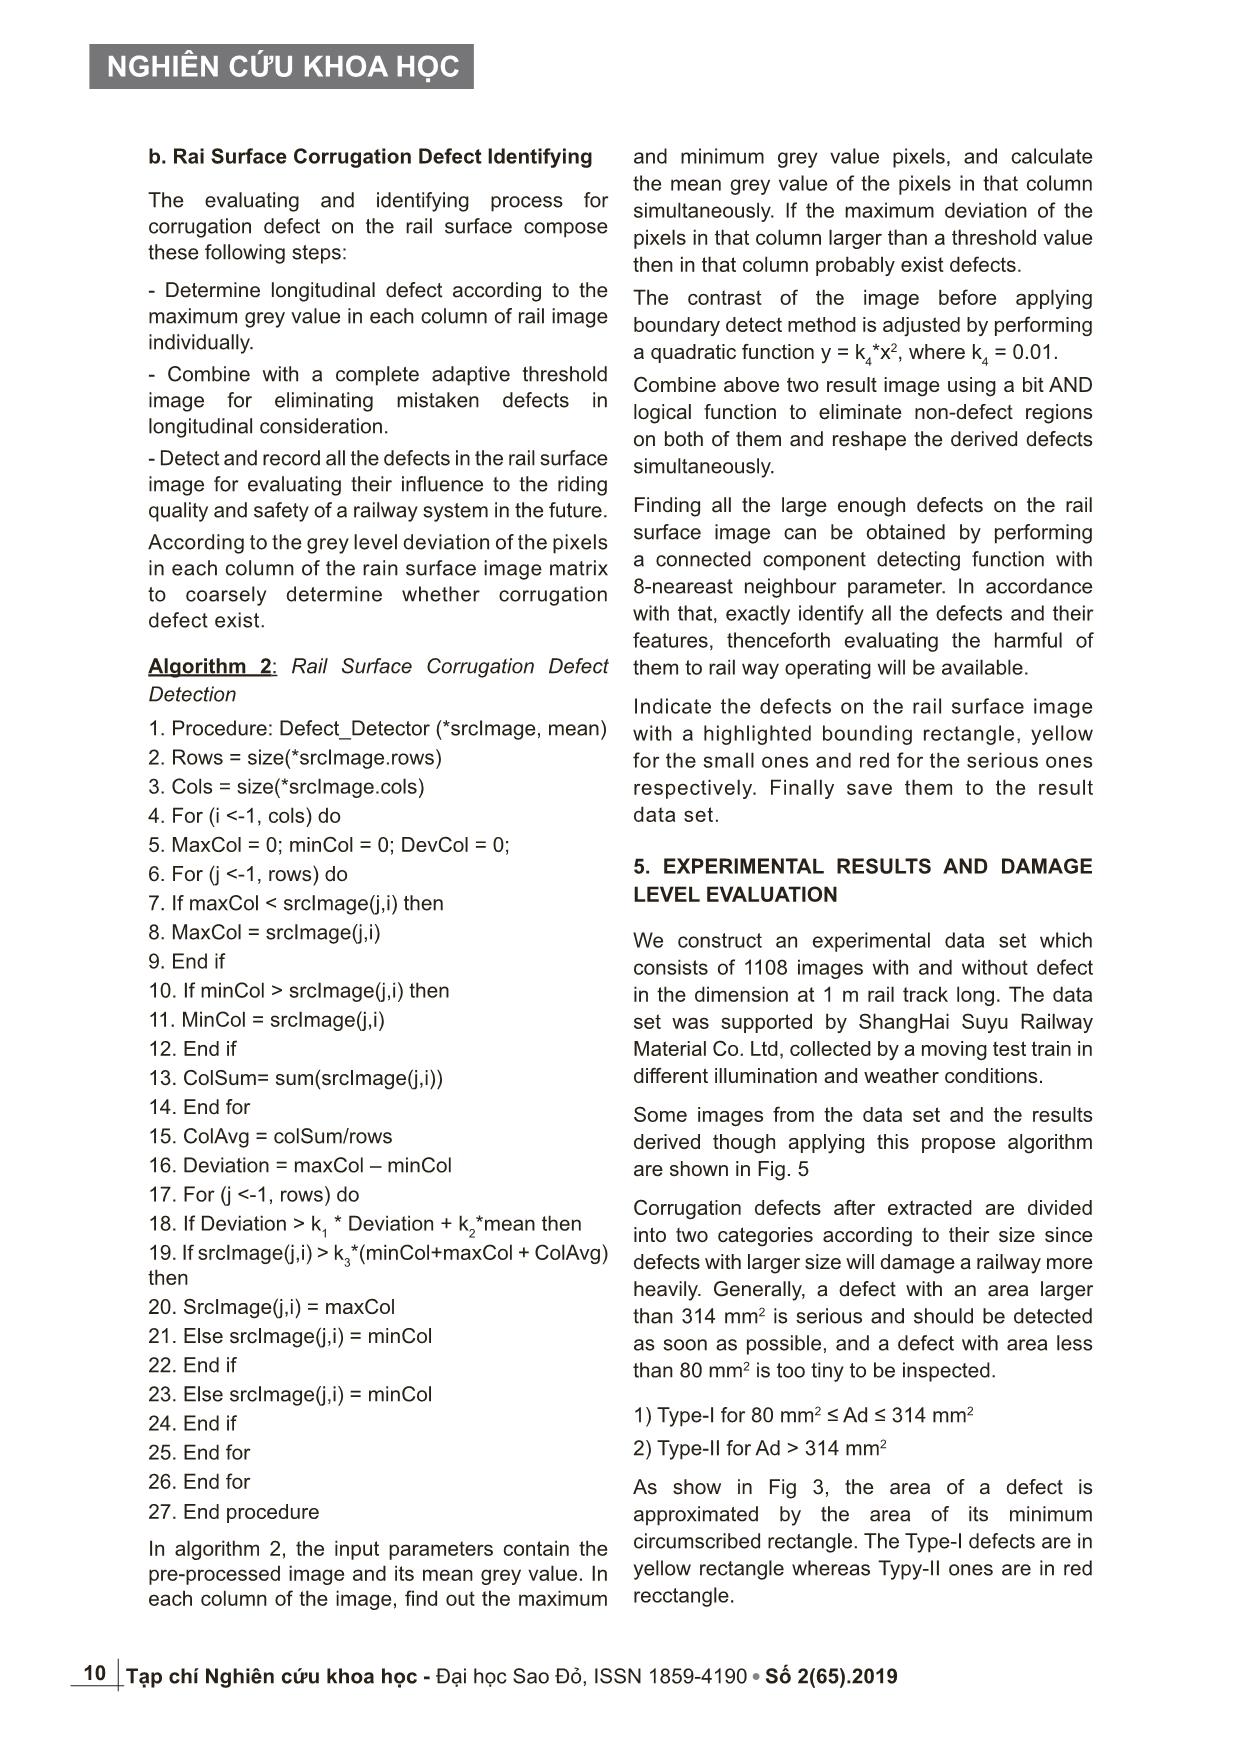
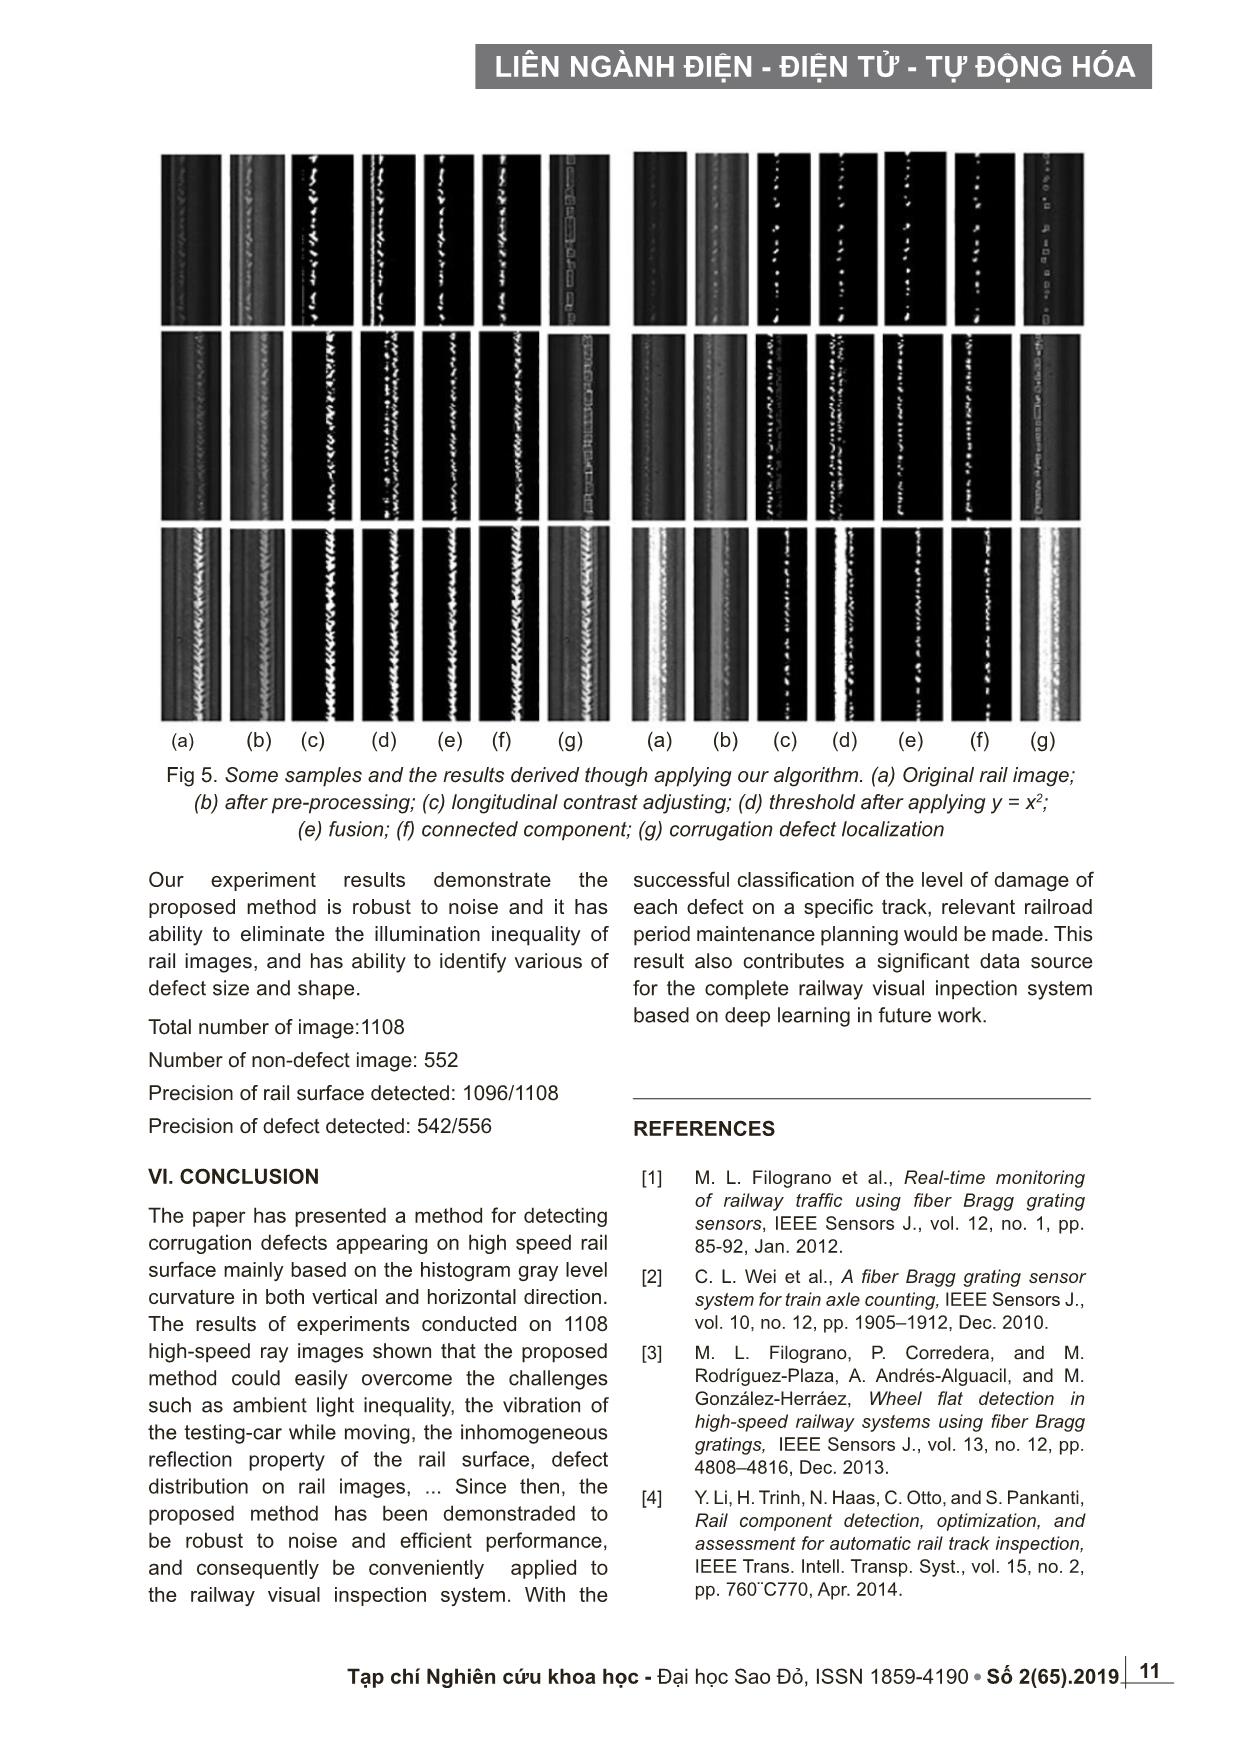
e image of rail track. Rail Image Complete adaptive threshold Fusion image Longitudinal defect Determine Preprocess 9LIÊN NGÀNH ĐIỆN - ĐIỆN TỬ - TỰ ĐỘNG HÓA Tạp chí Nghiên cứu khoa học - Đại học Sao Đỏ, ISSN 1859-4190 Số 2(65).2019 According to the deviation, Shift the ROI in the original image to get the full rail image then extract it. 4. RAIL SURFACE DEFECT DETECTION Defects are easy to be hidden or confused in rail images because of illumination inequality and the variation of reflection property of rail surfaces, so contrast enhancement is a necessary procedure to highlight defects from their background. So proposed method aims to identify corrugation style of defect on the rail surface image of which grey value are larger than adjacent regions in longitudinal direction and transversal direction respectively. Some of main reasons are showed as following: Fig 4. Gray value Histogram curvature of a rail sample image (a) in horizontal (b) and vertical direction (c) - Defect’s features (dimension, formation, grey value) always change from image to image and challenge the visual inspection systems. Defect region maybe very small s < 20 pixels or even very large s > 10000 pixels, which spread though over the image in longitudinal direction. Thus, if evaluate the maximum deviation of grey value in longitudinal direction only should be unreliable, some very large defect maybe ignored. - Generally speaking, the intensity of corrugation defects is brighter than that of background. However, this order can be changed because of variations of illumination and reflection property or some small lighter or darker regions. - In addition, numerous objective noises caused of visual inspection systems establishing and operating process significantly affect quality and performance of acquired images. The noticeable ones are time, weather, place of inspection, natural light, quality of the image acquisition subsystem (IAS), the velocity and the shake of moving test train. All of them need to be particularly considered for a cancellation in pre-processing. According to the above analysis, this proposed method based on the maximum grey value deviation in each column individually then associate with a complete adaptive threshold image in the result. Detail of the algorithm is showed as follow: a. Pre-process Calculate the mean grey value of the whole rail image. Eliminate all the small regions which have too large grey value while comparing with the mean grey value of whole image. According to the mean grey value, adjust the contrast of the rail image. Then apply boundary detecting method by evaluating the Gradient of pixels. As definition, Gradient is a vector of which components denote the variation velocity of pixels. (3) Where dx, dy denotes the distance-by-pixels in x and y direction respectively. Because digital image is discrete signals so the partial differential equations are replaced by perform a convolution to get the linear approximation result. So: (4) In accordance with above analysis, apply the method of which advantage to eliminate impact of random noises and keep the image detail simultaneously: where x and y are the spatial coordinates of acquired raw image f(x,y), g(x,y) represents the smoothed image of f(x,y) by a median filter, R(x,y) denotes the output image. And α(x,y) is smoothing rate parameter which can be derived from the following equation. (6) (a) (c) (b) Gray value Gr ay va lue ( ) ( ) ( ) ( ) ( ) ( ) , , , , , , f x y f x dx y f x y fx x dx f x y f x y dy f x y fy y dy ∂ + − = ≈ ∂ ∂ + − = ≈ ∂ ( ) ( ) ( ) ( ) 1, , , 1 , f fx x y f x y x f fx x y f x y y ∂ ≈ + − ∂ ∂ ≈ + − ∂ ( ) ( ) ( ) ( ) , , 1R x y f x yα α= ⋅ + − ( ) ,g x y⋅ (5) ( ) ( ) ( ), , , / ( ) g x y g x y a x y max x x ∂ ∂ = ∂ ∂ 10 NGHIÊN CỨU KHOA HỌC Tạp chí Nghiên cứu khoa học - Đại học Sao Đỏ, ISSN 1859-4190 Số 2(65).2019 b. Rai Surface Corrugation Defect Identifying The evaluating and identifying process for corrugation defect on the rail surface compose these following steps: - Determine longitudinal defect according to the maximum grey value in each column of rail image individually. - Combine with a complete adaptive threshold image for eliminating mistaken defects in longitudinal consideration. - Detect and record all the defects in the rail surface image for evaluating their influence to the riding quality and safety of a railway system in the future. According to the grey level deviation of the pixels in each column of the rain surface image matrix to coarsely determine whether corrugation defect exist. Algorithm 2: Rail Surface Corrugation Defect Detection 1. Procedure: Defect_Detector (*srcImage, mean) 2. Rows = size(*srcImage.rows) 3. Cols = size(*srcImage.cols) 4. For (i <-1, cols) do 5. MaxCol = 0; minCol = 0; DevCol = 0; 6. For (j <-1, rows) do 7. If maxCol < srcImage(j,i) then 8. MaxCol = srcImage(j,i) 9. End if 10. If minCol > srcImage(j,i) then 11. MinCol = srcImage(j,i) 12. End if 13. ColSum= sum(srcImage(j,i)) 14. End for 15. ColAvg = colSum/rows 16. Deviation = maxCol – minCol 17. For (j <-1, rows) do 18. If Deviation > k 1 * Deviation + k 2 *mean then 19. If srcImage(j,i) > k 3 *(minCol+maxCol + ColAvg) then 20. SrcImage(j,i) = maxCol 21. Else srcImage(j,i) = minCol 22. End if 23. Else srcImage(j,i) = minCol 24. End if 25. End for 26. End for 27. End procedure In algorithm 2, the input parameters contain the pre-processed image and its mean grey value. In each column of the image, find out the maximum and minimum grey value pixels, and calculate the mean grey value of the pixels in that column simultaneously. If the maximum deviation of the pixels in that column larger than a threshold value then in that column probably exist defects. The contrast of the image before applying boundary detect method is adjusted by performing a quadratic function y = k4*x2, where k4 = 0.01. Combine above two result image using a bit AND logical function to eliminate non-defect regions on both of them and reshape the derived defects simultaneously. Finding all the large enough defects on the rail surface image can be obtained by performing a connected component detecting function with 8-neareast neighbour parameter. In accordance with that, exactly identify all the defects and their features, thenceforth evaluating the harmful of them to rail way operating will be available. Indicate the defects on the rail surface image with a highlighted bounding rectangle, yellow for the small ones and red for the serious ones respectively. Finally save them to the result data set. 5. EXPERIMENTAL RESULTS AND DAMAGE LEVEL EVALUATION We construct an experimental data set which consists of 1108 images with and without defect in the dimension at 1 m rail track long. The data set was supported by ShangHai Suyu Railway Material Co. Ltd, collected by a moving test train in different illumination and weather conditions. Some images from the data set and the results derived though applying this propose algorithm are shown in Fig. 5 Corrugation defects after extracted are divided into two categories according to their size since defects with larger size will damage a railway more heavily. Generally, a defect with an area larger than 314 mm2 is serious and should be detected as soon as possible, and a defect with area less than 80 mm2 is too tiny to be inspected. 1) Type-I for 80 mm2 ≤ Ad ≤ 314 mm2 2) Type-II for Ad > 314 mm2 As show in Fig 3, the area of a defect is approximated by the area of its minimum circumscribed rectangle. The Type-I defects are in yellow rectangle whereas Typy-II ones are in red recctangle. 11 LIÊN NGÀNH ĐIỆN - ĐIỆN TỬ - TỰ ĐỘNG HÓA Tạp chí Nghiên cứu khoa học - Đại học Sao Đỏ, ISSN 1859-4190 Số 2(65).2019 Our experiment results demonstrate the proposed method is robust to noise and it has ability to eliminate the illumination inequality of rail images, and has ability to identify various of defect size and shape. Total number of image:1108 Number of non-defect image: 552 Precision of rail surface detected: 1096/1108 Precision of defect detected: 542/556 VI. CONCLUSION The paper has presented a method for detecting corrugation defects appearing on high speed rail surface mainly based on the histogram gray level curvature in both vertical and horizontal direction. The results of experiments conducted on 1108 high-speed ray images shown that the proposed method could easily overcome the challenges such as ambient light inequality, the vibration of the testing-car while moving, the inhomogeneous reflection property of the rail surface, defect distribution on rail images, ... Since then, the proposed method has been demonstraded to be robust to noise and efficient performance, and consequently be conveniently applied to the railway visual inspection system. With the successful classification of the level of damage of each defect on a specific track, relevant railroad period maintenance planning would be made. This result also contributes a significant data source for the complete railway visual inpection system based on deep learning in future work. REFERENCES [1] M. L. Filograno et al., Real-time monitoring of railway traffic using fiber Bragg grating sensors, IEEE Sensors J., vol. 12, no. 1, pp. 85-92, Jan. 2012. [2] C. L. Wei et al., A fiber Bragg grating sensor system for train axle counting, IEEE Sensors J., vol. 10, no. 12, pp. 1905–1912, Dec. 2010. [3] M. L. Filograno, P. Corredera, and M. Rodríguez-Plaza, A. Andrés-Alguacil, and M. González-Herráez, Wheel flat detection in high-speed railway systems using fiber Bragg gratings, IEEE Sensors J., vol. 13, no. 12, pp. 4808–4816, Dec. 2013. [4] Y. Li, H. Trinh, N. Haas, C. Otto, and S. Pankanti, Rail component detection, optimization, and assessment for automatic rail track inspection, IEEE Trans. Intell. Transp. Syst., vol. 15, no. 2, pp. 760¨C770, Apr. 2014. Fig 5. Some samples and the results derived though applying our algorithm. (a) Original rail image; (b) after pre-processing; (c) longitudinal contrast adjusting; (d) threshold after applying y = x2; (e) fusion; (f) connected component; (g) corrugation defect localization (a) (b) (c) (d) (e) (f) (g) (a) (b) (c) (d) (e) (f) (g) 12 NGHIÊN CỨU KHOA HỌC Tạp chí Nghiên cứu khoa học - Đại học Sao Đỏ, ISSN 1859-4190 Số 2(65).2019 [5] B. Gao, L. Bai, W. L. Woo, G. Y. Tian, and Y. Cheng, Automatic defect identification of eddy current pulsed thermography using single channel blind source separation, IEEE Trans. Instrum. Meas., vol. 63, no. 4, pp. 913–922, Apr. 2014. [6] A. Broquetas et al., Track detection in railway sidings based on MEMS gyroscope sensors, Sensors, vol. 12, no. 12, pp. 16228-16249, 2012. [7] Q. Li and S. Ren, A visual detection system for rail surface defects, IEEE Trans. Syst., Man, Cybern. C, Appl. Rev., vol. 42, no. 6, pp. 1531- 1542, Nov. 2012. [8] C. Mandriota, M. Nitti, N. Ancona, E. Stella, and A. Distante, Filterbased feature selection for rail defect detection, Mach. Vis. Appl., vol. 15, no. 4, pp. 179–185, 2004. [9] A. K. Dubey and Z. A. Jaffery, Maximally stable extremal region marking-based railway track surface defect sensing, IEEE Sensors J., vol. 16, no. 24, pp. 9047-9052, Dec. 2016. [10] Q. Li and S. Ren, A real-time visual inspection system for discrete surface defects of rail heads, IEEE Trans. Instrum. Meas., vol. 61, no. 8, pp. 2189¨C2199, Aug. 2012. [11] Z. He, Y. Wang, F. Yin, and J. Liu, Surface defect detection for high speed rails using an inverse PM diffusion model, Sensor Rev., vol. 36, no. 1, pp. 86–97, 2016. AUTHORS BIOGRAPHY Pham Thi Dieu Thuy - Pham Thi Dieu Thuy received the B.S. degree in automation from Thai Nguyen University of Technology, Thai Nguyen, Viet Nam + In 2006 and the M.S. degree in Measurement and Control systems from Ha Noi University of Science and Technology, Ha Noi, Viet Nam + In 2010: Her current research interests include medical image processing, machine vision and machine learning - Email: dieuthuy303@gmail.com - Telephone No: 0986468005 Ha Minh Tuan - Ha Minh Tuan received the B.S. degree in automation from Viet Nam Maritime University, Hai Phong, Viet Nam + In 2005 and the M.S. degree in Measurement and Control systems from Ha Noi University of Science and Technology, Ha Noi, Viet Nam + In 2010: His current research interests include medical image processing, machine vision and machine learning - Email: minhtuanha031@gmail.com - Telephone No: 0977536826 Tran Thi Diep - Tran Thi Diep received the B.S. degree in automation from Thai Nguyen University of technology, Thai Nguyen, Viet Nam + In 2010 and the M.S. degree in Automation from Mining and Geology University, Ha Noi, Viet Nam + In 2013: Her current research interests include control systems, nonlinear, robotics, renewable energy - Email: phuongdiep222@gmail.com.vn - Telephone No: 0374700015 13 LIÊN NGÀNH ĐIỆN - ĐIỆN TỬ - TỰ ĐỘNG HÓA Tạp chí Nghiên cứu khoa học - Đại học Sao Đỏ, ISSN 1859-4190 Số 2(65).2019 Vu Duc Ha - Vu Duc Ha received the B.S. degree in Electrical engineering from Hanoi Industrial University, Ha Noi, Viet Nam + In 2010 and the M.S. degree in Automation from Mining and Geology University, Ha Noi, Viet Nam + In 2013: His current research interests include control systems, nonlinear, robotics, renewable energy Email: vuhadhsd@gmail.com.vn Telephone No: 0983954486 Pham Thi Thao - Pham Thi Thao received the B.S. degree in Electrification and power supply of enterprises from Thai Nguyen University of Technology, Thai Nguyen + In 2002 and the M.S. degree in Automation from Ha Noi University of Science and Technology, Ha Noi, Viet Nam + In 2004: Her current research interests include control engineering and automation. Summary of current work: Lecturer, Faculty of Electrical Engineering, Sao Do University - Email: phamhathao@gmail.com - Telephone No: 0905006188 Luong Thi Thanh Xuan - Luong Thi Thanh Xuan received the B.S. degree in Technology Education from Thai Nguyen University of Technology, Thai Nguyen + In 2003 and the M.S. degree in Automation from Thai Nguyen University of Technology, Thai Nguyen, Viet Nam + In 2011: Her current research interests include Control Engineering and Automation. Summary of current work: Lecturer, Faculty of Electrical Engineering, Sao Do University - Email: thanhxuan7980@gmail.com - Telephone No: 0982791980
File đính kèm:
 phuong_phap_phat_hien_va_danh_gia_hu_hai_gap_nep_cho_he_thon.pdf

