Phân tích nguyên tố vết lắng đọng trong không khí qua rêu barbula indica tại thành phố bảo lộc sử dụng kỹ thuật huỳnh quang tia X phản xạ toàn phần
Trong nghiên cứu này, kỹ thuật huỳnh quang tia X phản xạ toàn phần (TXRF) được ứng dụng
đã xác định được 24 nguyên tố, bao gồm: Al, P, S, Cl, K, Sr, Sc, Ti, Mn, Fe, Co, Cu, Zn, As,
Br, Ba, La, Eu, Tb, Dy, Ta, Pb, Th, và U trên rêu Barbula Indica tại thành phố Bảo Lộc (Việt
Nam) từ tháng mười một năm 2019 đến tháng ba năm 2020. Kết quả cũng đã dự đoán những
nguồn ô nhiễm mang lại. Ở nghiên cứu này cho thấy việc sử dụng mẫu rêu có sẵn, và kỹ thuật
TXRF là hiệu quả, rất thuận lợi để xác định sự lắng động các nguyên tố vết trong không khí
cho những quốc gia đang phát triển, đặc biệt là Việt Nam và các nước Châu Á.
Trang 1
Trang 2
Trang 3
Trang 4
Trang 5
Trang 6
Trang 7
Trang 8
Trang 9
Trang 10
Tải về để xem bản đầy đủ
Bạn đang xem 10 trang mẫu của tài liệu "Phân tích nguyên tố vết lắng đọng trong không khí qua rêu barbula indica tại thành phố bảo lộc sử dụng kỹ thuật huỳnh quang tia X phản xạ toàn phần", để tải tài liệu gốc về máy hãy click vào nút Download ở trên
Tóm tắt nội dung tài liệu: Phân tích nguyên tố vết lắng đọng trong không khí qua rêu barbula indica tại thành phố bảo lộc sử dụng kỹ thuật huỳnh quang tia X phản xạ toàn phần
he standardized sum of the
squares of the differences between the measured and calculated deconvoluted intensities
is calculated. The value of the fit quality should preferably be less than 10. High values
(>10) are an indication of misidentified or unidentified elements, respectively, or
inaccurate gain correction. The fit quality function is ∑
1
𝛿𝑖
2 (𝑦𝑖+1 − 𝑦𝑖)
2𝑛2
𝑖=𝑛1
 where n1 is
the first channel of peak i (the left channel), n2 is the last channel of peak i (the right
channel), yi+1 is the number of counts for channel i+1, yi is the number of counts for
channel i, and 𝛿𝑖 = √𝑁𝑖 + 2𝑁𝐵𝐺 where δi is the standard deviation for the peak area, Ni is
the net peak area for element i, and NBG is the background area.
3. RESULTS AND DISCUSSIONS
Up to 24 elements, including Al, P, S, Cl, K, Sr, Sc, Ti, Mn, Fe, Co, Cu, Zn, As,
Br, Ba, La, Eu, Tb, Dy, Ta, Pb, Th, and U, were detected with the TXRF technique in
moss samples collected at 11 locations in Baoloc. The trace element concentrations in the
Nguyen An Son, Doan Phan Thao Tien, Le Hong Khiem, Nguyen Thi Minh Sang, Nguyen Thi Nguyet Ha, Pham Thi Ngoc Ha,
Pham Dang Quyet, Nguyen Dinh Trung, Ho Huu Thang, and Nguyen Truong Duong Cam
104
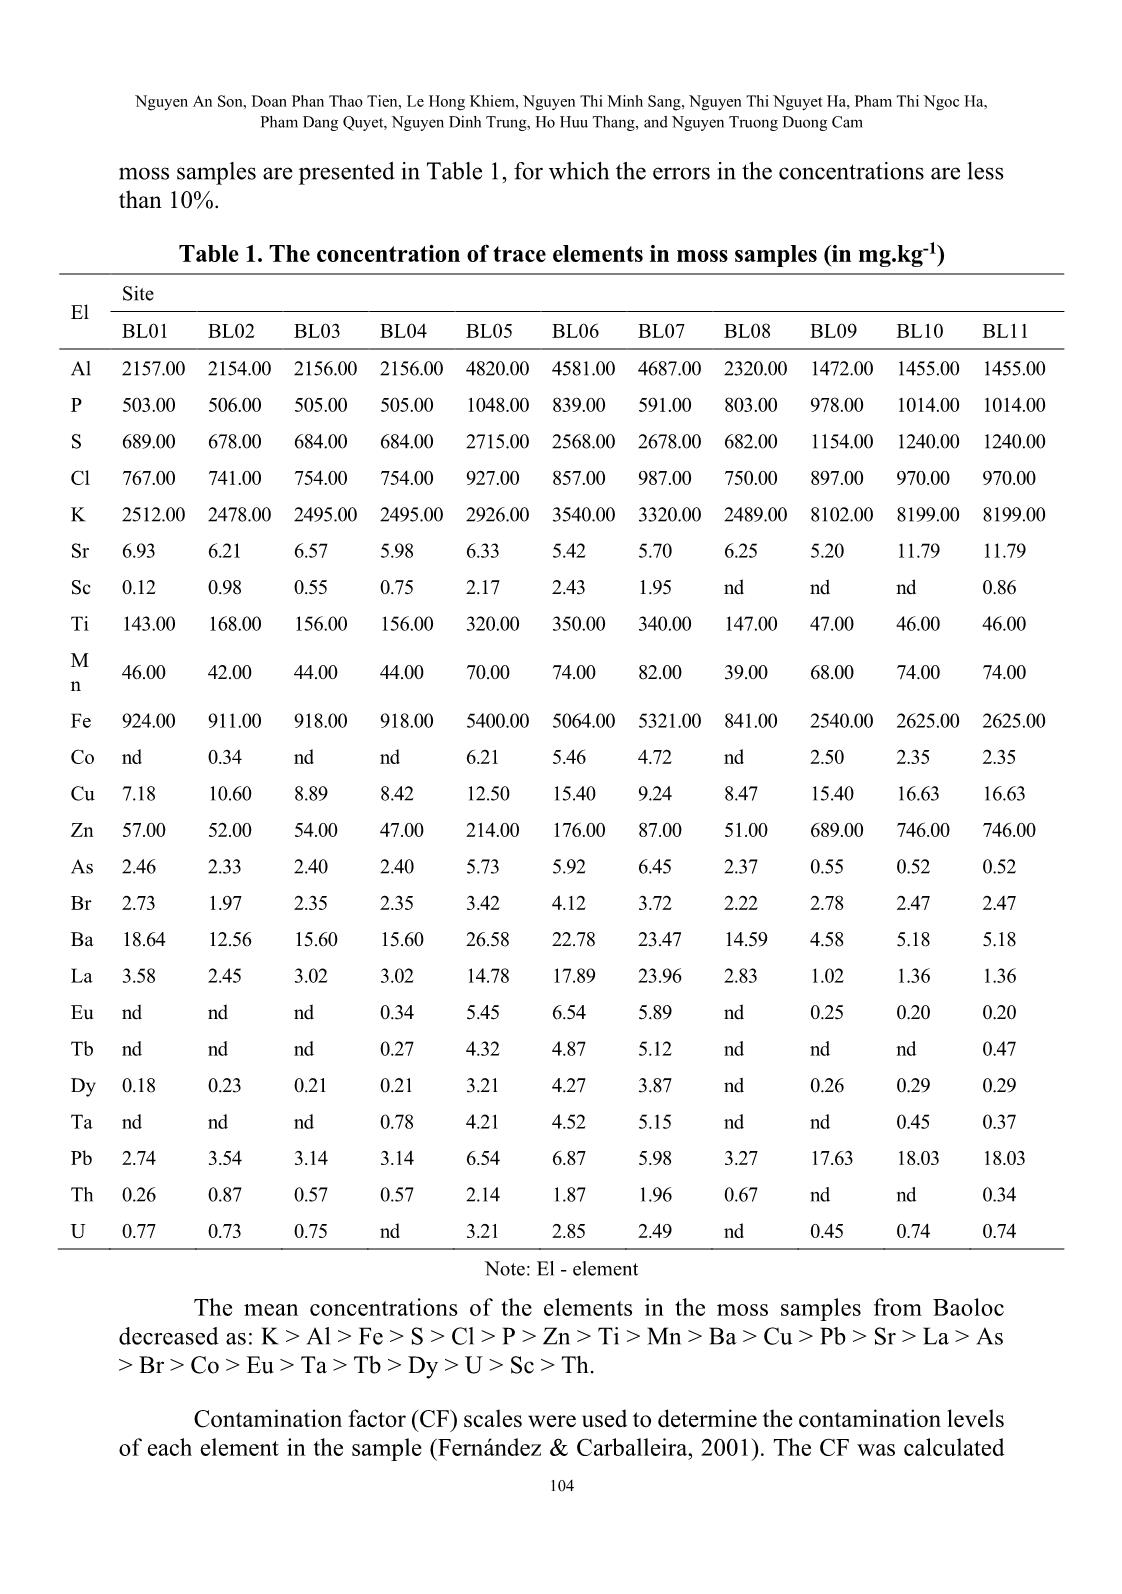
moss samples are presented in Table 1, for which the errors in the concentrations are less
than 10%.
Table 1. The concentration of trace elements in moss samples (in mg.kg-1)
El
Site
BL01 BL02 BL03 BL04 BL05 BL06 BL07 BL08 BL09 BL10 BL11
Al 2157.00 2154.00 2156.00 2156.00 4820.00 4581.00 4687.00 2320.00 1472.00 1455.00 1455.00
P 503.00 506.00 505.00 505.00 1048.00 839.00 591.00 803.00 978.00 1014.00 1014.00
S 689.00 678.00 684.00 684.00 2715.00 2568.00 2678.00 682.00 1154.00 1240.00 1240.00
Cl 767.00 741.00 754.00 754.00 927.00 857.00 987.00 750.00 897.00 970.00 970.00
K 2512.00 2478.00 2495.00 2495.00 2926.00 3540.00 3320.00 2489.00 8102.00 8199.00 8199.00
Sr 6.93 6.21 6.57 5.98 6.33 5.42 5.70 6.25 5.20 11.79 11.79
Sc 0.12 0.98 0.55 0.75 2.17 2.43 1.95 nd nd nd 0.86
Ti 143.00 168.00 156.00 156.00 320.00 350.00 340.00 147.00 47.00 46.00 46.00
M
n
46.00 42.00 44.00 44.00 70.00 74.00 82.00 39.00 68.00 74.00 74.00
Fe 924.00 911.00 918.00 918.00 5400.00 5064.00 5321.00 841.00 2540.00 2625.00 2625.00
Co nd 0.34 nd nd 6.21 5.46 4.72 nd 2.50 2.35 2.35
Cu 7.18 10.60 8.89 8.42 12.50 15.40 9.24 8.47 15.40 16.63 16.63
Zn 57.00 52.00 54.00 47.00 214.00 176.00 87.00 51.00 689.00 746.00 746.00
As 2.46 2.33 2.40 2.40 5.73 5.92 6.45 2.37 0.55 0.52 0.52
Br 2.73 1.97 2.35 2.35 3.42 4.12 3.72 2.22 2.78 2.47 2.47
Ba 18.64 12.56 15.60 15.60 26.58 22.78 23.47 14.59 4.58 5.18 5.18
La 3.58 2.45 3.02 3.02 14.78 17.89 23.96 2.83 1.02 1.36 1.36
Eu nd nd nd 0.34 5.45 6.54 5.89 nd 0.25 0.20 0.20
Tb nd nd nd 0.27 4.32 4.87 5.12 nd nd nd 0.47
Dy 0.18 0.23 0.21 0.21 3.21 4.27 3.87 nd 0.26 0.29 0.29
Ta nd nd nd 0.78 4.21 4.52 5.15 nd nd 0.45 0.37
Pb 2.74 3.54 3.14 3.14 6.54 6.87 5.98 3.27 17.63 18.03 18.03
Th 0.26 0.87 0.57 0.57 2.14 1.87 1.96 0.67 nd nd 0.34
U 0.77 0.73 0.75 nd 3.21 2.85 2.49 nd 0.45 0.74 0.74
Note: El - element
The mean concentrations of the elements in the moss samples from Baoloc
decreased as: K > Al > Fe > S > Cl > P > Zn > Ti > Mn > Ba > Cu > Pb > Sr > La > As
> Br > Co > Eu > Ta > Tb > Dy > U > Sc > Th.
Contamination factor (CF) scales were used to determine the contamination levels
of each element in the sample (Fernández & Carballeira, 2001). The CF was calculated
DALAT UNIVERSITY JOURNAL OF SCIENCE [NATURAL SCIENCES AND TECHNOLOGY]
105
as the ratio of the mean value of each heavy metal in a moss sample to the background
level, as in the equation (Hakanson, 1980): 𝐶𝐹𝑖 =
𝐶𝑖
BGi
 where Ci is the mean value of the
ith element from the investigated area, and BGi is the average value of the three sample
sites which have the lowest concentration of the corresponding metal from the
investigated area.
The CF values comprise six levels: CF < 1: no contamination, 1 < CF ≤ 2:
suspected contamination, 2 < CF ≤ 3.5: slight contamination, 3.5 < CF ≤ 8: moderate
contamination, 8 < CF ≤ 27: serious contamination, and 27 < CF: extreme contamination
(Fernández & Carballeira, 2001). Table 2 shows the contamination factors for 24 elements.
Table 2. The contamination factors of trace elements in the moss samples
El AL P S Cl K Sr Sc Ti Mn Fe Co Cu
CF 1.8 1.5 2.0 1.1 1.7 1.3 1.9 3.8 1.4 2.9 1.3 1.5
Table 2. The contamination factors of trace elements in the moss samples (tt)
El Zn As Br Ba La Eu Tb Dy Ta Pb Th U
CF 5.3 5.4 1.3 3.0 5.5 7.9 0.8 5.9 2.6 2.7 2.2 1.8
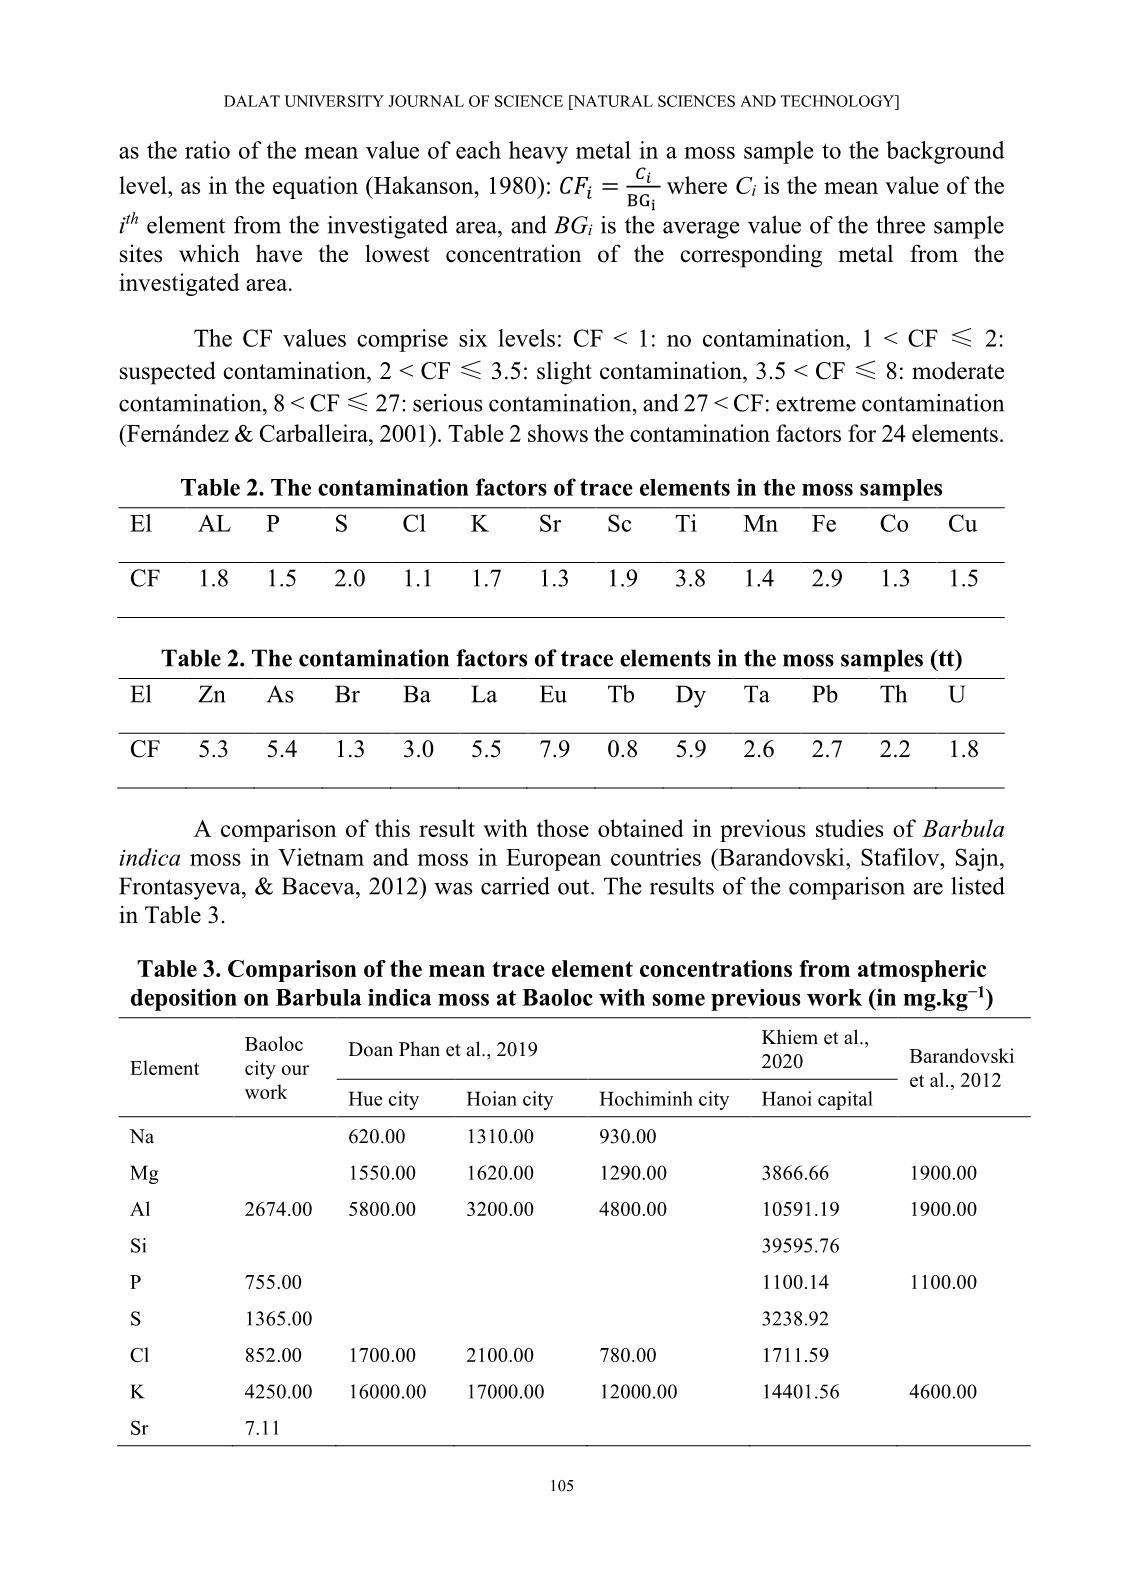
A comparison of this result with those obtained in previous studies of Barbula
indica moss in Vietnam and moss in European countries (Barandovski, Stafilov, Sajn,
Frontasyeva, & Baceva, 2012) was carried out. The results of the comparison are listed
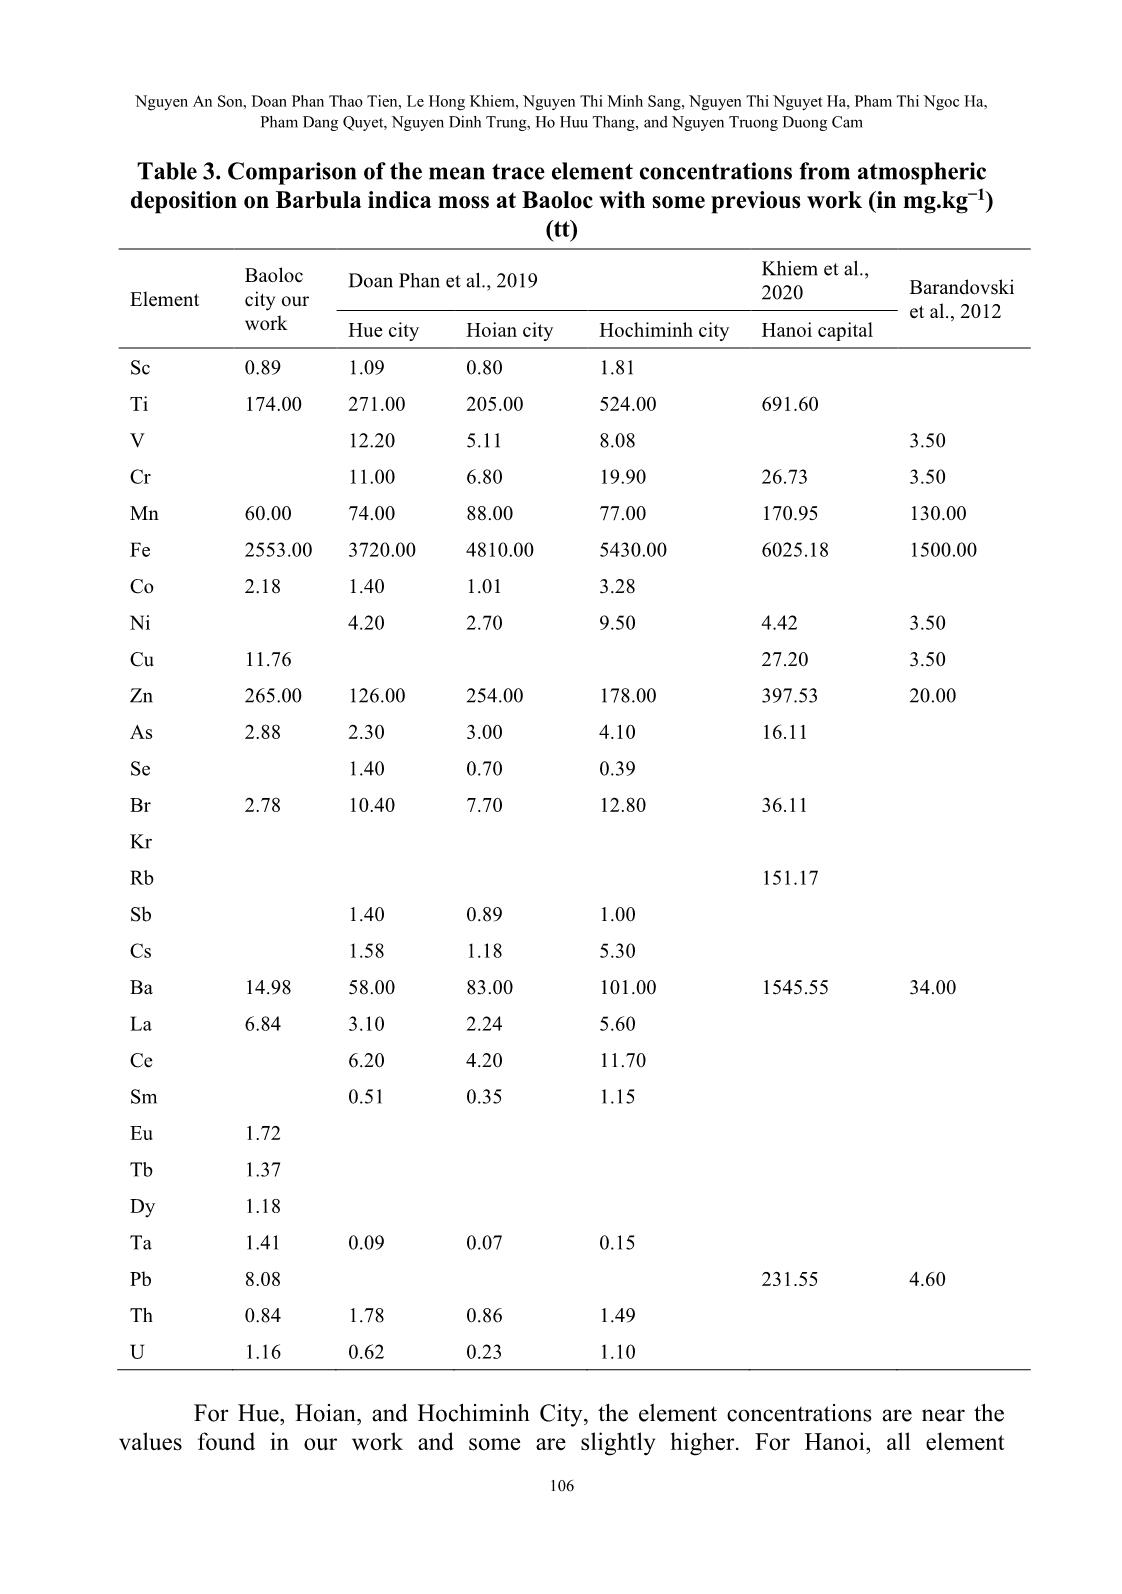
in Table 3.
Table 3. Comparison of the mean trace element concentrations from atmospheric
deposition on Barbula indica moss at Baoloc with some previous work (in mg.kg−1)
Element
Baoloc
city our
work
Doan Phan et al., 2019
Khiem et al.,
2020 Barandovski
et al., 2012
Hue city Hoian city Hochiminh city Hanoi capital
Na 620.00 1310.00 930.00
Mg 1550.00 1620.00 1290.00 3866.66 1900.00
Al 2674.00 5800.00 3200.00 4800.00 10591.19 1900.00
Si
39595.76
P 755.00
1100.14 1100.00
S 1365.00
3238.92
Cl 852.00 1700.00 2100.00 780.00 1711.59
K 4250.00 16000.00 17000.00 12000.00 14401.56 4600.00
Sr 7.11
Nguyen An Son, Doan Phan Thao Tien, Le Hong Khiem, Nguyen Thi Minh Sang, Nguyen Thi Nguyet Ha, Pham Thi Ngoc Ha,
Pham Dang Quyet, Nguyen Dinh Trung, Ho Huu Thang, and Nguyen Truong Duong Cam
106
Table 3. Comparison of the mean trace element concentrations from atmospheric
deposition on Barbula indica moss at Baoloc with some previous work (in mg.kg−1)
(tt)
Element
Baoloc
city our
work
Doan Phan et al., 2019
Khiem et al.,
2020 Barandovski
et al., 2012
Hue city Hoian city Hochiminh city Hanoi capital
Sc 0.89 1.09 0.80 1.81
Ti 174.00 271.00 205.00 524.00 691.60
V 12.20 5.11 8.08 3.50
Cr 11.00 6.80 19.90 26.73 3.50
Mn 60.00 74.00 88.00 77.00 170.95 130.00
Fe 2553.00 3720.00 4810.00 5430.00 6025.18 1500.00
Co 2.18 1.40 1.01 3.28
Ni 4.20 2.70 9.50 4.42 3.50
Cu 11.76
27.20 3.50
Zn 265.00 126.00 254.00 178.00 397.53 20.00
As 2.88 2.30 3.00 4.10 16.11
Se 1.40 0.70 0.39
Br 2.78 10.40 7.70 12.80 36.11
Kr
Rb
151.17
Sb 1.40 0.89 1.00
Cs 1.58 1.18 5.30
Ba 14.98 58.00 83.00 101.00 1545.55 34.00
La 6.84 3.10 2.24 5.60
Ce 6.20 4.20 11.70
Sm 0.51 0.35 1.15
Eu 1.72
Tb 1.37
Dy 1.18
Ta 1.41 0.09 0.07 0.15
Pb 8.08
231.55 4.60
Th 0.84 1.78 0.86 1.49
U 1.16 0.62 0.23 1.10
For Hue, Hoian, and Hochiminh City, the element concentrations are near the
values found in our work and some are slightly higher. For Hanoi, all element
DALAT UNIVERSITY JOURNAL OF SCIENCE [NATURAL SCIENCES AND TECHNOLOGY]
107
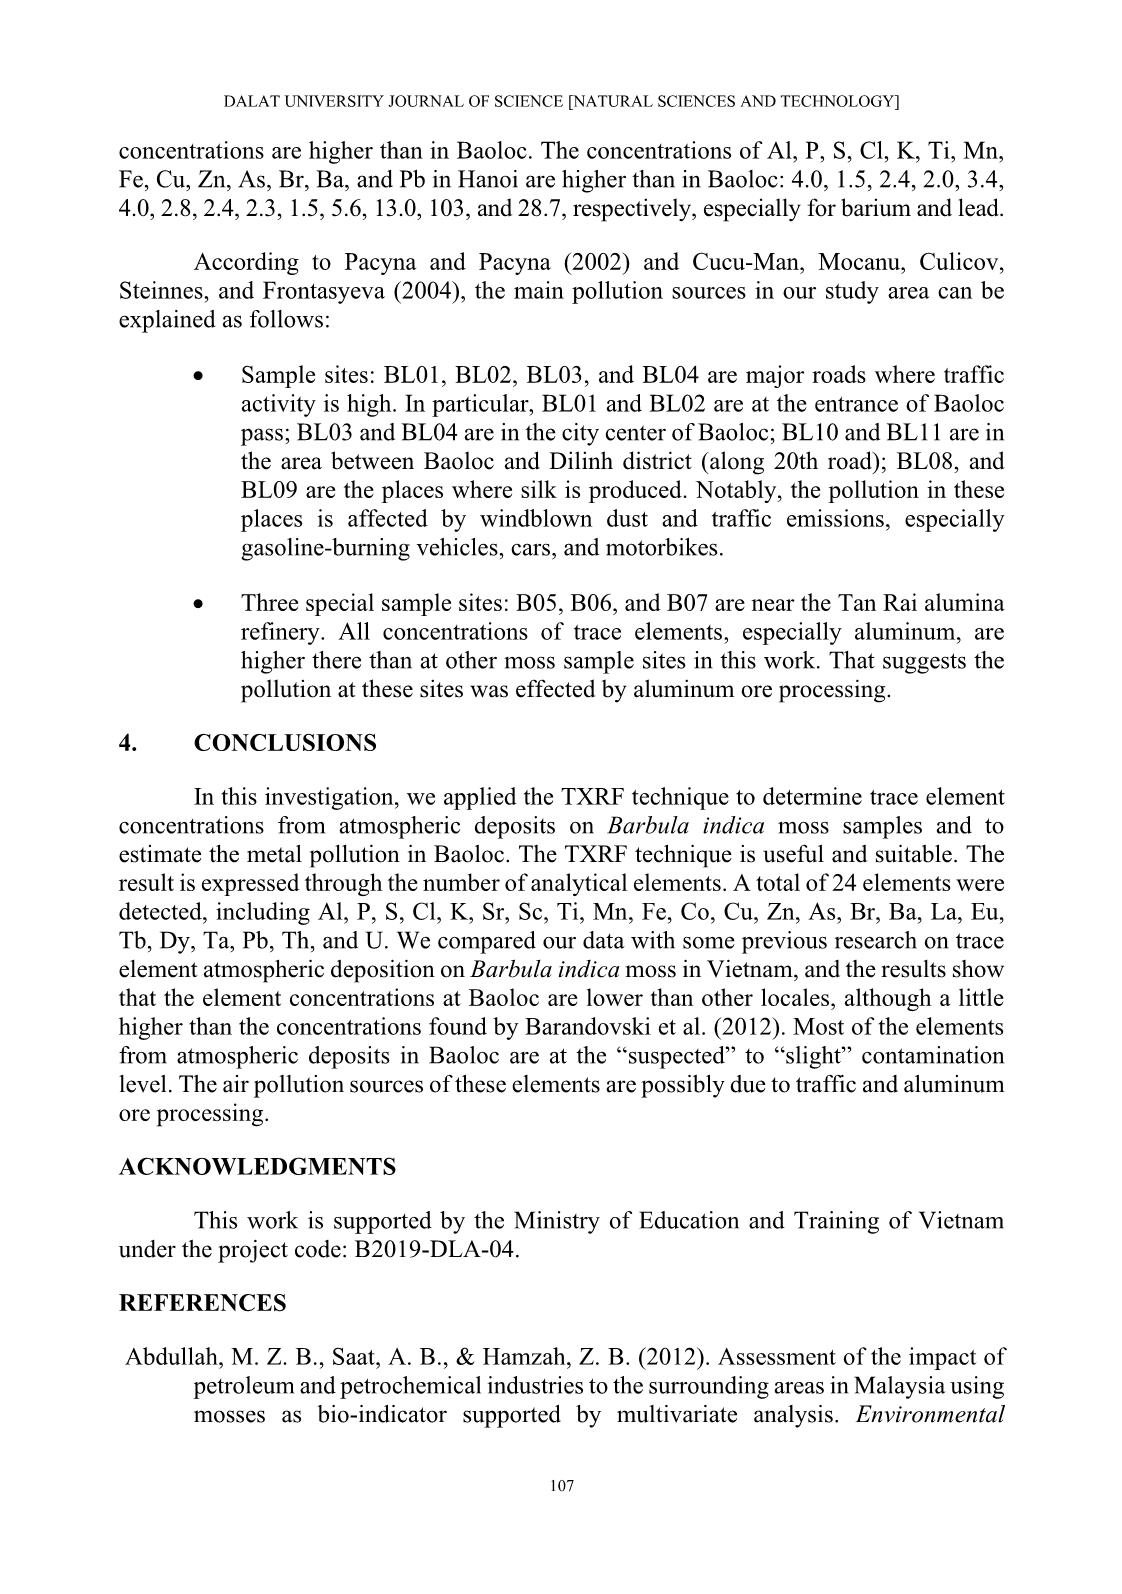
concentrations are higher than in Baoloc. The concentrations of Al, P, S, Cl, K, Ti, Mn,
Fe, Cu, Zn, As, Br, Ba, and Pb in Hanoi are higher than in Baoloc: 4.0, 1.5, 2.4, 2.0, 3.4,
4.0, 2.8, 2.4, 2.3, 1.5, 5.6, 13.0, 103, and 28.7, respectively, especially for barium and lead.
According to Pacyna and Pacyna (2002) and Cucu-Man, Mocanu, Culicov,
Steinnes, and Frontasyeva (2004), the main pollution sources in our study area can be
explained as follows:
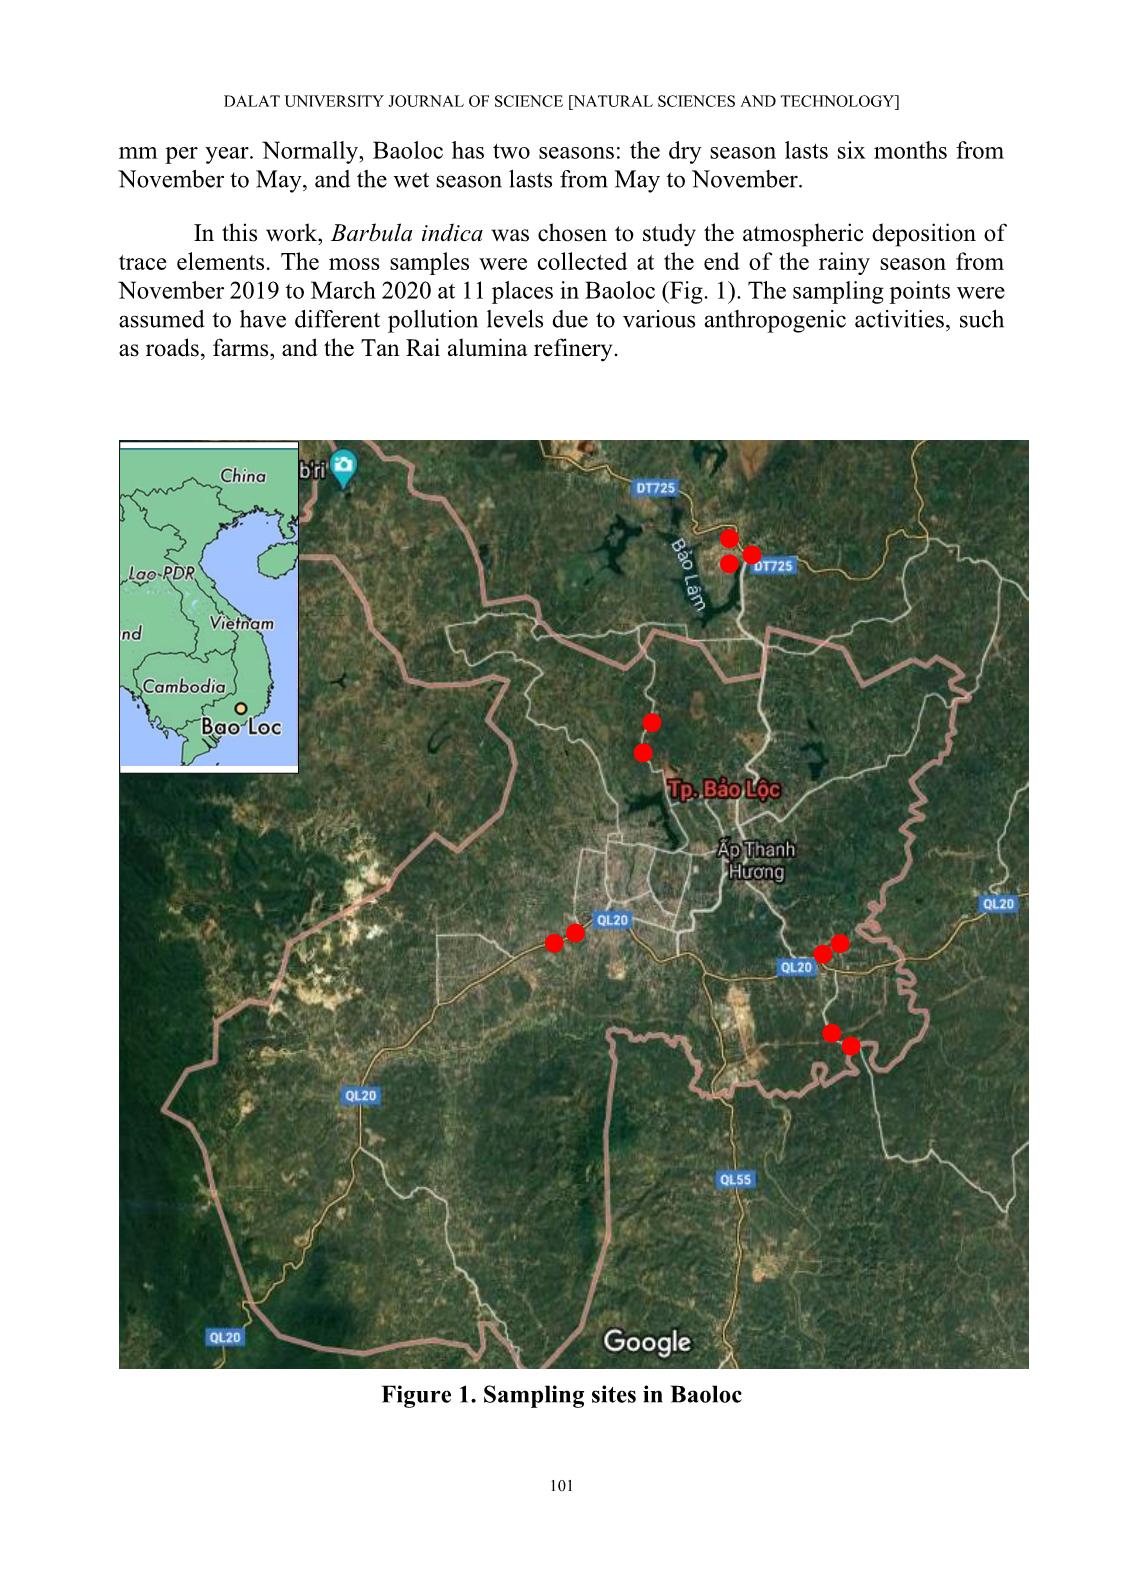
• Sample sites: BL01, BL02, BL03, and BL04 are major roads where traffic
activity is high. In particular, BL01 and BL02 are at the entrance of Baoloc
pass; BL03 and BL04 are in the city center of Baoloc; BL10 and BL11 are in
the area between Baoloc and Dilinh district (along 20th road); BL08, and
BL09 are the places where silk is produced. Notably, the pollution in these
places is affected by windblown dust and traffic emissions, especially
gasoline-burning vehicles, cars, and motorbikes.
• Three special sample sites: B05, B06, and B07 are near the Tan Rai alumina
refinery. All concentrations of trace elements, especially aluminum, are
higher there than at other moss sample sites in this work. That suggests the
pollution at these sites was effected by aluminum ore processing.
4. CONCLUSIONS
In this investigation, we applied the TXRF technique to determine trace element
concentrations from atmospheric deposits on Barbula indica moss samples and to
estimate the metal pollution in Baoloc. The TXRF technique is useful and suitable. The
result is expressed through the number of analytical elements. A total of 24 elements were
detected, including Al, P, S, Cl, K, Sr, Sc, Ti, Mn, Fe, Co, Cu, Zn, As, Br, Ba, La, Eu,
Tb, Dy, Ta, Pb, Th, and U. We compared our data with some previous research on trace
element atmospheric deposition on Barbula indica moss in Vietnam, and the results show
that the element concentrations at Baoloc are lower than other locales, although a little
higher than the concentrations found by Barandovski et al. (2012). Most of the elements
from atmospheric deposits in Baoloc are at the “suspected” to “slight” contamination
level. The air pollution sources of these elements are possibly due to traffic and aluminum
ore processing.
ACKNOWLEDGMENTS
This work is supported by the Ministry of Education and Training of Vietnam
under the project code: B2019-DLA-04.
REFERENCES
 Abdullah, M. Z. B., Saat, A. B., & Hamzah, Z. B. (2012). Assessment of the impact of
petroleum and petrochemical industries to the surrounding areas in Malaysia using
mosses as bio-indicator supported by multivariate analysis. Environmental
Nguyen An Son, Doan Phan Thao Tien, Le Hong Khiem, Nguyen Thi Minh Sang, Nguyen Thi Nguyet Ha, Pham Thi Ngoc Ha,
Pham Dang Quyet, Nguyen Dinh Trung, Ho Huu Thang, and Nguyen Truong Duong Cam
108
Monitoring and Assessment, 184, 3959-3969. https://link.springer.com/article
/10.1007/s10661-011-2236-y.
Barandovski, L., Stafilov, T., Sajn, R., Frontasyeva, M., & Baceva, K. (2012). Air
pollution study in Macedonia using a moss biomonitoring technique, ICP-AES
and AAS. Macedonian Journal of Chemistry and Chemical Engineering, 32(1),
89-107. https://mjcce.org.mk/index.php/MJCCE/article/view/137.
Cucu-Man, S., Mocanu, R., Culicov, O., Steinnes, E., & Frontasyeva, M. (2004).
Atmospheric deposition of metals in Romania studied by biomonitoring using the
epiphytic moss hypnum cupressiforme. International Journal of Environmental
Analytical Chemistry, 84(11), 845-854. https://doi.org/10.1080/03067310420002
68152.
Doan Phan, T. T., Trinh, T. T. M., Khiem, L. H., Frontasyeva, M. V., & Quyet, N. H.
(2019). Study of airborne trace element pollution in Central and Southern Vietnam
using moss (Barbula indica) technique and neutron activation analysis. Asia-
Pacific Journal of Atmospheric Sciences, 55, 247-253. https://doi.org/10.1007
/s13143-018-0065-4.
Fernández, J. A., & Carballeira, A. (2000). Differences in the responses of native and
transplanted to atmospheric pollution: A possible role of selenium. Environmental
Pollution, 110(1), 73-78. https://doi.org/10.1016/S0269-7491(99)00278-X.
Fernández, J. A., & Carballeira, A. (2001). A comparison of indigenous mosses and
topsoils for use in monitoring atmospheric heavy metal deposition in Galicia
(Northwest Spain). Environmental Pollution. 114(3), 431-441, https://doi.org/10.
1016/S0269-7491(00)00229-3.
Frontasyeva, M. & Harmens, H. (2019). Monitoring of atmospheric deposition of heavy
metals, nitrogen and pops in Europe using bryophytes. Retrieved from
https://icpvegetation.ceh.ac.uk/sites/default/files/ICP%20Vegetation%20moss%
20monitoring%20manual%202020.pdf.
Frontasyeva, M. V., Galinskaya, T. Y., Krmar, M., Matavuly, M., Palov, S. S.,
Povtoreyko,  Stainnes, E. (2004). Atmospheric deposition of heavy metals in
northern Serbia and Bosnia-Herzegovina studied by the moss biomonitoring,
neutronactivation analysis and GIS technology. Journal of Radioanalytical and
Nuclear Chemistry, 259, 141-147. https://link.springer.com/article/10.1023/B:
JRNC.0000015819.67830.60.
Gjengedal, E., & Steinnes, E. (1990). Uptake of metal ions in moss from artificial
precipitation. Environmental Monitoring and Assessment, 14, 77-87.
https://link.springer.com/article/10.1007/BF00394359.
Hakanson, L. (1980). An ecological risk index for aquatic pollution control: A
sedimentological approach. Water Research, 14, 975-1001. https://doi.org/10.
1016/0043-1354(80)90143-8.
Harmens, H., Norris, D. A., Steinnes, E., Kubin, E., Piispanen, J., Alber, R.,
Zechmeister, H. G. (2010). Mosses as biomonitors of atmosphericheavy metal
DALAT UNIVERSITY JOURNAL OF SCIENCE [NATURAL SCIENCES AND TECHNOLOGY]
109
deposition: Spatial patterns and temporal trends in Europe. Environmental
Pollution, 158(10), 3144-3156. https://doi.org/10.1016/j.envpol.2010.06.039.
Khiem, L. H., Sera, K., Hosokawa, T., Quyet, N. H., Frontasyeva, M. V., Trinh, T. T. M.,
 Tien, D. P. T. (2020). Assessment of atmospheric deposition of metals in Ha
Noi using the moss bio-monitoring technique and proton induced X-ray emission.
Journal of Radioanalytical and Nuclear Chemistry, 324, 43-54. https://doi.org/
10.1007/s10967-020-07066-z.
Lee, C. S. L., Li, X., Zhang, G., Peng, X., & Zhang, L. (2005). Biomonitoring of trace
metals in the atmosphere using moss (Hypnum plumaeforme) in the Nanling
Mountains and the Pearl River Delta, Southern China. Atmospheric Environment,
39(3), 397-407. https://doi.org/10.1016/j.atmosenv.2004.09.067.
Pacyna, J. M., & Pacyna, E. G. (2002). An assessment of global and regional emissions
of trace metals to the atmosphere from anthropogenic sources worldwide.
Environmental Reviews, 9(4), 269-298. https://doi.org/10.1139/a01-012.
Rühling, Å., & Tyler, G. (1968). An ecological approach to the lead problem. Botaniska
Notiser, 121, 321-342.
Rühling, Å. & Tyler, G. (1969). Ecology of heavy metals-a regional and historical study.
Botaniska Notiser, 122, 248-259.
Rühling, Å. & Tyler, G. (1970). Sorption and retention of heavy metals in the woodland
moss Hylocomium splendens (Hedw.) Br. et Sch. Oikos, 21(1), 92-97.
Sucharová, J., & Suchara, I. (1998). Atmospheric deposition levels of chosen elements in
the Czech Republic determined in the framework of the International
Bryomonitoring Program 1995. Science of The Total Environment, 223(1), 37-52.
https://doi.org/10.1016/S0048-9697(98)00306-4.
Towett, E. T., Shepherd, K. D., & Cadisch, G. (2013). Quantification of total element
concentrations in soils using total X-ray fluorescence spectroscopy (TXRF).
Science of The Total Environment. 463-464, 374-388. https://doi.org/10.1016/
j.scitotenv.2013.05.068.
File đính kèm:
 phan_tich_nguyen_to_vet_lang_dong_trong_khong_khi_qua_reu_ba.pdf

