Numerical investigation of fluid – structure interaction (FSI) on sodium leakage accident at prototype fast breeder reactor monju
This study presents a numerical investigation of fluid-structure interaction about sodium
leakage accident at prototype fast breeder reactor Monju. The dynamic forces of sodium liquid flow
acting on the thermowell are the main cause of fatigue failure, which leads to the occurrence of
thermowell cracking due to intense stresses and high fatigue-cycle. Since the location and magnitude
of these stresses are unknown, an analysis of the vibrational characteristics and stresses caused by FSI
was performed by using ANSYS to prevent similar accidents in the future. The most dangerous case
was found for FSI analysis by comparisons between the natural frequency of thermowell and vortex
shedding frequency at several operating conditions. The results showed that a stress concentration
location is similar to the location of broken thermowell, and the amplitude of stress is large enough for
fatigue damage.
Trang 1
Trang 2
Trang 3
Trang 4
Trang 5
Trang 6
Trang 7
Trang 8
Trang 9
Trang 10
Tải về để xem bản đầy đủ
Tóm tắt nội dung tài liệu: Numerical investigation of fluid – structure interaction (FSI) on sodium leakage accident at prototype fast breeder reactor monju
of the structure. Displacement
values are interpolated to the fluid mesh which
results in deformation of the fluid domain.
In summary, the one-way FSI approach
uses only the traction equilibrium, Eq. 5, and the
data is transferred from Fluent solver to the
Structure solver. In contrast, the two-way FSI
approach uses both the traction equilibrium, Eq. 5,
and the displacement continuity condition, Eq. 4.
Through the two-way FSI process using both
Eq. 4 and 5, displacement values are updated to
the fluid mesh.
C. Verification of the Modal and FSI
calculation models
To demonstrate further the validity of
the Modal and FSI calculation models with
oscillation problems, the oscillation of an
exemplary vertical plate in a cavity filled
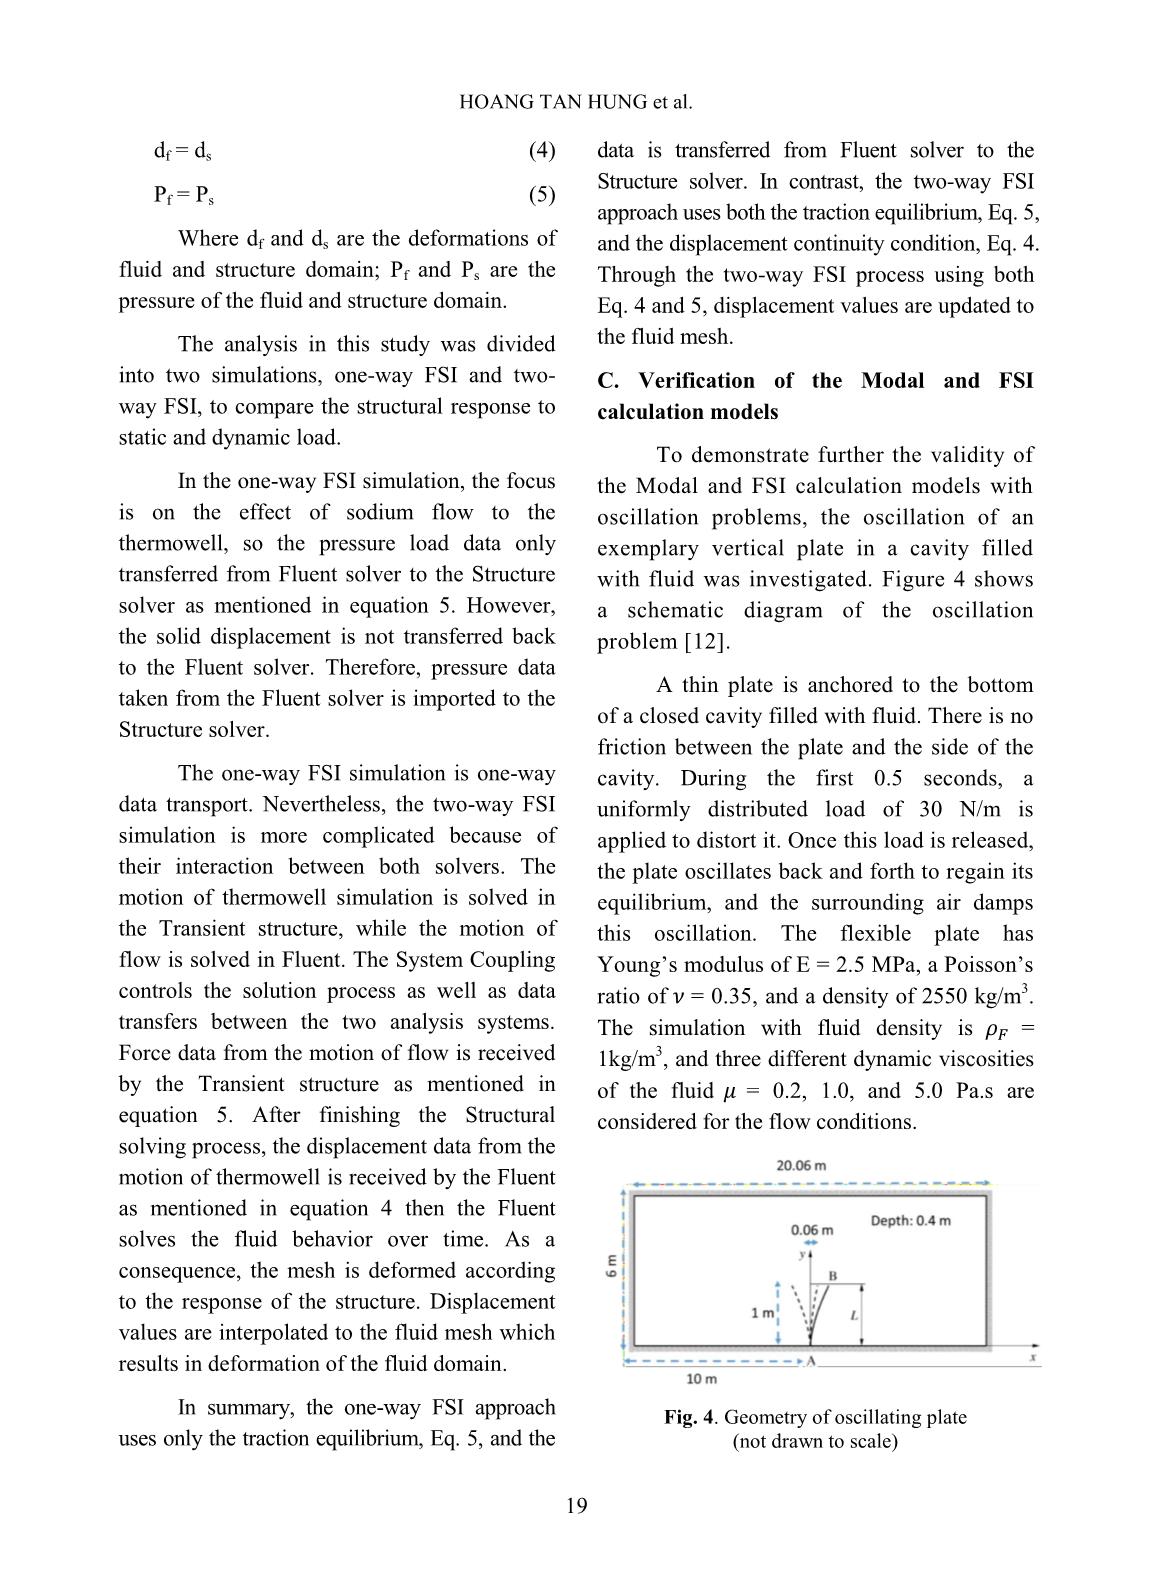
with fluid was investigated. Figure 4 shows
a schematic diagram of the oscillation
problem [12].
A thin plate is anchored to the bottom
of a closed cavity filled with fluid. There is no
friction between the plate and the side of the
cavity. During the first 0.5 seconds, a
uniformly distributed load of 30 N/m is
applied to distort it. Once this load is released,
the plate oscillates back and forth to regain its
equilibrium, and the surrounding air damps
this oscillation. The flexible plate has
Young’s modulus of E = 2.5 MPa, a Poisson’s
ratio of = 0.35, and a density of 2550 kg/m3.
The simulation with fluid density is =
1kg/m
3
, and three different dynamic viscosities
of the fluid = 0.2, 1.0, and 5.0 Pa.s are
considered for the flow conditions.
Fig. 4. Geometry of oscillating plate
(not drawn to scale)
NUMERICAL INVESTIGATION OF FLUID – STRUCTURE INTERACTION (FSI)
20
In Modal analysis, a fixed support
constraint is needed to hold the bottom of the
thin plate in place and the set up to find the
first natural frequency and mode shape of the
plate. The result of Modal analysis showed that
the value of the first natural frequency of the
plate is 0.317Hz.
An interface between the solid domain
and the fluid domain was created for data
transferring, as mentioned in the previous
section of FSI analysis. Displacement values of
the plate are interpolated to the fluid mesh using
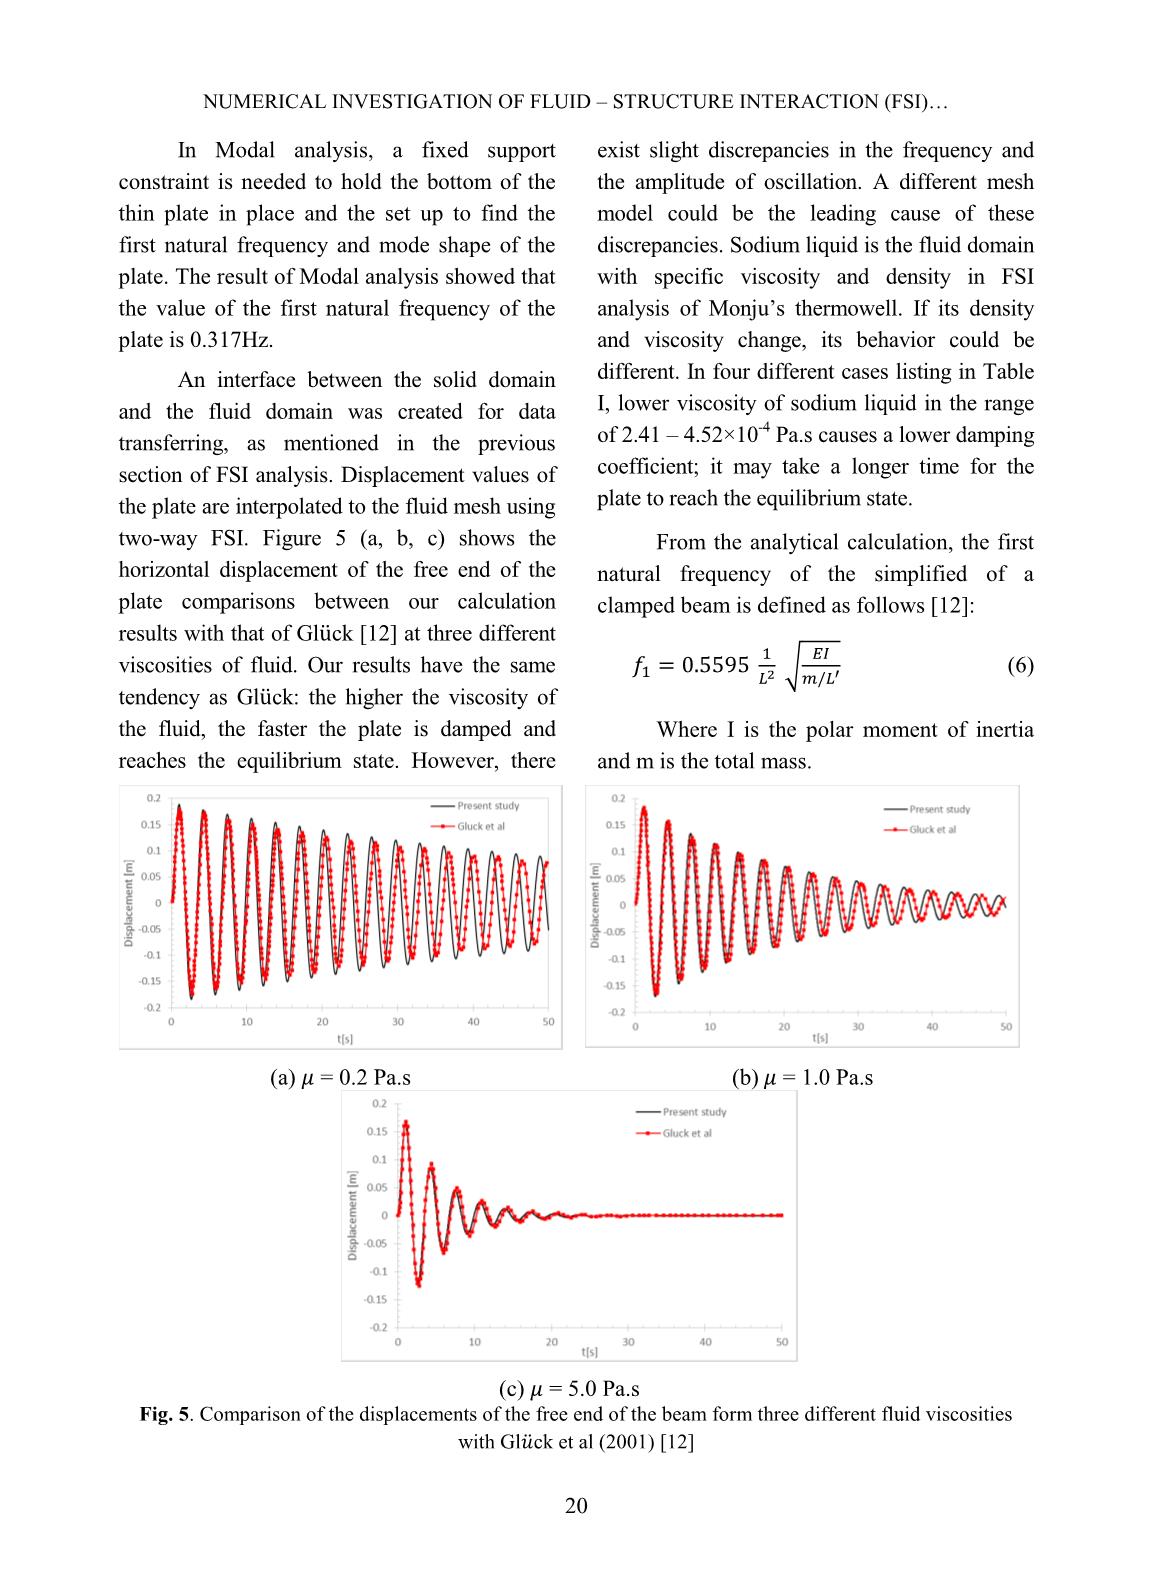
two-way FSI. Figure 5 (a, b, c) shows the
horizontal displacement of the free end of the
plate comparisons between our calculation
results with that of Gl ̈ck [12] at three different
viscosities of fluid. Our results have the same
tendency as Gl ̈ck: the higher the viscosity of
the fluid, the faster the plate is damped and
reaches the equilibrium state. However, there
exist slight discrepancies in the frequency and
the amplitude of oscillation. A different mesh
model could be the leading cause of these
discrepancies. Sodium liquid is the fluid domain
with specific viscosity and density in FSI
analysis of Monju’s thermowell. If its density
and viscosity change, its behavior could be
different. In four different cases listing in Table
I, lower viscosity of sodium liquid in the range
of 2.41 – 4.52×10⁻⁴ Pa.s causes a lower damping
coefficient; it may take a longer time for the
plate to reach the equilibrium state.
From the analytical calculation, the first
natural frequency of the simplified of a
clamped beam is defined as follows [12]:
 √
 (6)
Where I is the polar moment of inertia
and m is the total mass.
(a) = 0.2 Pa.s (b) = 1.0 Pa.s
(c) = 5.0 Pa.s
Fig. 5. Comparison of the displacements of the free end of the beam form three different fluid viscosities
with Gl ̈ck et al (2001) [12]
HOANG TAN HUNG et al.
21
However, our result only showed the
displacement of the plate in time. Therefore,
FFT is used to find the frequency of the plate to
compare it with the analytical calculations.
Applying the FFT of the displacements to the
case of the dynamic viscosity of 0.2 Pa.s, the
first natural frequency of the plate can be found,
f= 0.319 Hz. The analytical value of = 0.300
Hz is approximately equal to the simulation
value of Modal analysis 0.317 Hz (5.6%
difference) and FSI analysis 0.319 Hz (6.3 %
difference). It can be seen that the characteristic
of the oscillation of the plate is nearly the same
with the thermowell on the Monju reactor.
Therefore, the Modal and FSI calculation
models can be applied for fundamental analysis
of the oscillation of thermowell.
III. RESULTS AND DISCUSSION
Because the lock-in can occur when the
frequency of vortex shedding (fs) is close to
one of the natural frequencies (fi) of structures,
the Modal simulation set up to find the first six
natural frequencies of thermowell. Table II
shows the results of Modal analysis, the value
of frequencies are nearly equal in pair because
of the symmetry characteristic of the geometry
model of y and z-direction.
Table II. Natural frequency of thermowell
Mode 1 2 3 4 5 6
Natural
frequency
fN (Hz)
261.15 261.22 1611.70 1612.00 4327.20 4327.50
Four cases of 2D Fluent analysis were
performed to find the frequency of vortex
shedding (fs) of each flow condition with a
typical cross-section of thermowell. The
velocity of sodium flow is 5.20 m/s and 2.08
m/s, corresponding to the 100% and 40% flow
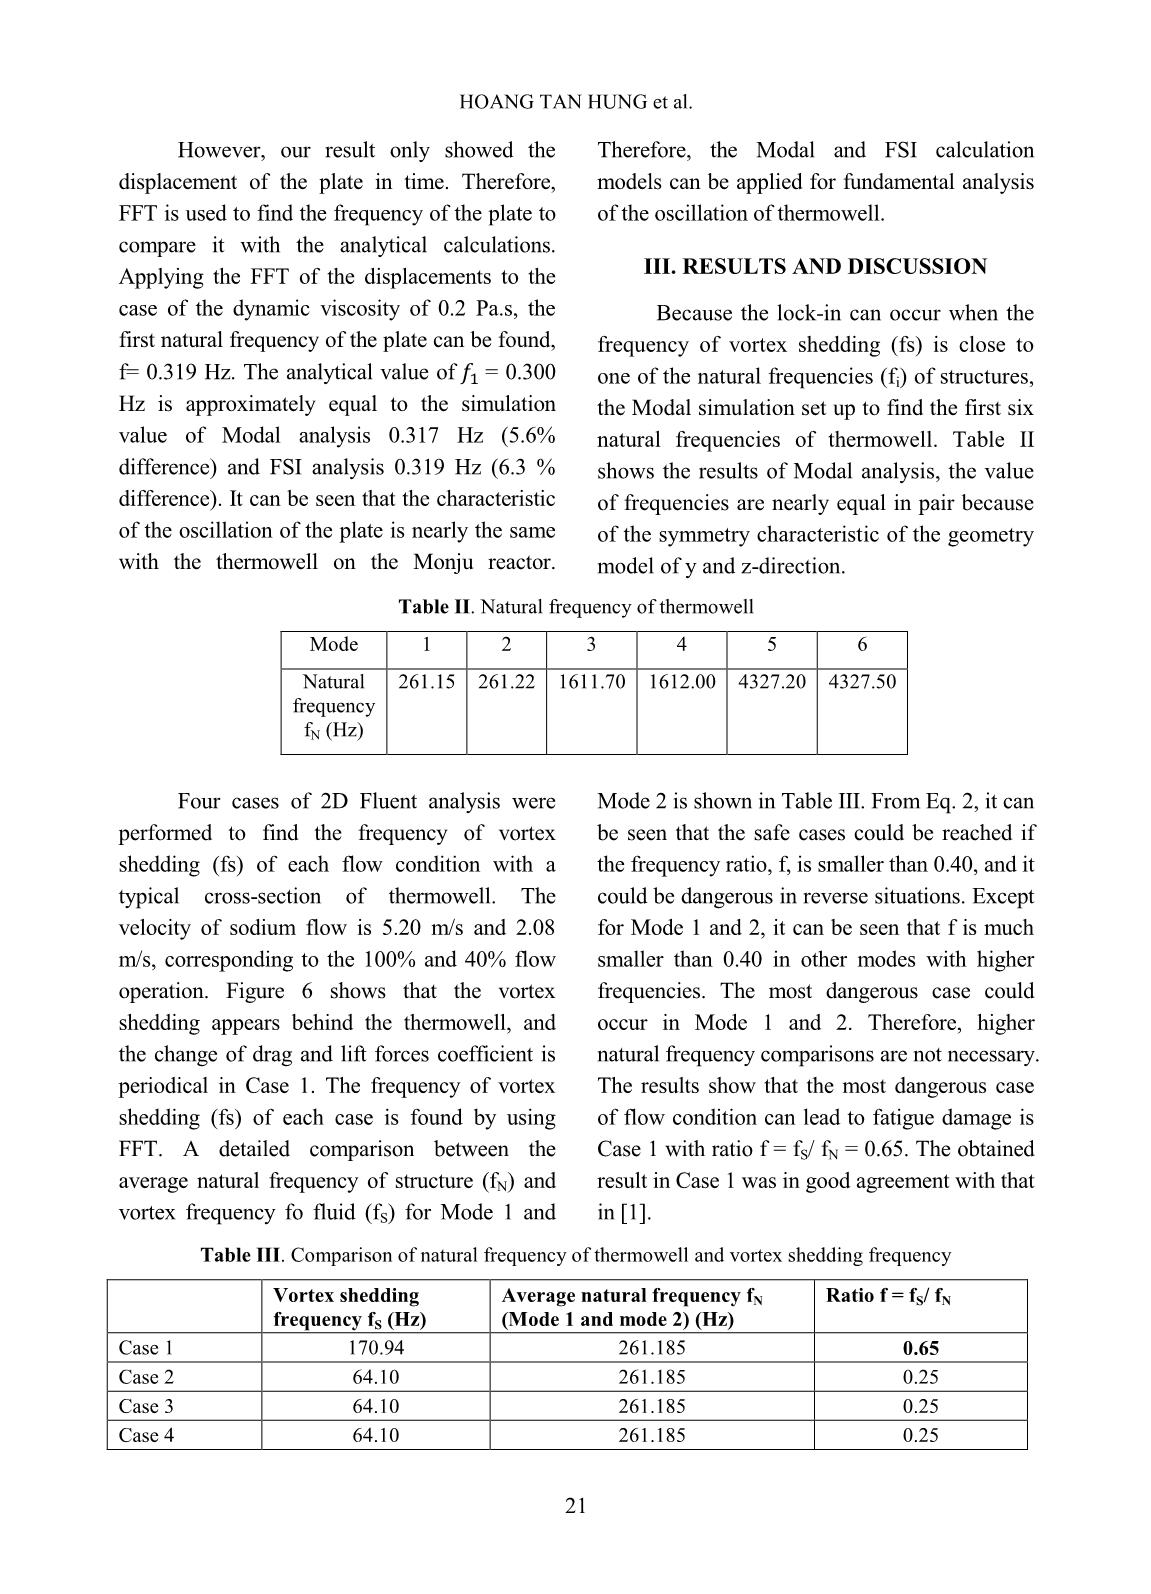
operation. Figure 6 shows that the vortex
shedding appears behind the thermowell, and
the change of drag and lift forces coefficient is
periodical in Case 1. The frequency of vortex
shedding (fs) of each case is found by using
FFT. A detailed comparison between the
average natural frequency of structure (fN) and
vortex frequency fo fluid (fS) for Mode 1 and
Mode 2 is shown in Table III. From Eq. 2, it can
be seen that the safe cases could be reached if
the frequency ratio, f, is smaller than 0.40, and it
could be dangerous in reverse situations. Except
for Mode 1 and 2, it can be seen that f is much
smaller than 0.40 in other modes with higher
frequencies. The most dangerous case could
occur in Mode 1 and 2. Therefore, higher
natural frequency comparisons are not necessary.
The results show that the most dangerous case
of flow condition can lead to fatigue damage is
Case 1 with ratio f = fS/ fN = 0.65. The obtained
result in Case 1 was in good agreement with that
in [1].
Table III. Comparison of natural frequency of thermowell and vortex shedding frequency
 Vortex shedding
frequency fS (Hz)
Average natural frequency fN
(Mode 1 and mode 2) (Hz)
Ratio f = fS/ fN
Case 1 170.94 261.185 0.65
Case 2 64.10 261.185 0.25
Case 3 64.10 261.185 0.25
Case 4 64.10 261.185 0.25
NUMERICAL INVESTIGATION OF FLUID – STRUCTURE INTERACTION (FSI)
22
a) Appearance of vortex shedding behind the
typical cross-section of thermowell
b) Lift coefficient and drag coefficient variations
of thermowell
Fig. 6. 2D Fluent vortex shedding (case 1)
According to the previous result, the
selected Case 1 was chosen for FSI analysis to
find the location and value of stress
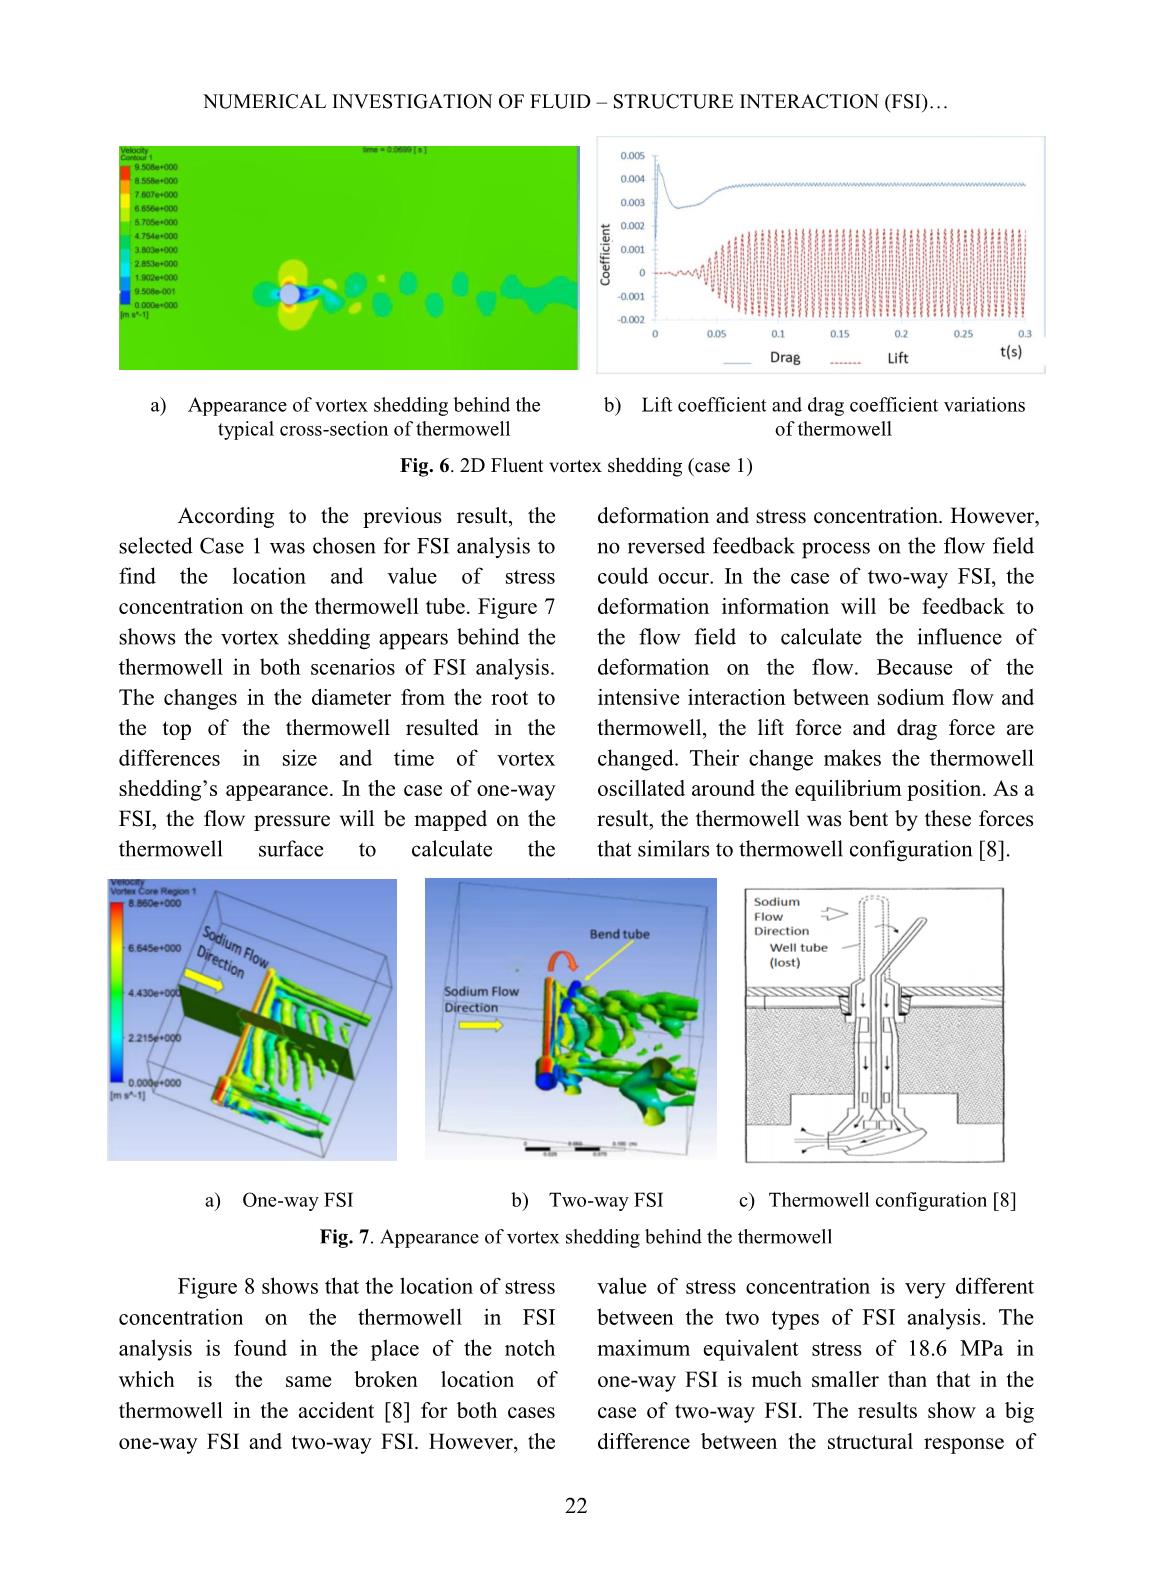
concentration on the thermowell tube. Figure 7
shows the vortex shedding appears behind the
thermowell in both scenarios of FSI analysis.
The changes in the diameter from the root to
the top of the thermowell resulted in the
differences in size and time of vortex
shedding’s appearance. In the case of one-way
FSI, the flow pressure will be mapped on the
thermowell surface to calculate the
deformation and stress concentration. However,
no reversed feedback process on the flow field
could occur. In the case of two-way FSI, the
deformation information will be feedback to
the flow field to calculate the influence of
deformation on the flow. Because of the
intensive interaction between sodium flow and
thermowell, the lift force and drag force are
changed. Their change makes the thermowell
oscillated around the equilibrium position. As a
result, the thermowell was bent by these forces
that similars to thermowell configuration [8].
a) One-way FSI b) Two-way FSI c) Thermowell configuration [8]
Fig. 7. Appearance of vortex shedding behind the thermowell
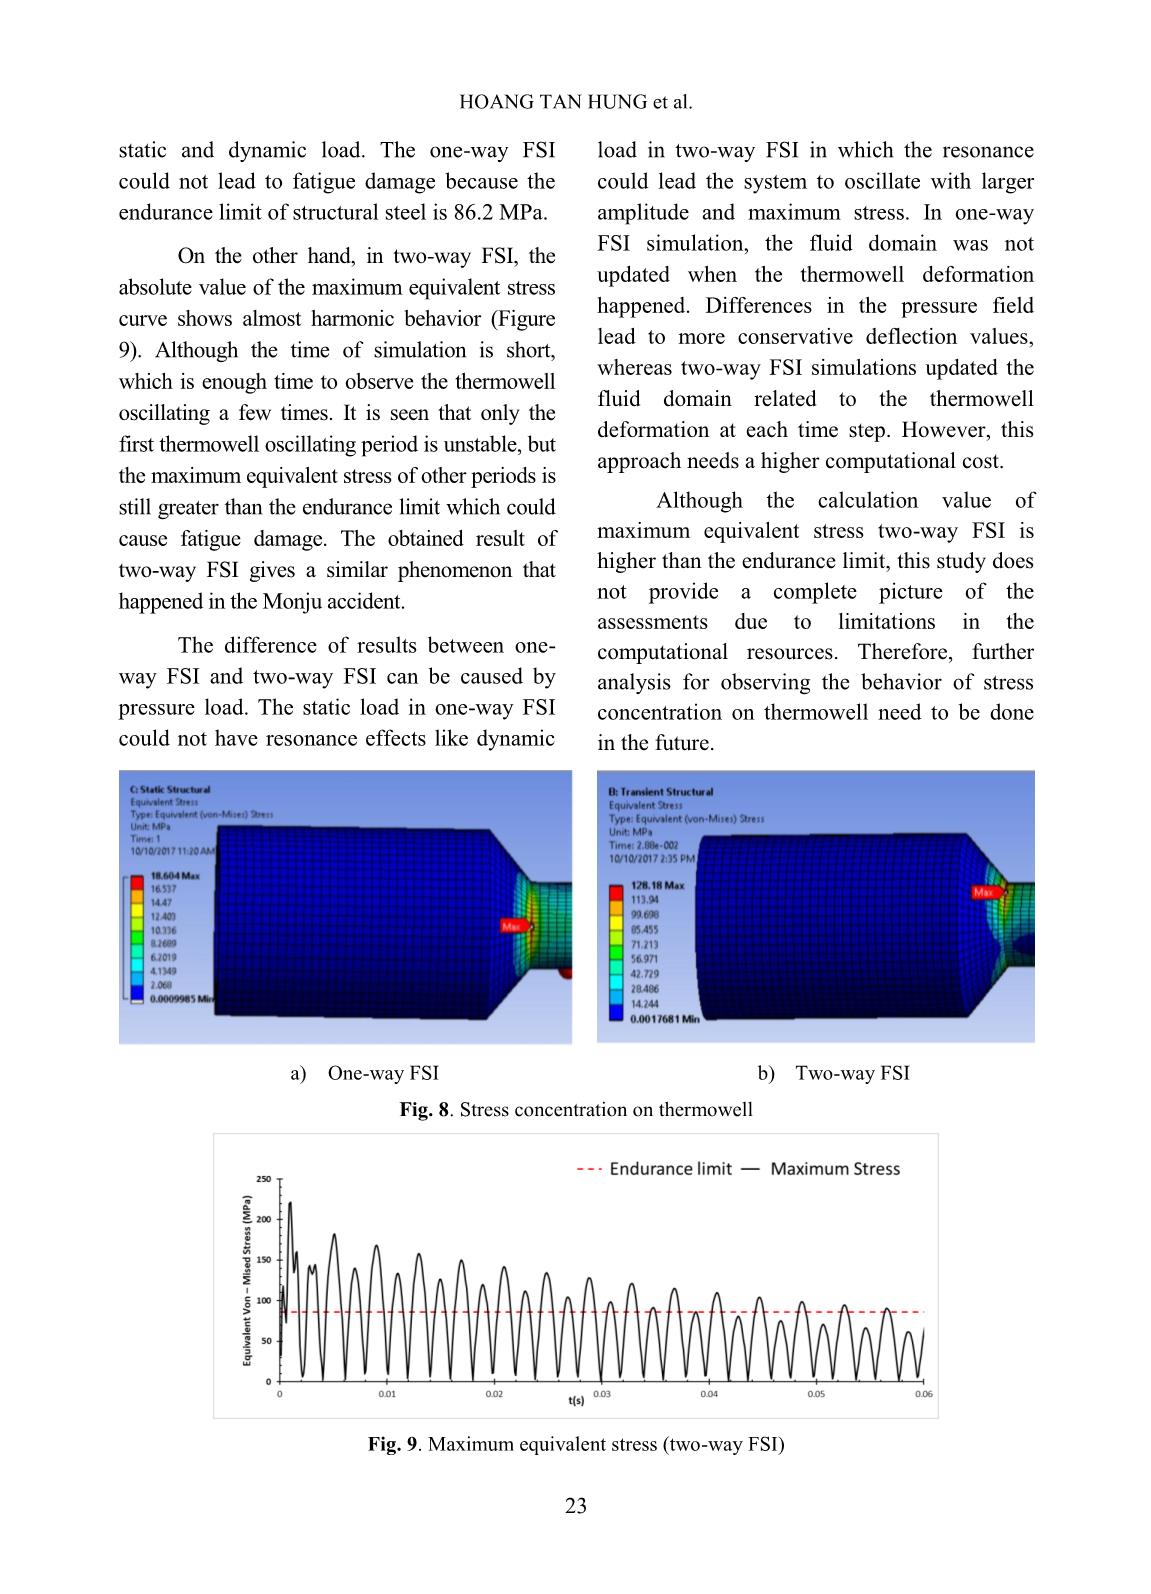
Figure 8 shows that the location of stress
concentration on the thermowell in FSI
analysis is found in the place of the notch
which is the same broken location of
thermowell in the accident [8] for both cases
one-way FSI and two-way FSI. However, the
value of stress concentration is very different
between the two types of FSI analysis. The
maximum equivalent stress of 18.6 MPa in
one-way FSI is much smaller than that in the
case of two-way FSI. The results show a big
difference between the structural response of
HOANG TAN HUNG et al.
23
static and dynamic load. The one-way FSI
could not lead to fatigue damage because the
endurance limit of structural steel is 86.2 MPa.
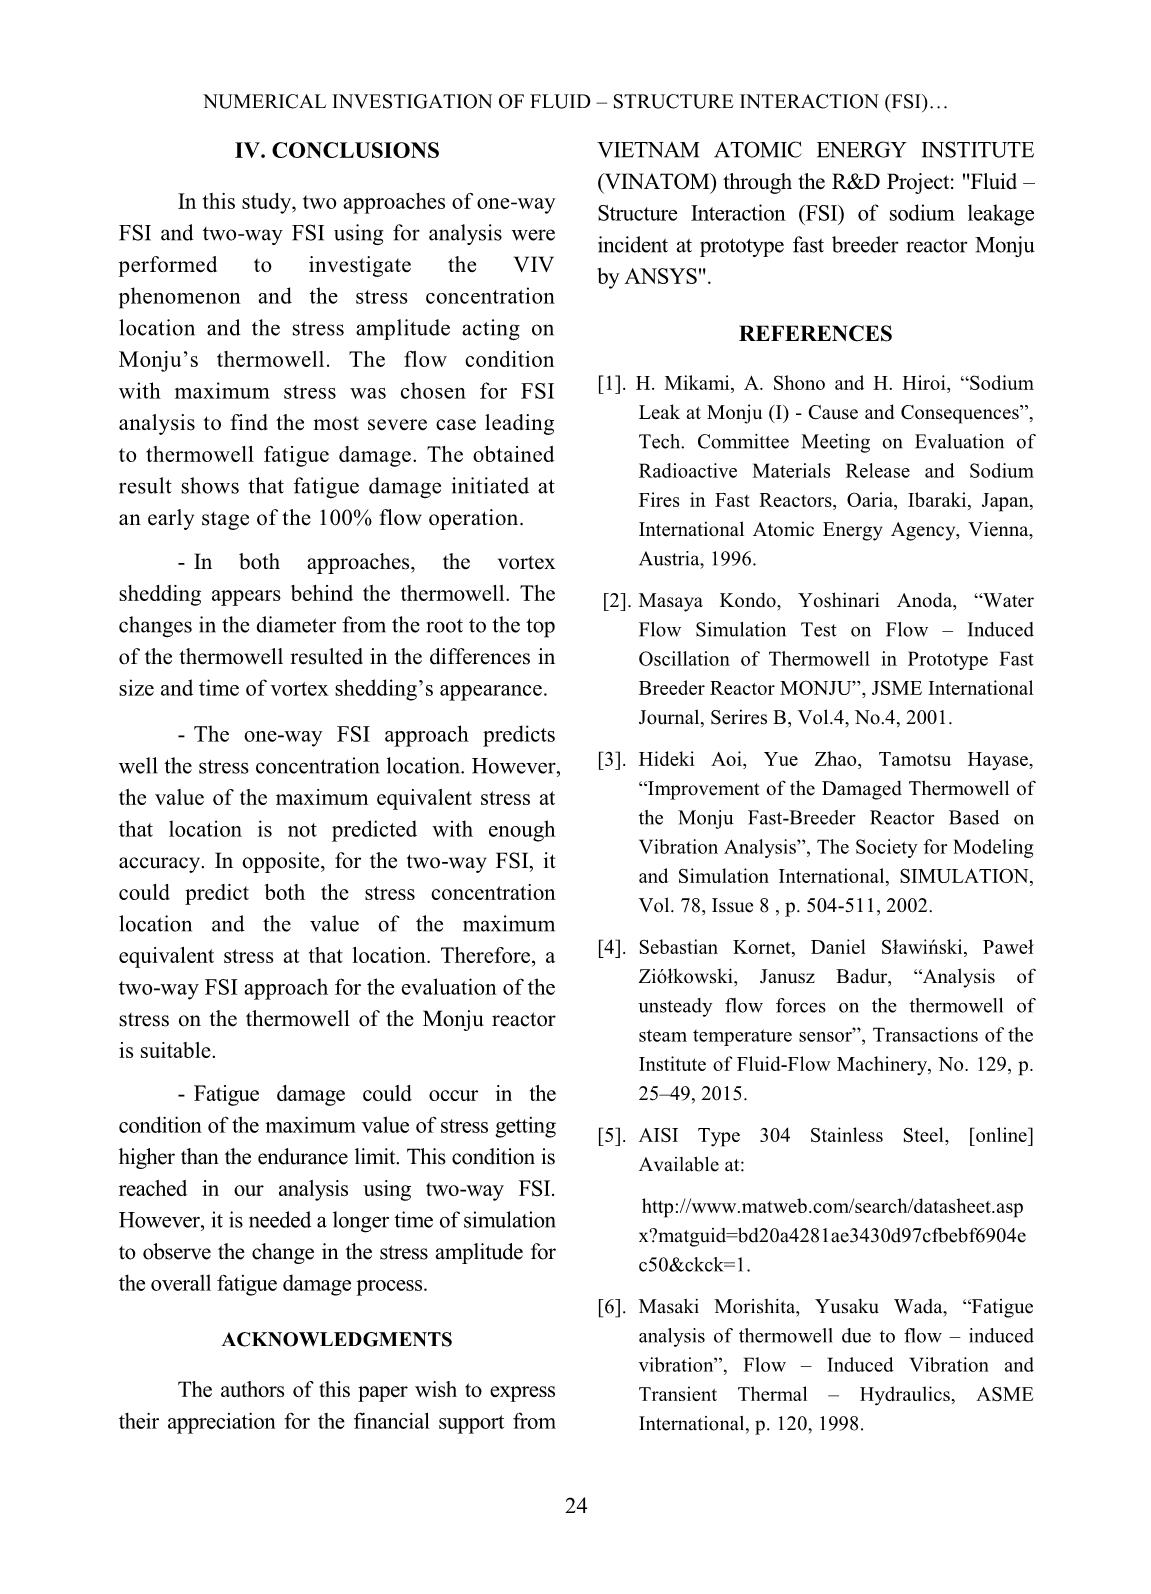
On the other hand, in two-way FSI, the
absolute value of the maximum equivalent stress
curve shows almost harmonic behavior (Figure
9). Although the time of simulation is short,
which is enough time to observe the thermowell
oscillating a few times. It is seen that only the
first thermowell oscillating period is unstable, but
the maximum equivalent stress of other periods is
still greater than the endurance limit which could
cause fatigue damage. The obtained result of
two-way FSI gives a similar phenomenon that
happened in the Monju accident.
The difference of results between one-
way FSI and two-way FSI can be caused by
pressure load. The static load in one-way FSI
could not have resonance effects like dynamic
load in two-way FSI in which the resonance
could lead the system to oscillate with larger
amplitude and maximum stress. In one-way
FSI simulation, the fluid domain was not
updated when the thermowell deformation
happened. Differences in the pressure field
lead to more conservative deflection values,
whereas two-way FSI simulations updated the
fluid domain related to the thermowell
deformation at each time step. However, this
approach needs a higher computational cost.
Although the calculation value of
maximum equivalent stress two-way FSI is
higher than the endurance limit, this study does
not provide a complete picture of the
assessments due to limitations in the
computational resources. Therefore, further
analysis for observing the behavior of stress
concentration on thermowell need to be done
in the future.
a) One-way FSI b) Two-way FSI
Fig. 8. Stress concentration on thermowell
Fig. 9. Maximum equivalent stress (two-way FSI)
NUMERICAL INVESTIGATION OF FLUID – STRUCTURE INTERACTION (FSI)
24
IV. CONCLUSIONS
In this study, two approaches of one-way
FSI and two-way FSI using for analysis were
performed to investigate the VIV
phenomenon and the stress concentration
location and the stress amplitude acting on
Monju’s thermowell. The flow condition
with maximum stress was chosen for FSI
analysis to find the most severe case leading
to thermowell fatigue damage. The obtained
result shows that fatigue damage initiated at
an early stage of the 100% flow operation.
- In both approaches, the vortex
shedding appears behind the thermowell. The
changes in the diameter from the root to the top
of the thermowell resulted in the differences in
size and time of vortex shedding’s appearance.
- The one-way FSI approach predicts
well the stress concentration location. However,
the value of the maximum equivalent stress at
that location is not predicted with enough
accuracy. In opposite, for the two-way FSI, it
could predict both the stress concentration
location and the value of the maximum
equivalent stress at that location. Therefore, a
two-way FSI approach for the evaluation of the
stress on the thermowell of the Monju reactor
is suitable.
- Fatigue damage could occur in the
condition of the maximum value of stress getting
higher than the endurance limit. This condition is
reached in our analysis using two-way FSI.
However, it is needed a longer time of simulation
to observe the change in the stress amplitude for
the overall fatigue damage process.
ACKNOWLEDGMENTS
The authors of this paper wish to express
their appreciation for the financial support from
VIETNAM ATOMIC ENERGY INSTITUTE
(VINATOM) through the R&D Project: "Fluid –
Structure Interaction (FSI) of sodium leakage
incident at prototype fast breeder reactor Monju
by ANSYS".
REFERENCES
[1]. H. Mikami, A. Shono and H. Hiroi, “Sodium
Leak at Monju (I) - Cause and Consequences”,
Tech. Committee Meeting on Evaluation of
Radioactive Materials Release and Sodium
Fires in Fast Reactors, Oaria, Ibaraki, Japan,
International Atomic Energy Agency, Vienna,
Austria, 1996.
 [2]. Masaya Kondo, Yoshinari Anoda, “Water
Flow Simulation Test on Flow – Induced
Oscillation of Thermowell in Prototype Fast
Breeder Reactor MONJU”, JSME International
Journal, Serires B, Vol.4, No.4, 2001.
[3]. Hideki Aoi, Yue Zhao, Tamotsu Hayase,
“Improvement of the Damaged Thermowell of
the Monju Fast-Breeder Reactor Based on
Vibration Analysis”, The Society for Modeling
and Simulation International, SIMULATION,
Vol. 78, Issue 8 , p. 504-511, 2002.
[4]. Sebastian Kornet, Daniel Sławiński, Paweł
Ziółkowski, Janusz Badur, “Analysis of
unsteady flow forces on the thermowell of
steam temperature sensor”, Transactions of the
Institute of Fluid-Flow Machinery, No. 129, p.
25–49, 2015.
[5]. AISI Type 304 Stainless Steel, [online]
Available at:
x?matguid=bd20a4281ae3430d97cfbebf6904e
c50&ckck=1.
[6]. Masaki Morishita, Yusaku Wada, “Fatigue
analysis of thermowell due to flow – induced
vibration”, Flow – Induced Vibration and
Transient Thermal – Hydraulics, ASME
International, p. 120, 1998.
HOANG TAN HUNG et al.
25
[7]. J.K.Fink, L.Leibowitz, “Thermodynamic and
Transport Properties of Sodium Liquid and
Vapor”, Argonne National Laboratory, pp. 86-
95 and p. 207, 1995.
[8]. A.Miyakawa, H.Maeda, Y.Kami, K.Ito,
“Sodium Leakage Experience at the Prototype
FBR Monju”, Unusual Occurrences during
LMFR Operation, IAEA-TECDOC-1180,
Vienna (Austria), p. 43 -56, 1998.
[9] Anton Gustafsson, “Analysis of Vortex-
Induced Vibrations of Rises”, Master’s thesis
in Applied Mechanics, Chalmers University Of
Technology, Sweden 2012.
[10]. Brauschke D., Wiklund D., Kitzman A., Zulic
D., “Thermowell calculations”, Emerson
Process Management, White Paper 00840–
0200–2654, Rev AC, p. 11, March 2014.
[11]. ANSYS Tutorials & Training Materials, “Fluid
Structure Interaction FSI with
ANSYS Fluent 17.0” and “ANSYS
Mechanical Linear and Nonlinear Dynamic”,
ANSYS Inc, 2016.
[12].Gl ̈ck, M., Breuer, M., Durst, F., Halfmann, A.,
Rank, E., “Computation of fluid–structure
interaction on lightweight structures”, Journal
of Wind Engineering and Industrial
Aerodynamics 89, p. 1351–1368, 2001.
File đính kèm:
 numerical_investigation_of_fluid_structure_interaction_fsi_o.pdf

