Một cách tiếp cận mới dựa trên ngưỡng để phát hiện vệt dầu loang trên biển trong các ảnh ra đa mặt mở tổng hợp
Ngày nay, hiện tượng dầu loang trên biển diễn ra khá phổ biến trên
các sông ngòi, biển và gây ra các hậu quả nghiêm trọng cho môi
trường nước. Vì vậy, việc phát hiện các vết dầu loang và đưa ra các
cảnh báo sớm về hiện tượng này nhận được sự quan tâm rất lớn trong
vài thập kỷ gần đây. Thực tế, người ta đã phát triển nhiều thuật toán
nhận dạng vết dầu loang trên biển sử dụng ảnh ra đa mặt mở tổng
hợp bởi vì chất lượng ảnh ít phụ thuộc vào điều kiện thời tiết, ngày
và đêm và có khả năng bắt giữ các sự kiện trên quy mô địa lý rộng
lớn. Trong đó, các thuật toán dựa trên ngưỡng khá phổ biến trong
thực tế vì thực hiện đơn giản. Tuy nhiên, những thuật toán này nói
chung có độ chính xác không cao. Bài báo này đề xuất một thuật toán
mới dựa trên ngưỡng để phát hiện vết dầu loang trên biển. Đây là
ngưỡng toàn cục được xác định dựa trên phân tích thống kê về cường
độ các điểm ảnh và kích thước của ảnh. Các kết quả mô phỏng của
thuật toán trên phần mềm Python được so sánh với các phương pháp
khác và chứng minh rằng phương pháp đề xuất đã cải thiện đáng kể
độ chính xác.
Trang 1
Trang 2
Trang 3
Trang 4
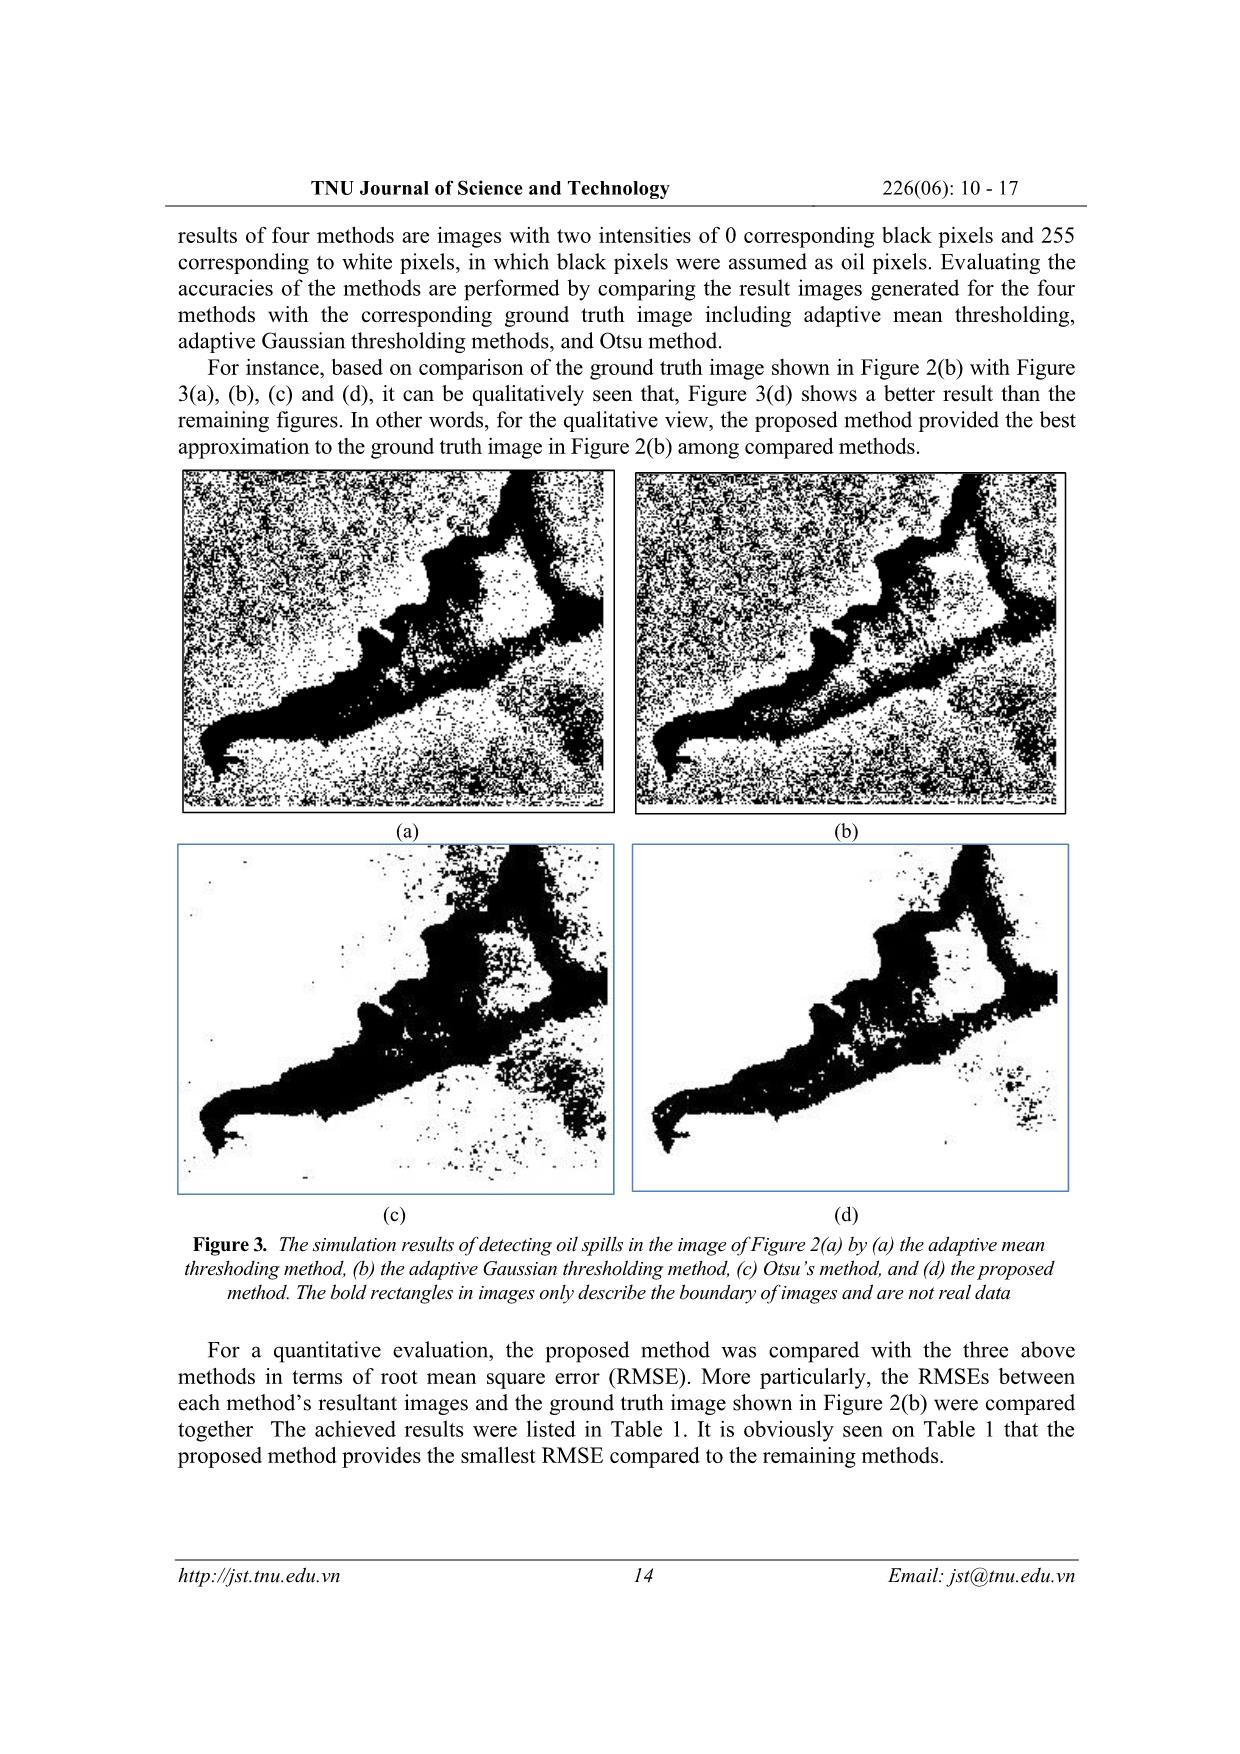
Trang 5
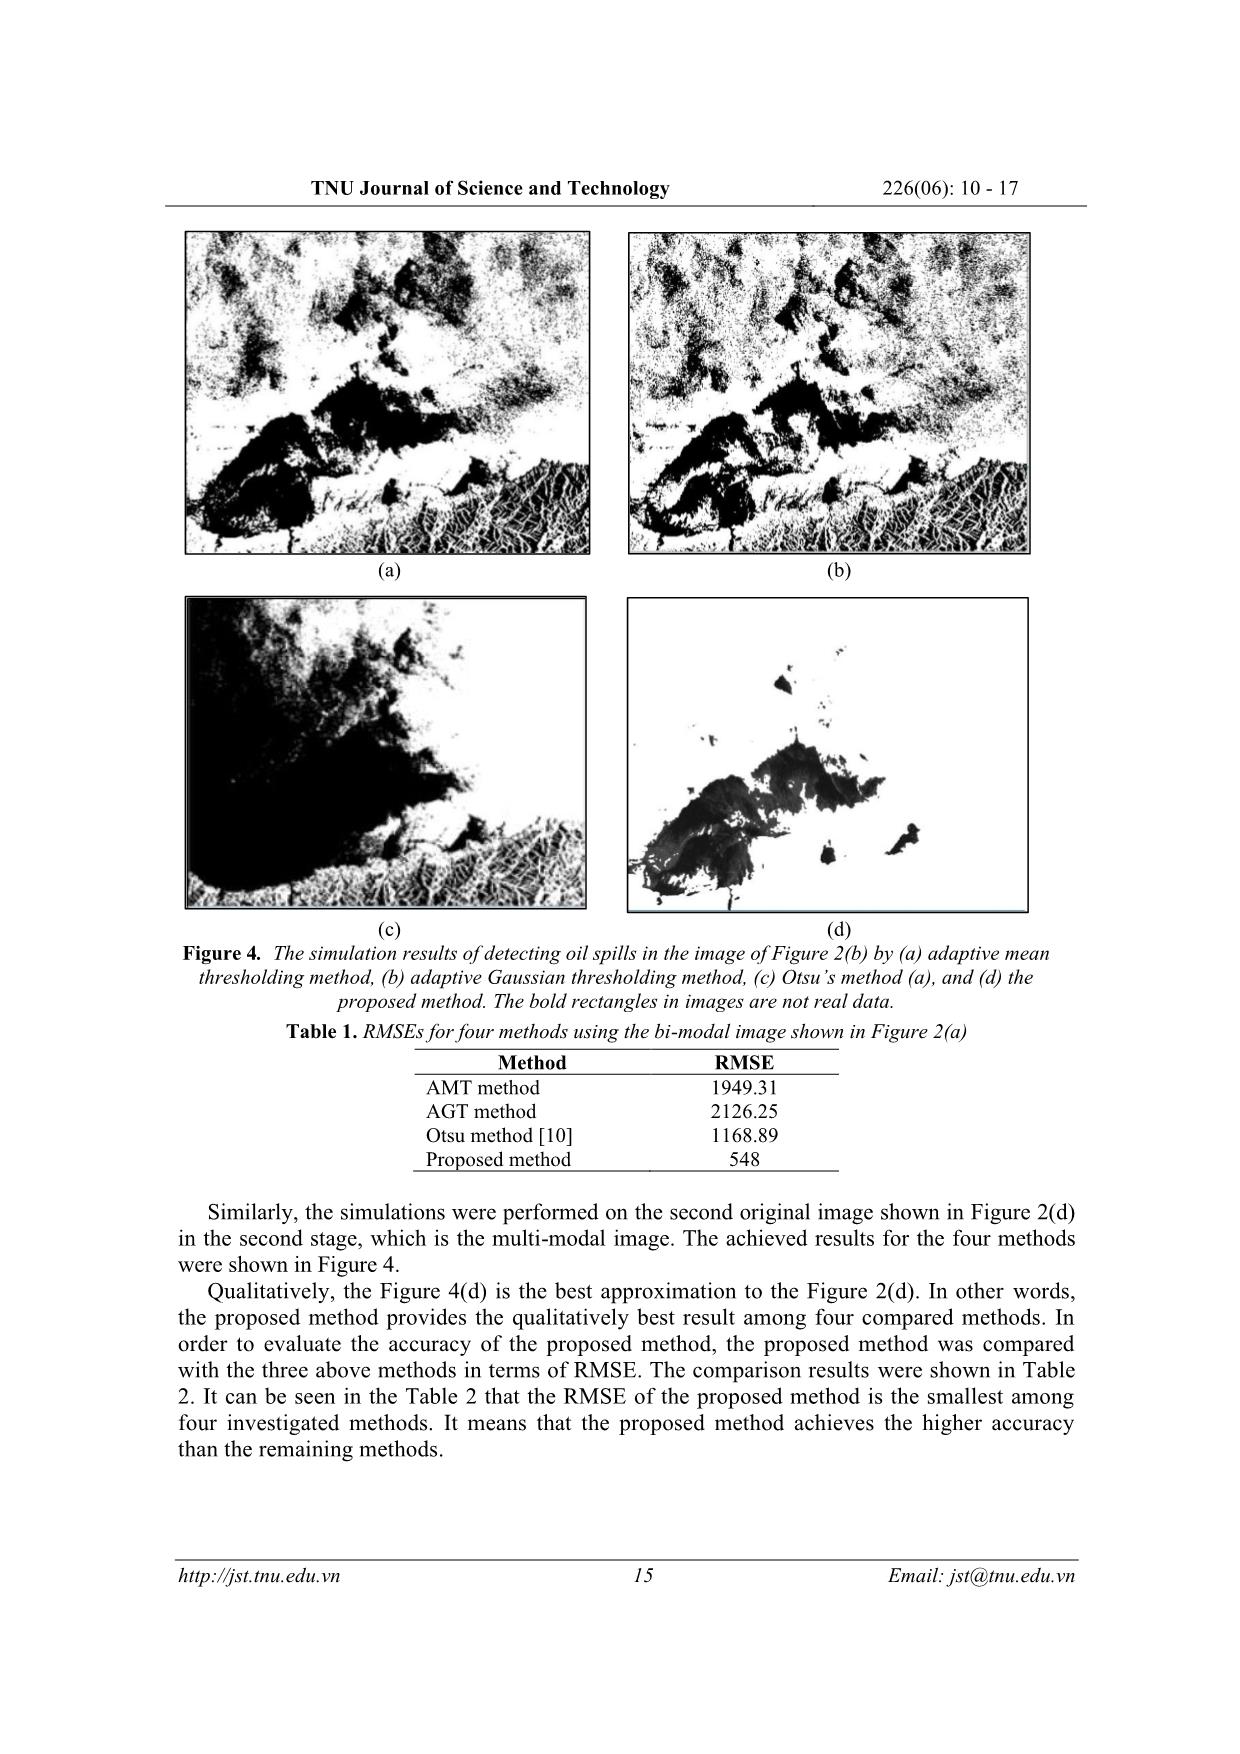
Trang 6
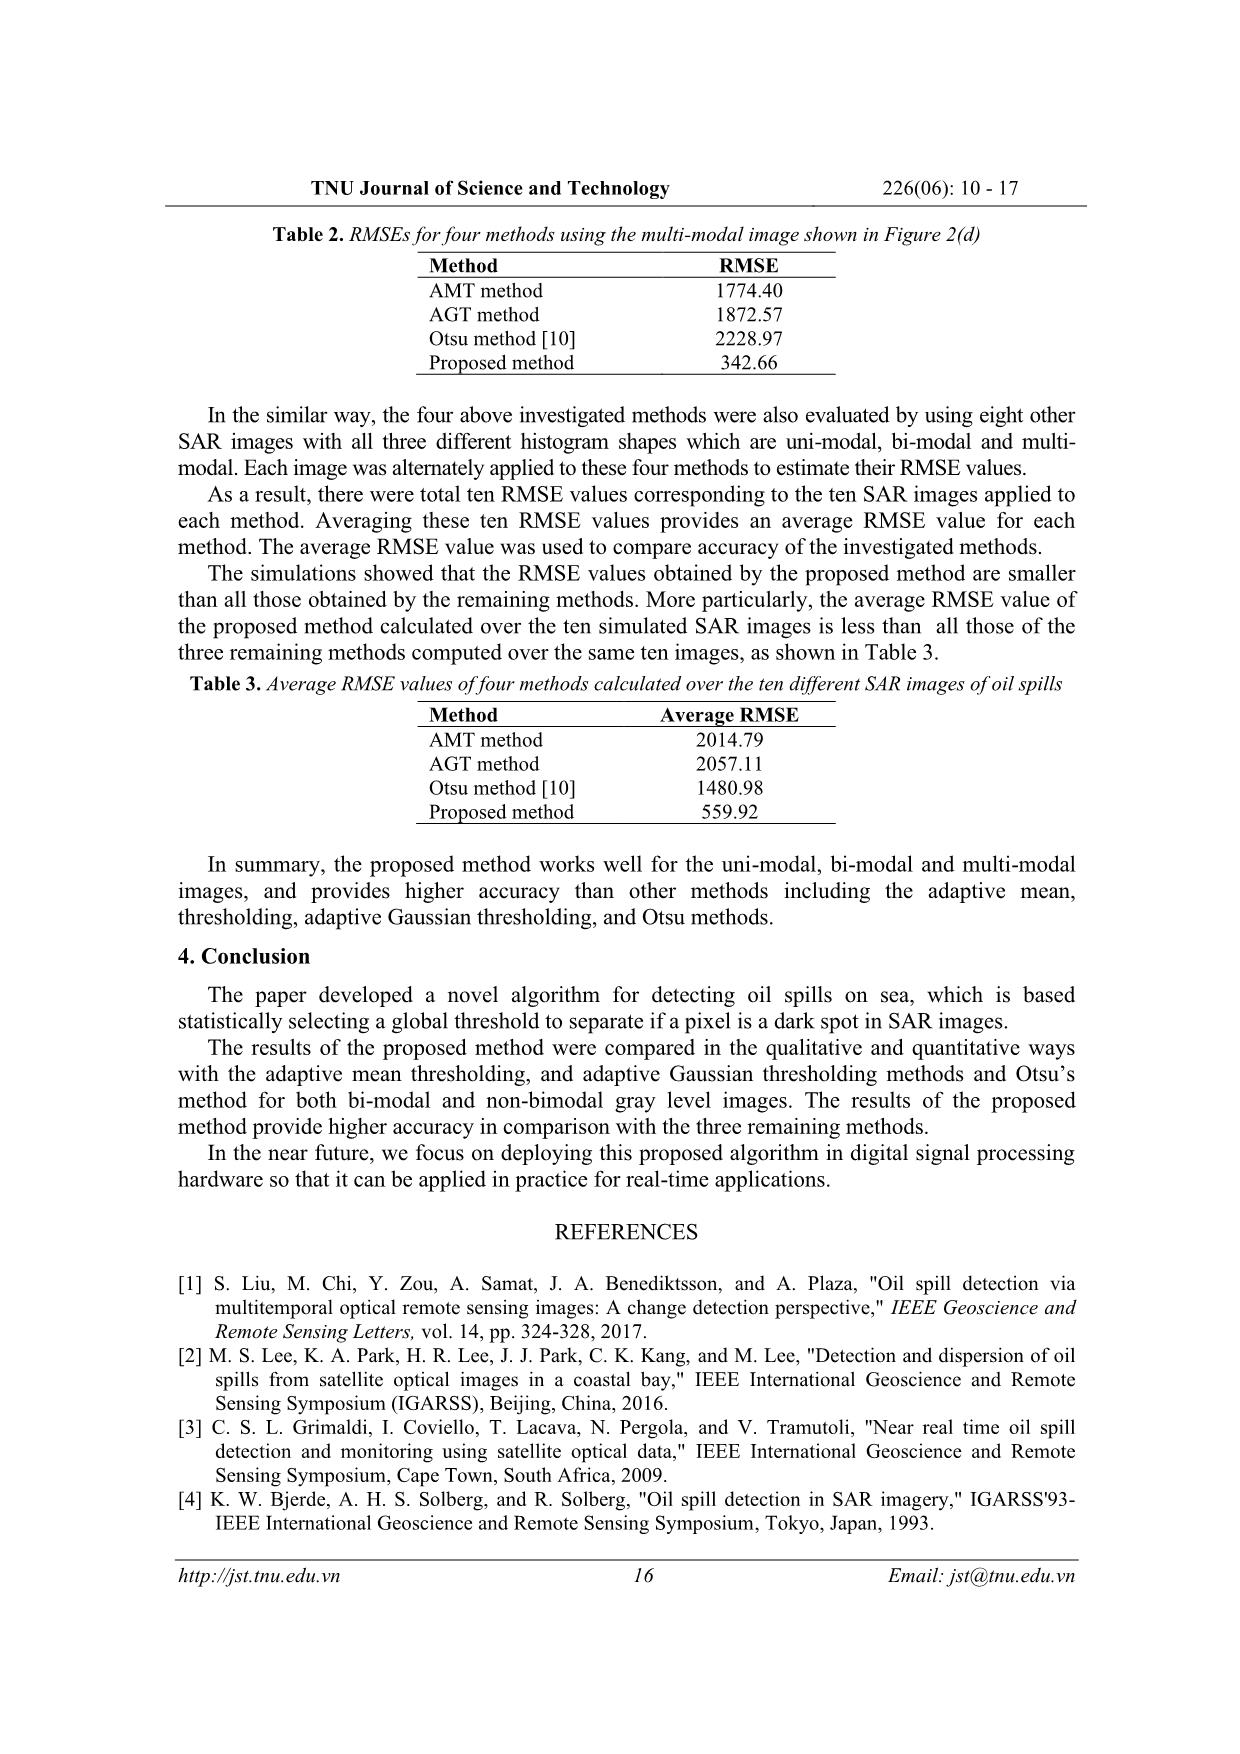
Trang 7
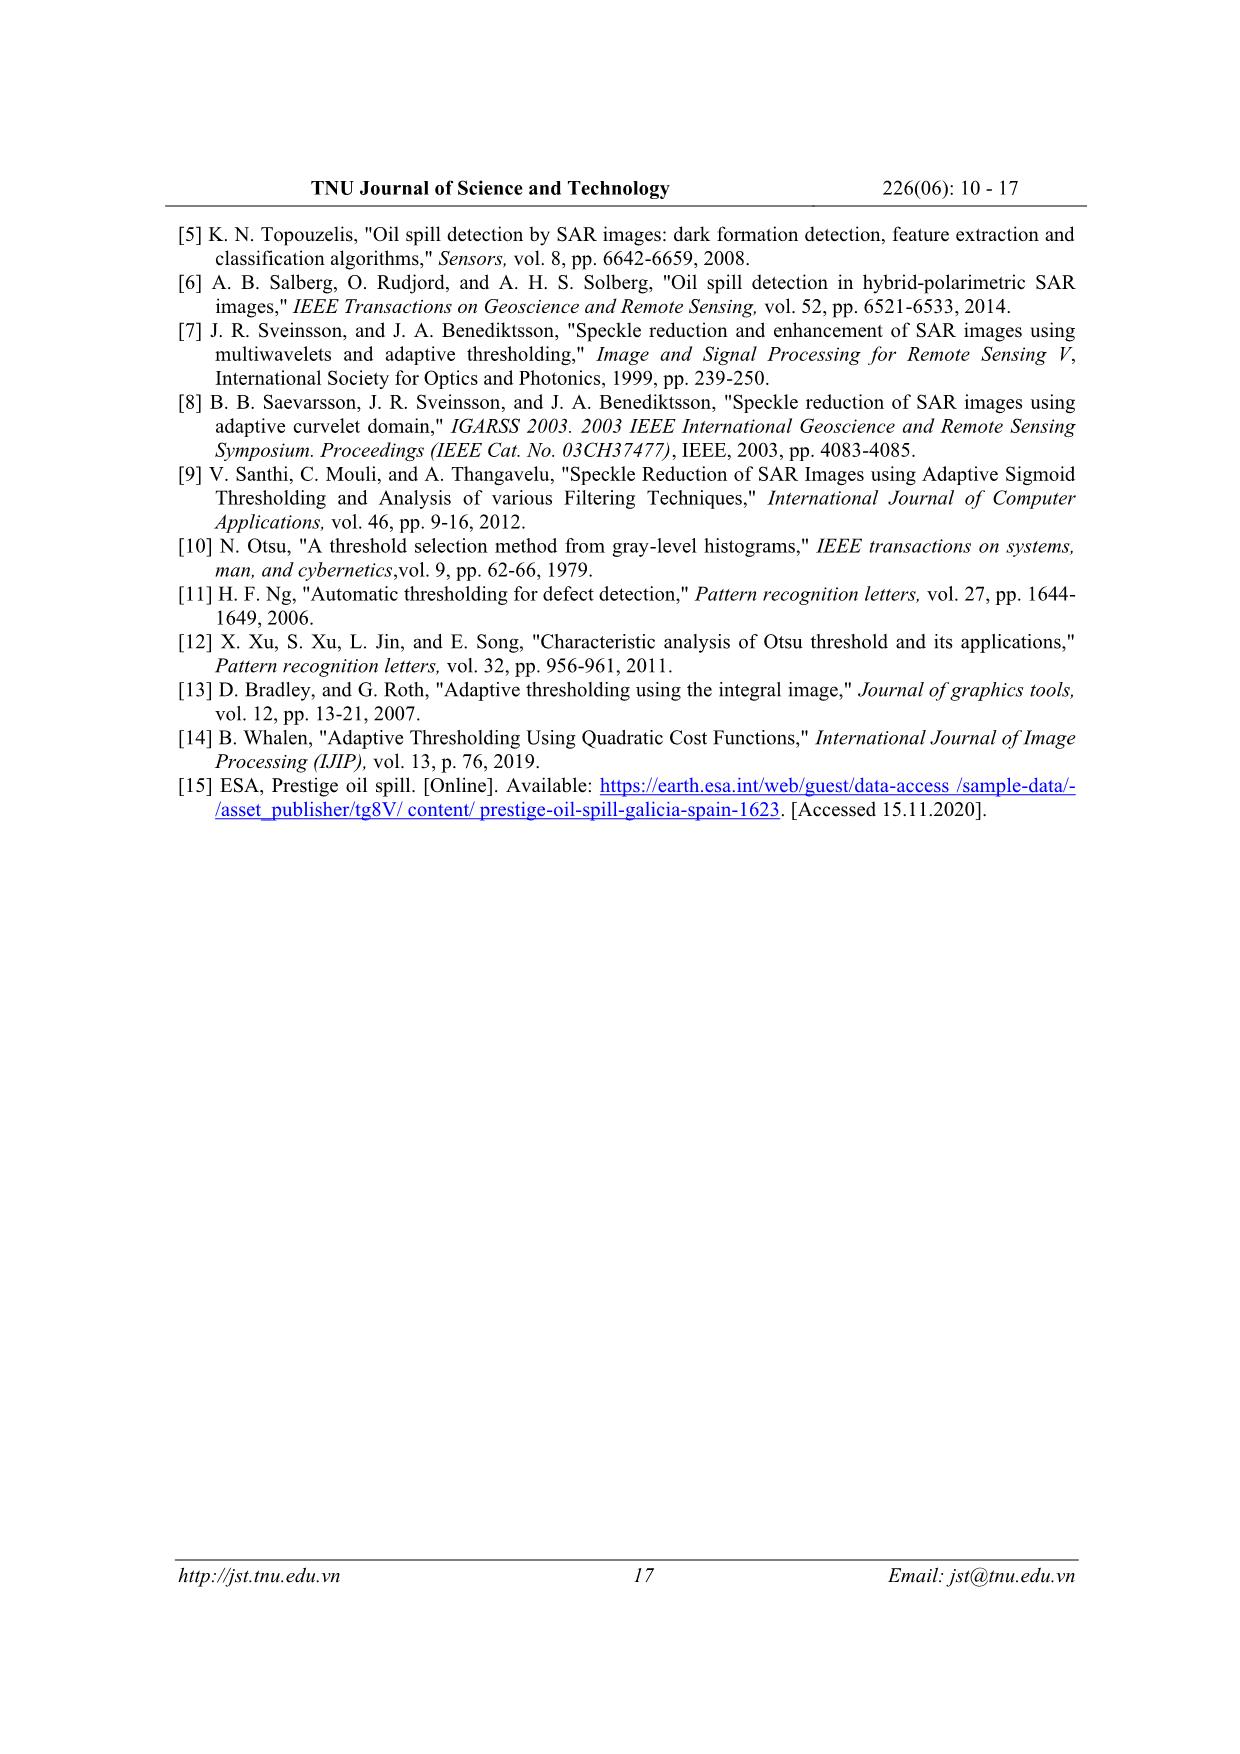
Trang 8
Tóm tắt nội dung tài liệu: Một cách tiếp cận mới dựa trên ngưỡng để phát hiện vệt dầu loang trên biển trong các ảnh ra đa mặt mở tổng hợp
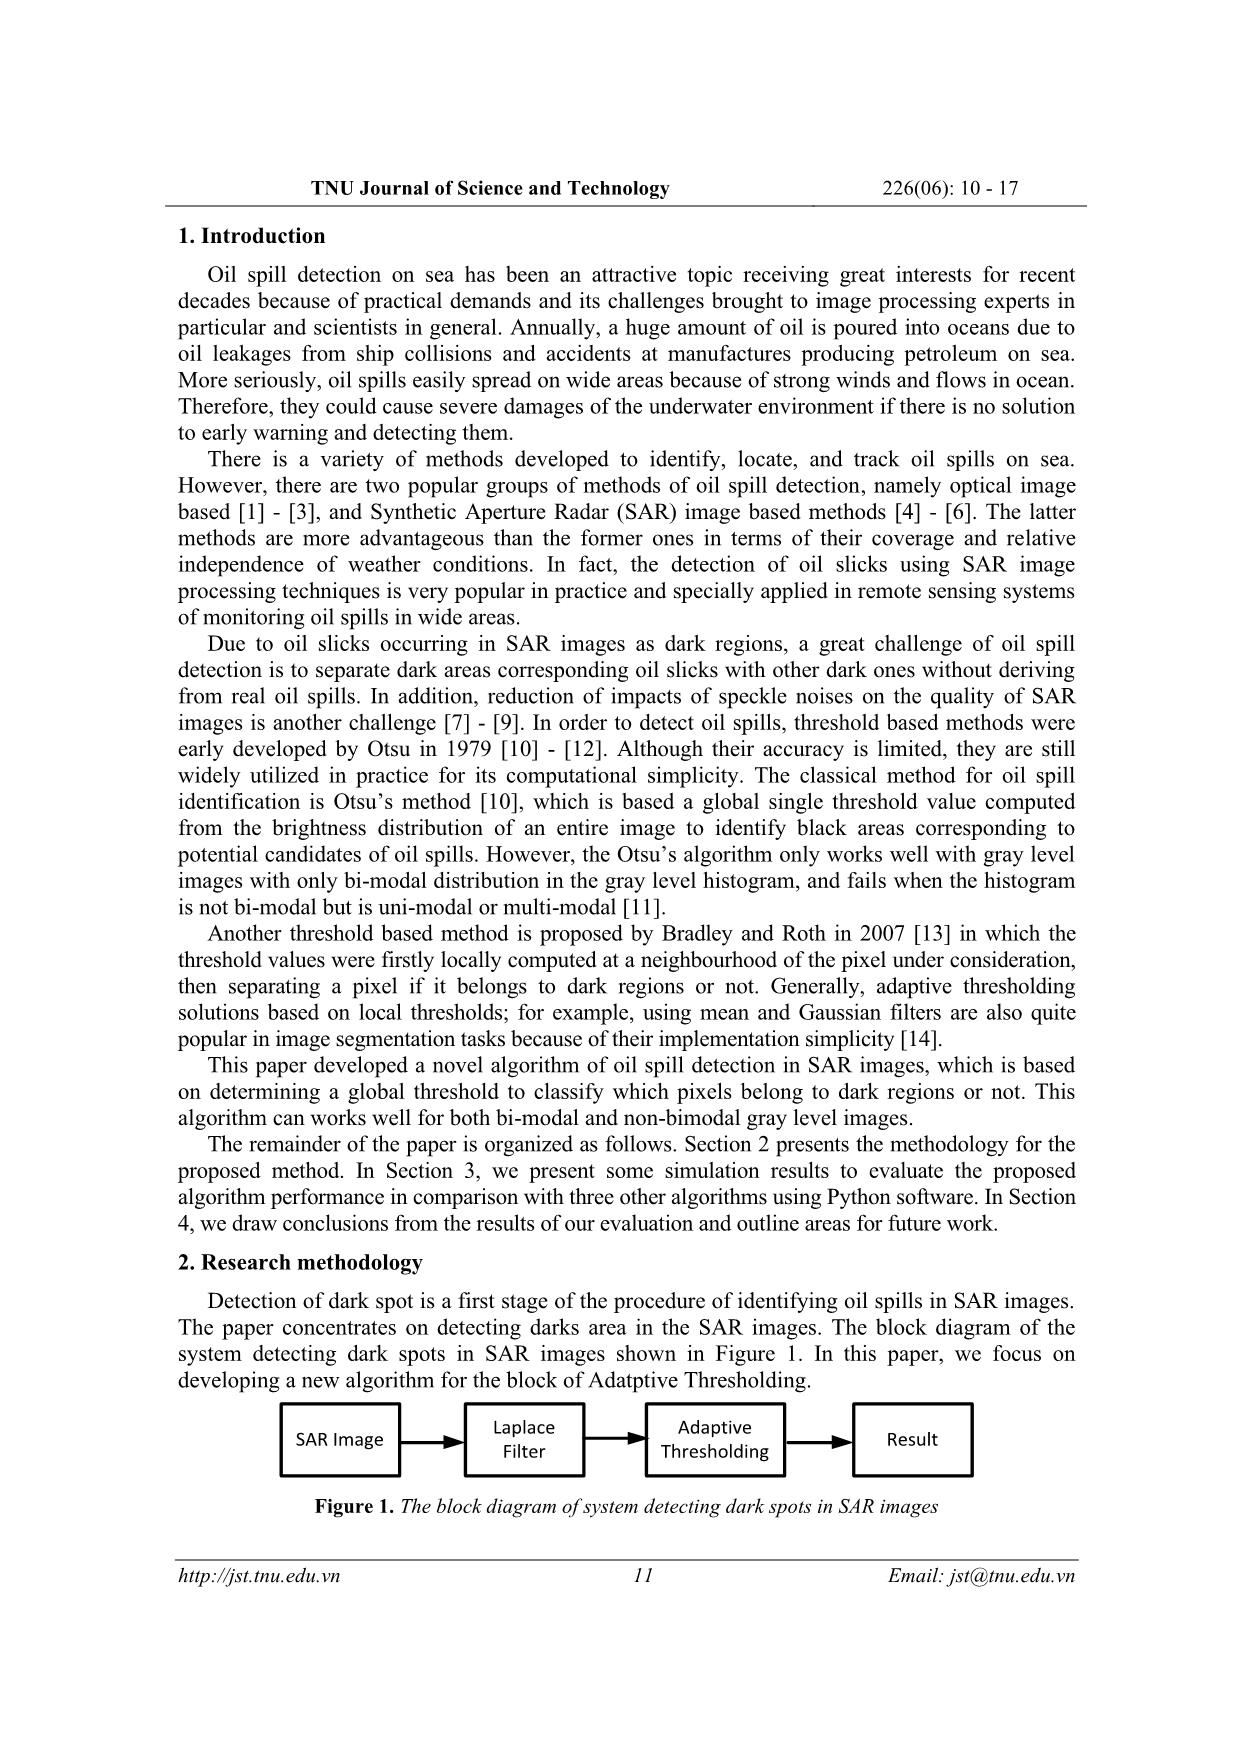
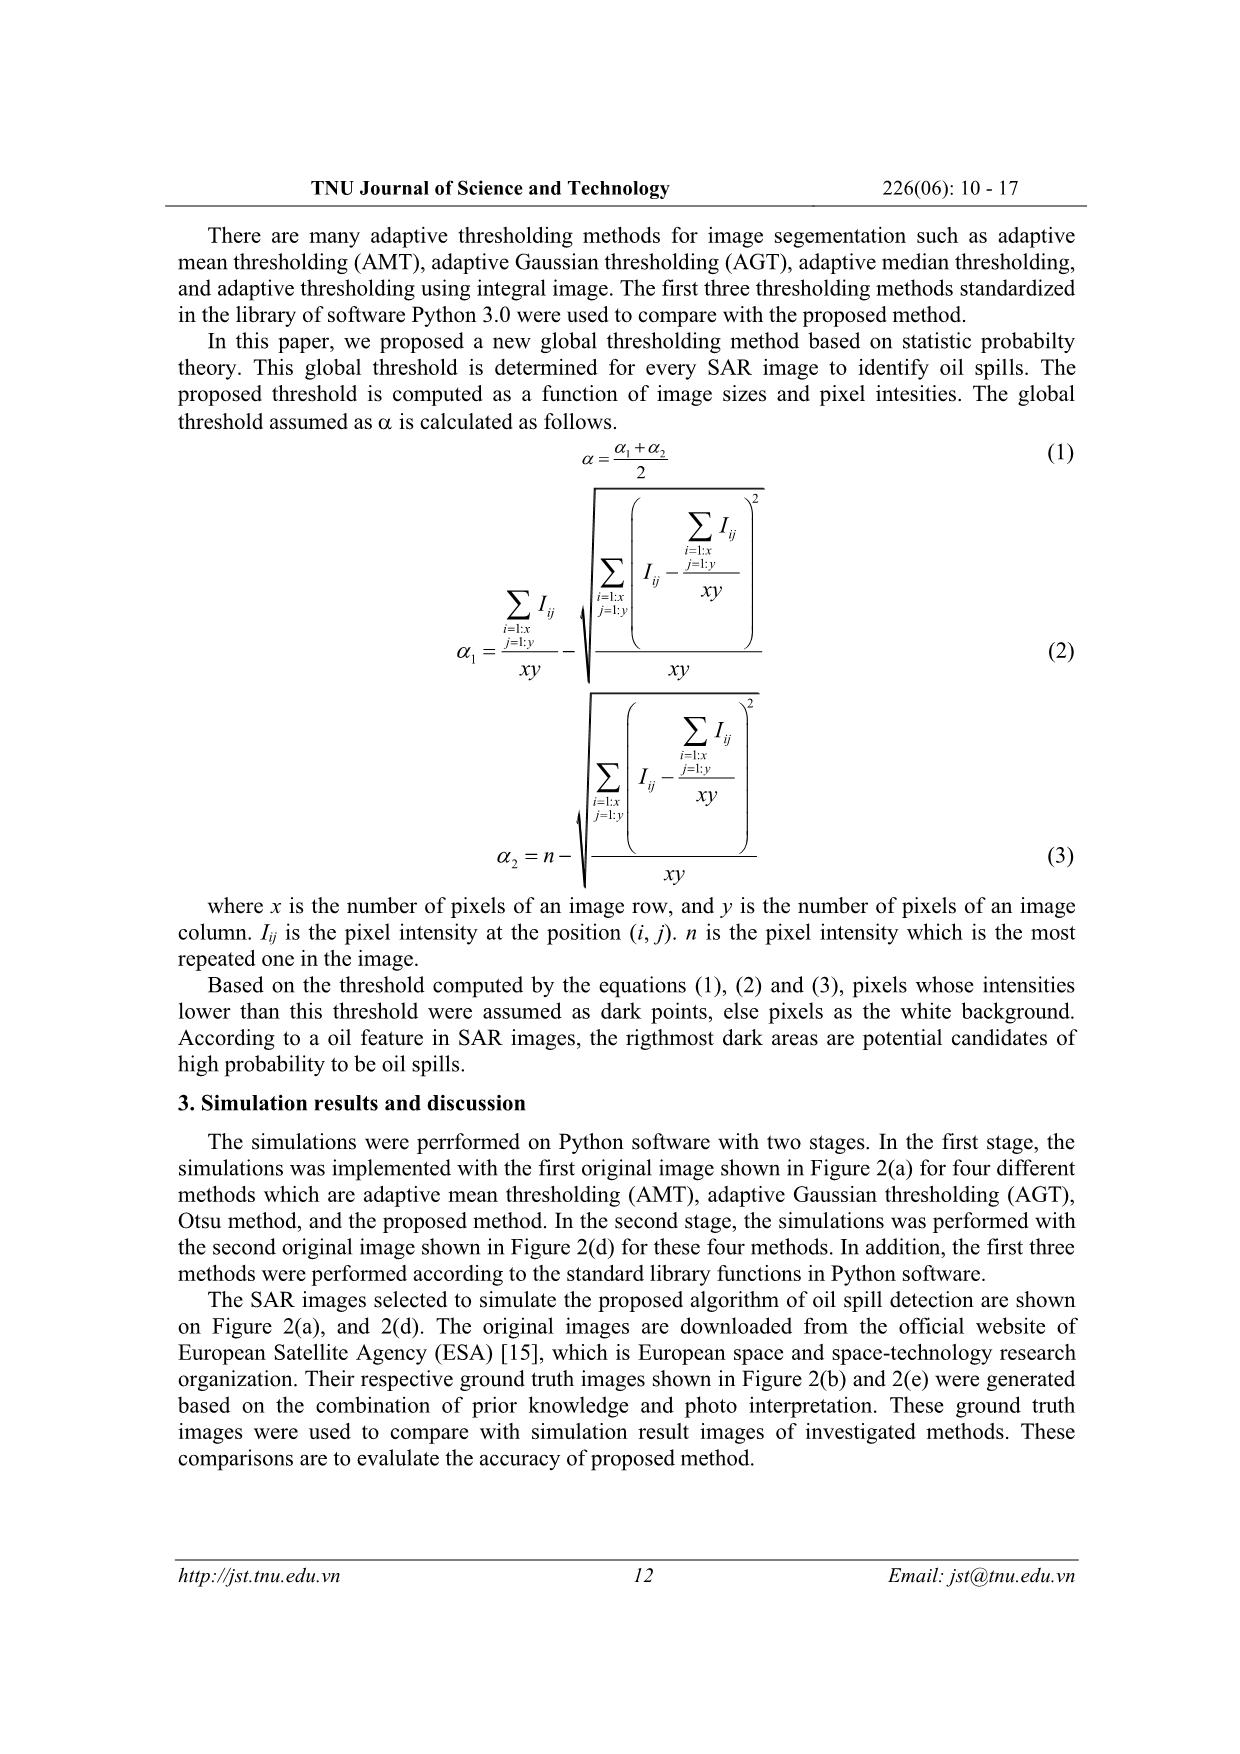
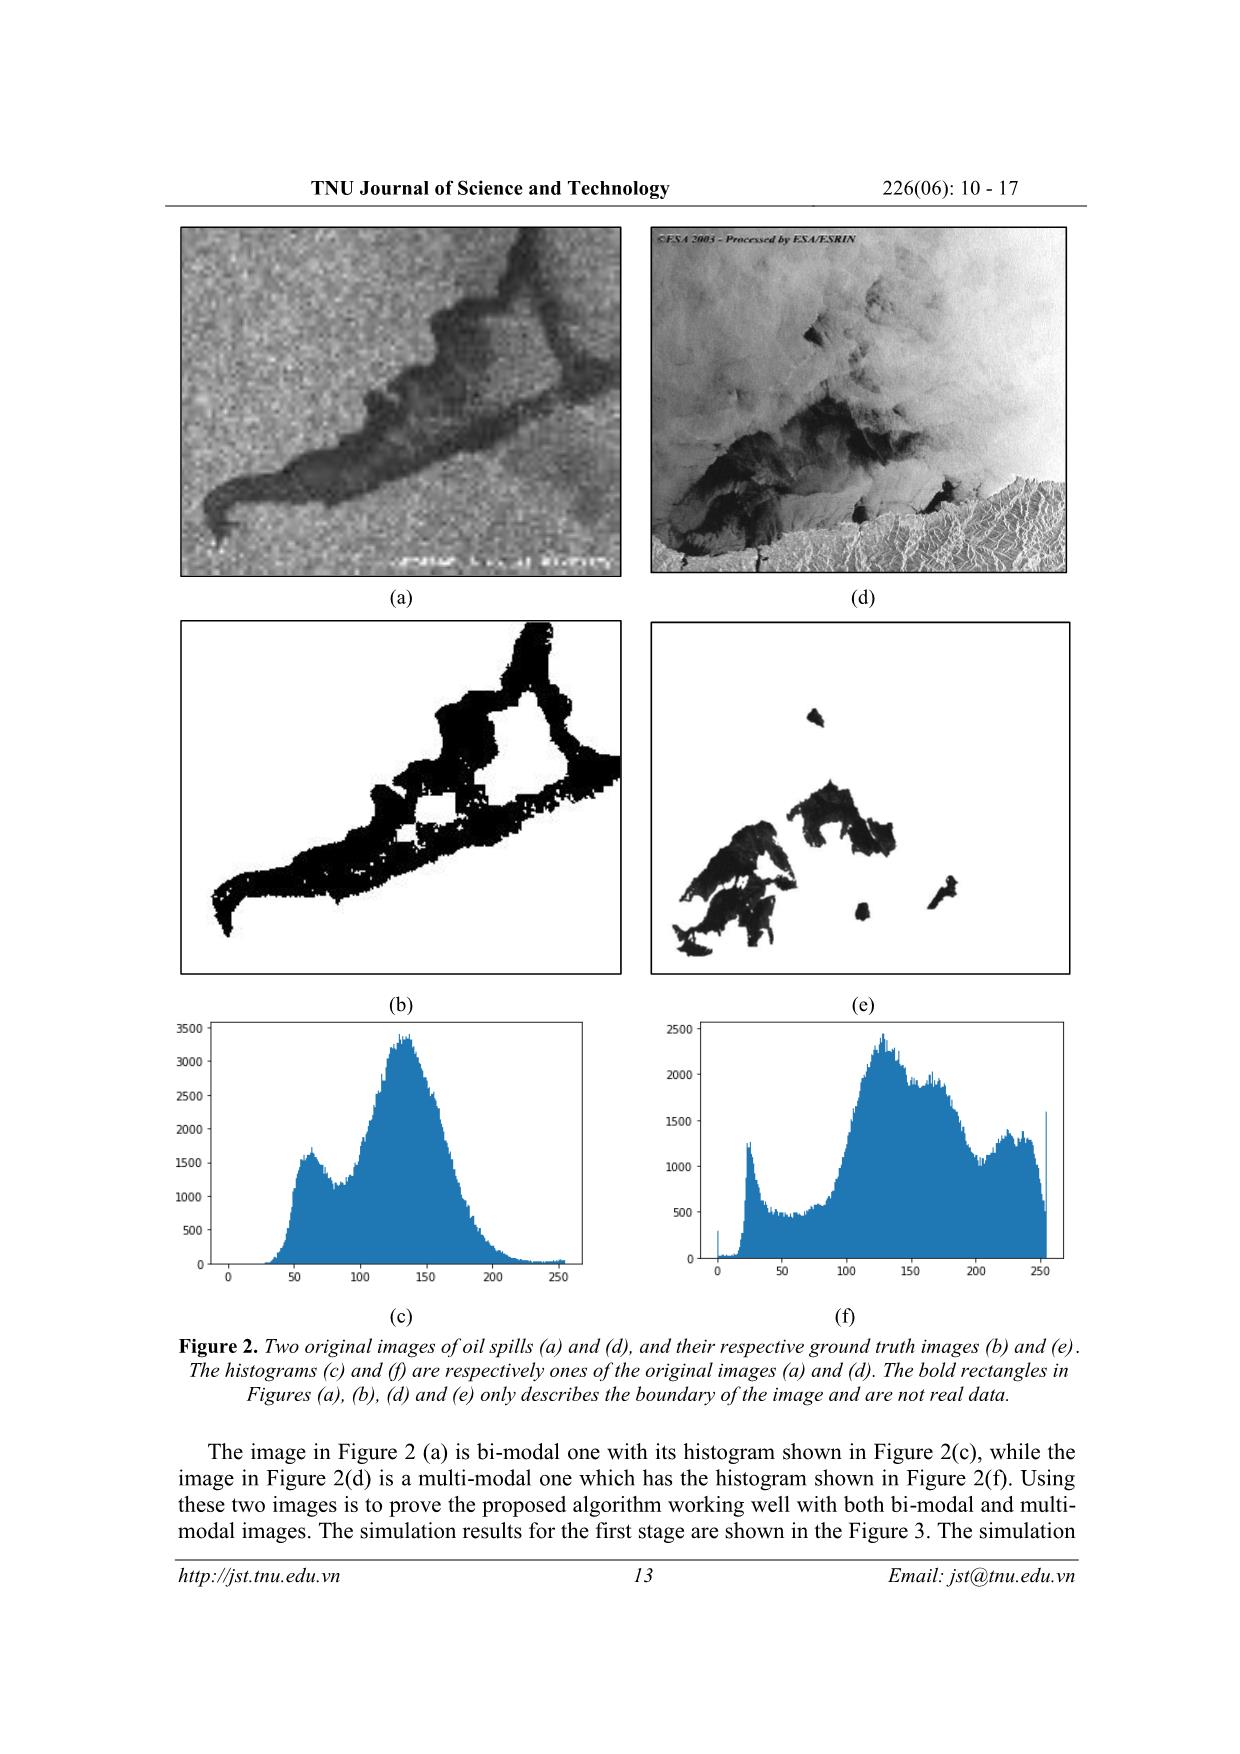
ide areas. Due to oil slicks occurring in SAR images as dark regions, a great challenge of oil spill detection is to separate dark areas corresponding oil slicks with other dark ones without deriving from real oil spills. In addition, reduction of impacts of speckle noises on the quality of SAR images is another challenge [7] - [9]. In order to detect oil spills, threshold based methods were early developed by Otsu in 1979 [10] - [12]. Although their accuracy is limited, they are still widely utilized in practice for its computational simplicity. The classical method for oil spill identification is Otsu’s method [10], which is based a global single threshold value computed from the brightness distribution of an entire image to identify black areas corresponding to potential candidates of oil spills. However, the Otsu’s algorithm only works well with gray level images with only bi-modal distribution in the gray level histogram, and fails when the histogram is not bi-modal but is uni-modal or multi-modal [11]. Another threshold based method is proposed by Bradley and Roth in 2007 [13] in which the threshold values were firstly locally computed at a neighbourhood of the pixel under consideration, then separating a pixel if it belongs to dark regions or not. Generally, adaptive thresholding solutions based on local thresholds; for example, using mean and Gaussian filters are also quite popular in image segmentation tasks because of their implementation simplicity [14]. This paper developed a novel algorithm of oil spill detection in SAR images, which is based on determining a global threshold to classify which pixels belong to dark regions or not. This algorithm can works well for both bi-modal and non-bimodal gray level images. The remainder of the paper is organized as follows. Section 2 presents the methodology for the proposed method. In Section 3, we present some simulation results to evaluate the proposed algorithm performance in comparison with three other algorithms using Python software. In Section 4, we draw conclusions from the results of our evaluation and outline areas for future work. 2. Research methodology Detection of dark spot is a first stage of the procedure of identifying oil spills in SAR images. The paper concentrates on detecting darks area in the SAR images. The block diagram of the system detecting dark spots in SAR images shown in Figure 1. In this paper, we focus on developing a new algorithm for the block of Adatptive Thresholding. Laplace Adaptive SAR Image Result Filter Thresholding Figure 1. The block diagram of system detecting dark spots in SAR images 11 Email: jst@tnu.edu.vn TNU Journal of Science and Technology 226(06): 10 - 17 There are many adaptive thresholding methods for image segementation such as adaptive mean thresholding (AMT), adaptive Gaussian thresholding (AGT), adaptive median thresholding, and adaptive thresholding using integral image. The first three thresholding methods standardized in the library of software Python 3.0 were used to compare with the proposed method. In this paper, we proposed a new global thresholding method based on statistic probabilty theory. This global threshold is determined for every SAR image to identify oil spills. The proposed threshold is computed as a function of image sizes and pixel intesities. The global threshold assumed as is calculated as follows. + = 12 (1) 2 2 Iij ix=1: jy=1: Iij − ix=1: xy Iij jy=1: ix=1: =−jy=1: (2) 1 xy xy 2 Iij ix=1: jy=1: Iij − ix=1: xy jy=1: =−n (3) 2 xy where x is the number of pixels of an image row, and y is the number of pixels of an image column. Iij is the pixel intensity at the position (i, j). n is the pixel intensity which is the most repeated one in the image. Based on the threshold computed by the equations (1), (2) and (3), pixels whose intensities lower than this threshold were assumed as dark points, else pixels as the white background. According to a oil feature in SAR images, the rigthmost dark areas are potential candidates of high probability to be oil spills. 3. Simulation results and discussion The simulations were perrformed on Python software with two stages. In the first stage, the simulations was implemented with the first original image shown in Figure 2(a) for four different methods which are adaptive mean thresholding (AMT), adaptive Gaussian thresholding (AGT), Otsu method, and the proposed method. In the second stage, the simulations was performed with the second original image shown in Figure 2(d) for these four methods. In addition, the first three methods were performed according to the standard library functions in Python software. The SAR images selected to simulate the proposed algorithm of oil spill detection are shown on Figure 2(a), and 2(d). The original images are downloaded from the official website of European Satellite Agency (ESA) [15], which is European space and space-technology research organization. Their respective ground truth images shown in Figure 2(b) and 2(e) were generated based on the combination of prior knowledge and photo interpretation. These ground truth images were used to compare with simulation result images of investigated methods. These comparisons are to evalulate the accuracy of proposed method. 12 Email: jst@tnu.edu.vn TNU Journal of Science and Technology 226(06): 10 - 17 (a) (d) (b) (e) (c) (f) Figure 2. Two original images of oil spills (a) and (d), and their respective ground truth images (b) and (e). The histograms (c) and (f) are respectively ones of the original images (a) and (d). The bold rectangles in Figures (a), (b), (d) and (e) only describes the boundary of the image and are not real data. The image in Figure 2 (a) is bi-modal one with its histogram shown in Figure 2(c), while the image in Figure 2(d) is a multi-modal one which has the histogram shown in Figure 2(f). Using these two images is to prove the proposed algorithm working well with both bi-modal and multi- modal images. The simulation results for the first stage are shown in the Figure 3. The simulation 13 Email: jst@tnu.edu.vn TNU Journal of Science and Technology 226(06): 10 - 17 results of four methods are images with two intensities of 0 corresponding black pixels and 255 corresponding to white pixels, in which black pixels were assumed as oil pixels. Evaluating the accuracies of the methods are performed by comparing the result images generated for the four methods with the corresponding ground truth image including adaptive mean thresholding, adaptive Gaussian thresholding methods, and Otsu method. For instance, based on comparison of the ground truth image shown in Figure 2(b) with Figure 3(a), (b), (c) and (d), it can be qualitatively seen that, Figure 3(d) shows a better result than the remaining figures. In other words, for the qualitative view, the proposed method provided the best approximation to the ground truth image in Figure 2(b) among compared methods. (a) (b) (c) (d) Figure 3. The simulation results of detecting oil spills in the image of Figure 2(a) by (a) the adaptive mean threshoding method, (b) the adaptive Gaussian thresholding method, (c) Otsu’s method, and (d) the proposed method. The bold rectangles in images only describe the boundary of images and are not real data For a quantitative evaluation, the proposed method was compared with the three above methods in terms of root mean square error (RMSE). More particularly, the RMSEs between each method’s resultant images and the ground truth image shown in Figure 2(b) were compared together The achieved results were listed in Table 1. It is obviously seen on Table 1 that the proposed method provides the smallest RMSE compared to the remaining methods. 14 Email: jst@tnu.edu.vn TNU Journal of Science and Technology 226(06): 10 - 17 (a) (b) (c) (d) Figure 4. The simulation results of detecting oil spills in the image of Figure 2(b) by (a) adaptive mean thresholding method, (b) adaptive Gaussian thresholding method, (c) Otsu’s method (a), and (d) the proposed method. The bold rectangles in images are not real data. Table 1. RMSEs for four methods using the bi-modal image shown in Figure 2(a) Method RMSE AMT method 1949.31 AGT method 2126.25 Otsu method [10] 1168.89 Proposed method 548 Similarly, the simulations were performed on the second original image shown in Figure 2(d) in the second stage, which is the multi-modal image. The achieved results for the four methods were shown in Figure 4. Qualitatively, the Figure 4(d) is the best approximation to the Figure 2(d). In other words, the proposed method provides the qualitatively best result among four compared methods. In order to evaluate the accuracy of the proposed method, the proposed method was compared with the three above methods in terms of RMSE. The comparison results were shown in Table 2. It can be seen in the Table 2 that the RMSE of the proposed method is the smallest among four investigated methods. It means that the proposed method achieves the higher accuracy than the remaining methods. 15 Email: jst@tnu.edu.vn TNU Journal of Science and Technology 226(06): 10 - 17 Table 2. RMSEs for four methods using the multi-modal image shown in Figure 2(d) Method RMSE AMT method 1774.40 AGT method 1872.57 Otsu method [10] 2228.97 Proposed method 342.66 In the similar way, the four above investigated methods were also evaluated by using eight other SAR images with all three different histogram shapes which are uni-modal, bi-modal and multi- modal. Each image was alternately applied to these four methods to estimate their RMSE values. As a result, there were total ten RMSE values corresponding to the ten SAR images applied to each method. Averaging these ten RMSE values provides an average RMSE value for each method. The average RMSE value was used to compare accuracy of the investigated methods. The simulations showed that the RMSE values obtained by the proposed method are smaller than all those obtained by the remaining methods. More particularly, the average RMSE value of the proposed method calculated over the ten simulated SAR images is less than all those of the three remaining methods computed over the same ten images, as shown in Table 3. Table 3. Average RMSE values of four methods calculated over the ten different SAR images of oil spills Method Average RMSE AMT method 2014.79 AGT method 2057.11 Otsu method [10] 1480.98 Proposed method 559.92 In summary, the proposed method works well for the uni-modal, bi-modal and multi-modal images, and provides higher accuracy than other methods including the adaptive mean, thresholding, adaptive Gaussian thresholding, and Otsu methods. 4. Conclusion The paper developed a novel algorithm for detecting oil spills on sea, which is based statistically selecting a global threshold to separate if a pixel is a dark spot in SAR images. The results of the proposed method were compared in the qualitative and quantitative ways with the adaptive mean thresholding, and adaptive Gaussian thresholding methods and Otsu’s method for both bi-modal and non-bimodal gray level images. The results of the proposed method provide higher accuracy in comparison with the three remaining methods. In the near future, we focus on deploying this proposed algorithm in digital signal processing hardware so that it can be applied in practice for real-time applications. REFERENCES [1] S. Liu, M. Chi, Y. Zou, A. Samat, J. A. Benediktsson, and A. Plaza, "Oil spill detection via multitemporal optical remote sensing images: A change detection perspective," IEEE Geoscience and Remote Sensing Letters, vol. 14, pp. 324-328, 2017. [2] M. S. Lee, K. A. Park, H. R. Lee, J. J. Park, C. K. Kang, and M. Lee, "Detection and dispersion of oil spills from satellite optical images in a coastal bay," IEEE International Geoscience and Remote Sensing Symposium (IGARSS), Beijing, China, 2016. [3] C. S. L. Grimaldi, I. Coviello, T. Lacava, N. Pergola, and V. Tramutoli, "Near real time oil spill detection and monitoring using satellite optical data," IEEE International Geoscience and Remote Sensing Symposium, Cape Town, South Africa, 2009. [4] K. W. Bjerde, A. H. S. Solberg, and R. Solberg, "Oil spill detection in SAR imagery," IGARSS'93- IEEE International Geoscience and Remote Sensing Symposium, Tokyo, Japan, 1993. 16 Email: jst@tnu.edu.vn TNU Journal of Science and Technology 226(06): 10 - 17 [5] K. N. Topouzelis, "Oil spill detection by SAR images: dark formation detection, feature extraction and classification algorithms," Sensors, vol. 8, pp. 6642-6659, 2008. [6] A. B. Salberg, O. Rudjord, and A. H. S. Solberg, "Oil spill detection in hybrid-polarimetric SAR images," IEEE Transactions on Geoscience and Remote Sensing, vol. 52, pp. 6521-6533, 2014. [7] J. R. Sveinsson, and J. A. Benediktsson, "Speckle reduction and enhancement of SAR images using multiwavelets and adaptive thresholding," Image and Signal Processing for Remote Sensing V, International Society for Optics and Photonics, 1999, pp. 239-250. [8] B. B. Saevarsson, J. R. Sveinsson, and J. A. Benediktsson, "Speckle reduction of SAR images using adaptive curvelet domain," IGARSS 2003. 2003 IEEE International Geoscience and Remote Sensing Symposium. Proceedings (IEEE Cat. No. 03CH37477), IEEE, 2003, pp. 4083-4085. [9] V. Santhi, C. Mouli, and A. Thangavelu, "Speckle Reduction of SAR Images using Adaptive Sigmoid Thresholding and Analysis of various Filtering Techniques," International Journal of Computer Applications, vol. 46, pp. 9-16, 2012. [10] N. Otsu, "A threshold selection method from gray-level histograms," IEEE transactions on systems, man, and cybernetics,vol. 9, pp. 62-66, 1979. [11] H. F. Ng, "Automatic thresholding for defect detection," Pattern recognition letters, vol. 27, pp. 1644- 1649, 2006. [12] X. Xu, S. Xu, L. Jin, and E. Song, "Characteristic analysis of Otsu threshold and its applications," Pattern recognition letters, vol. 32, pp. 956-961, 2011. [13] D. Bradley, and G. Roth, "Adaptive thresholding using the integral image," Journal of graphics tools, vol. 12, pp. 13-21, 2007. [14] B. Whalen, "Adaptive Thresholding Using Quadratic Cost Functions," International Journal of Image Processing (IJIP), vol. 13, p. 76, 2019. [15] ESA, Prestige oil spill. [Online]. Available: https://earth.esa.int/web/guest/data-access /sample-data/- /asset_publisher/tg8V/ content/ prestige-oil-spill-galicia-spain-1623. [Accessed 15.11.2020]. 17 Email: jst@tnu.edu.vn
File đính kèm:
 mot_cach_tiep_can_moi_dua_tren_nguong_de_phat_hien_vet_dau_l.pdf

