Hydraulic flow unit classification from core data: Case study of the Z gas reservoir, Poland
Permeability and porosity are essential parameters for estimating
hydrocarbon production from reservoir rocks. They are combined in an
additional factor, the Flow Zone Index (FZI), which is the basis for defining
the hydraulic flow unit (HFU). Each HFU is a homogeneous section of a
reservoir rock with stable parameters that allow for media flow.
Hydraulic flow units are determined from the porosity and permeability
of core or well logs. The simple statistical methods are applied for HFU
classification and then improve permeability prediction. This paper also
shows how to quickly apply the global hydraulic elements (GHE) method
for HFU classification. The methodology is tested on the Miocene
formation of a deltaic facies from the Carpathian Foredeep in SouthEastern Poland.
Trang 1
Trang 2
Trang 3
Trang 4
Trang 5
Trang 6
Trang 7
Trang 8
Tóm tắt nội dung tài liệu: Hydraulic flow unit classification from core data: Case study of the Z gas reservoir, Poland
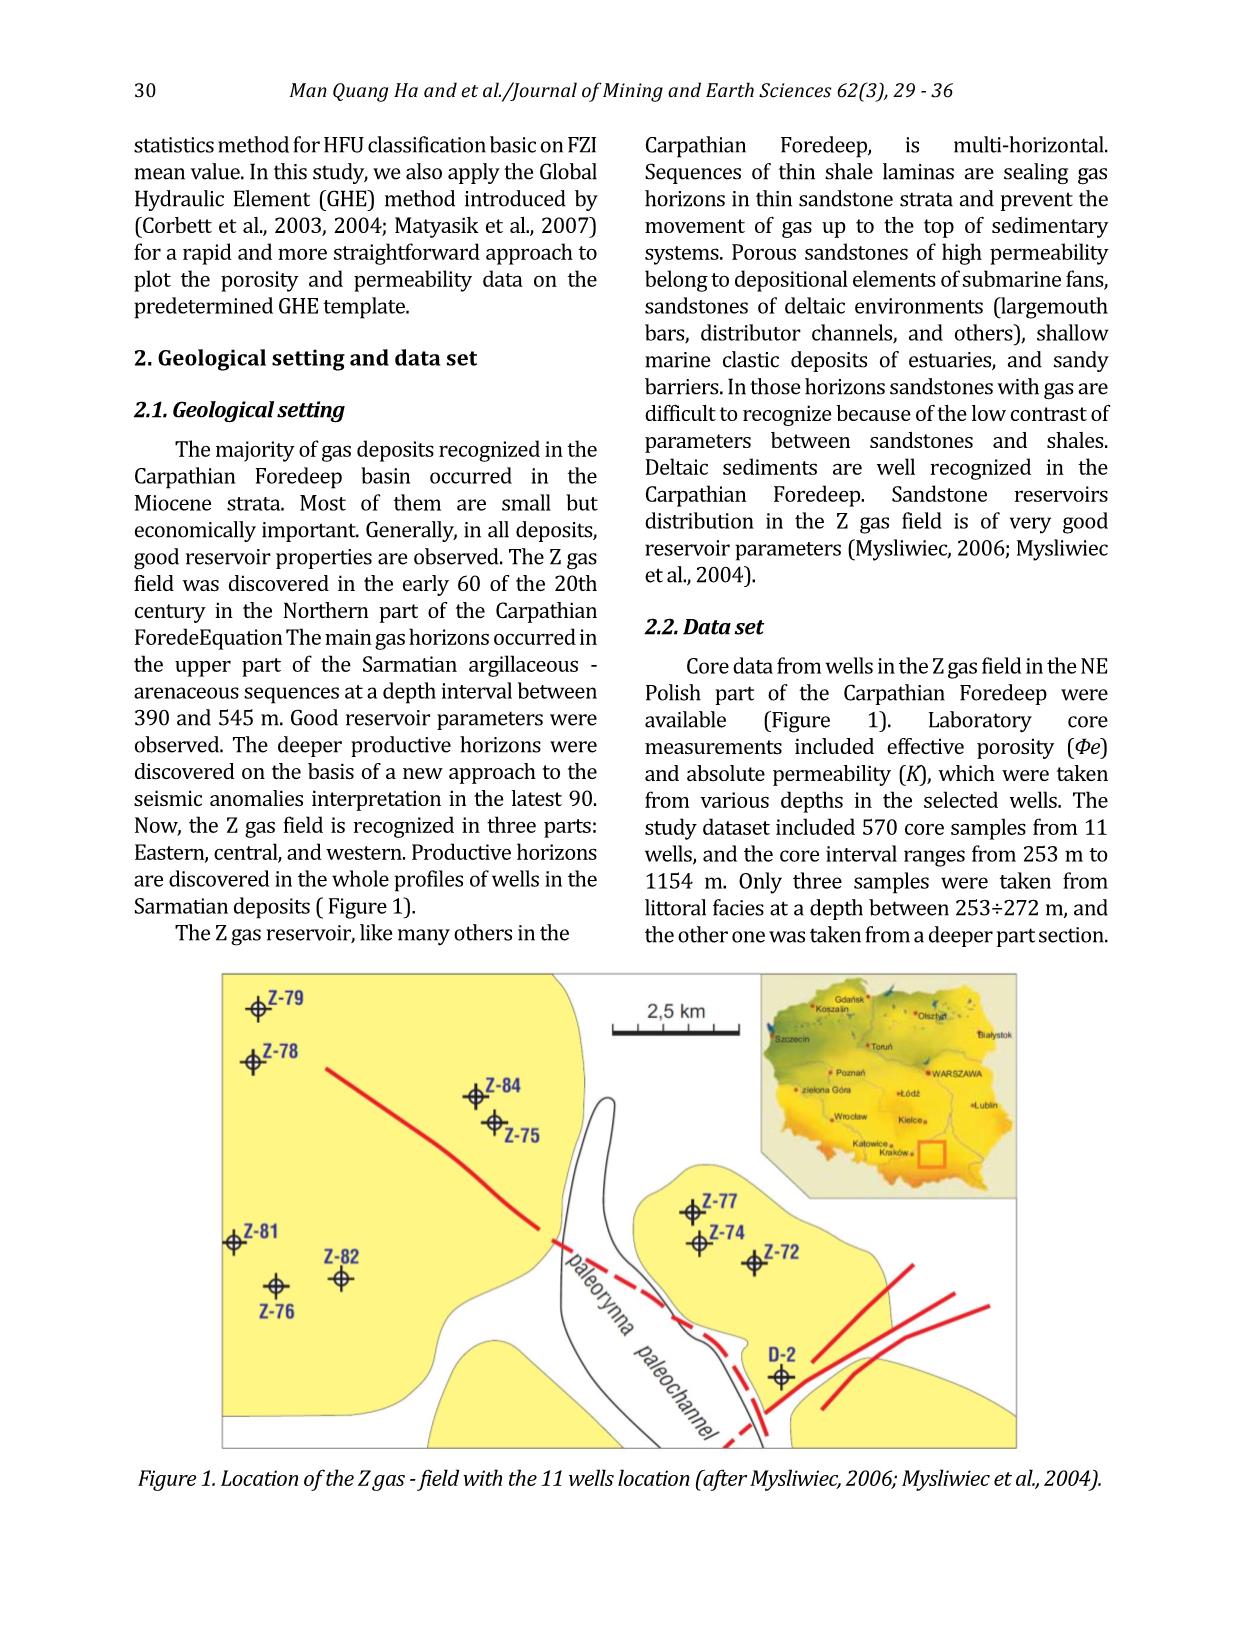
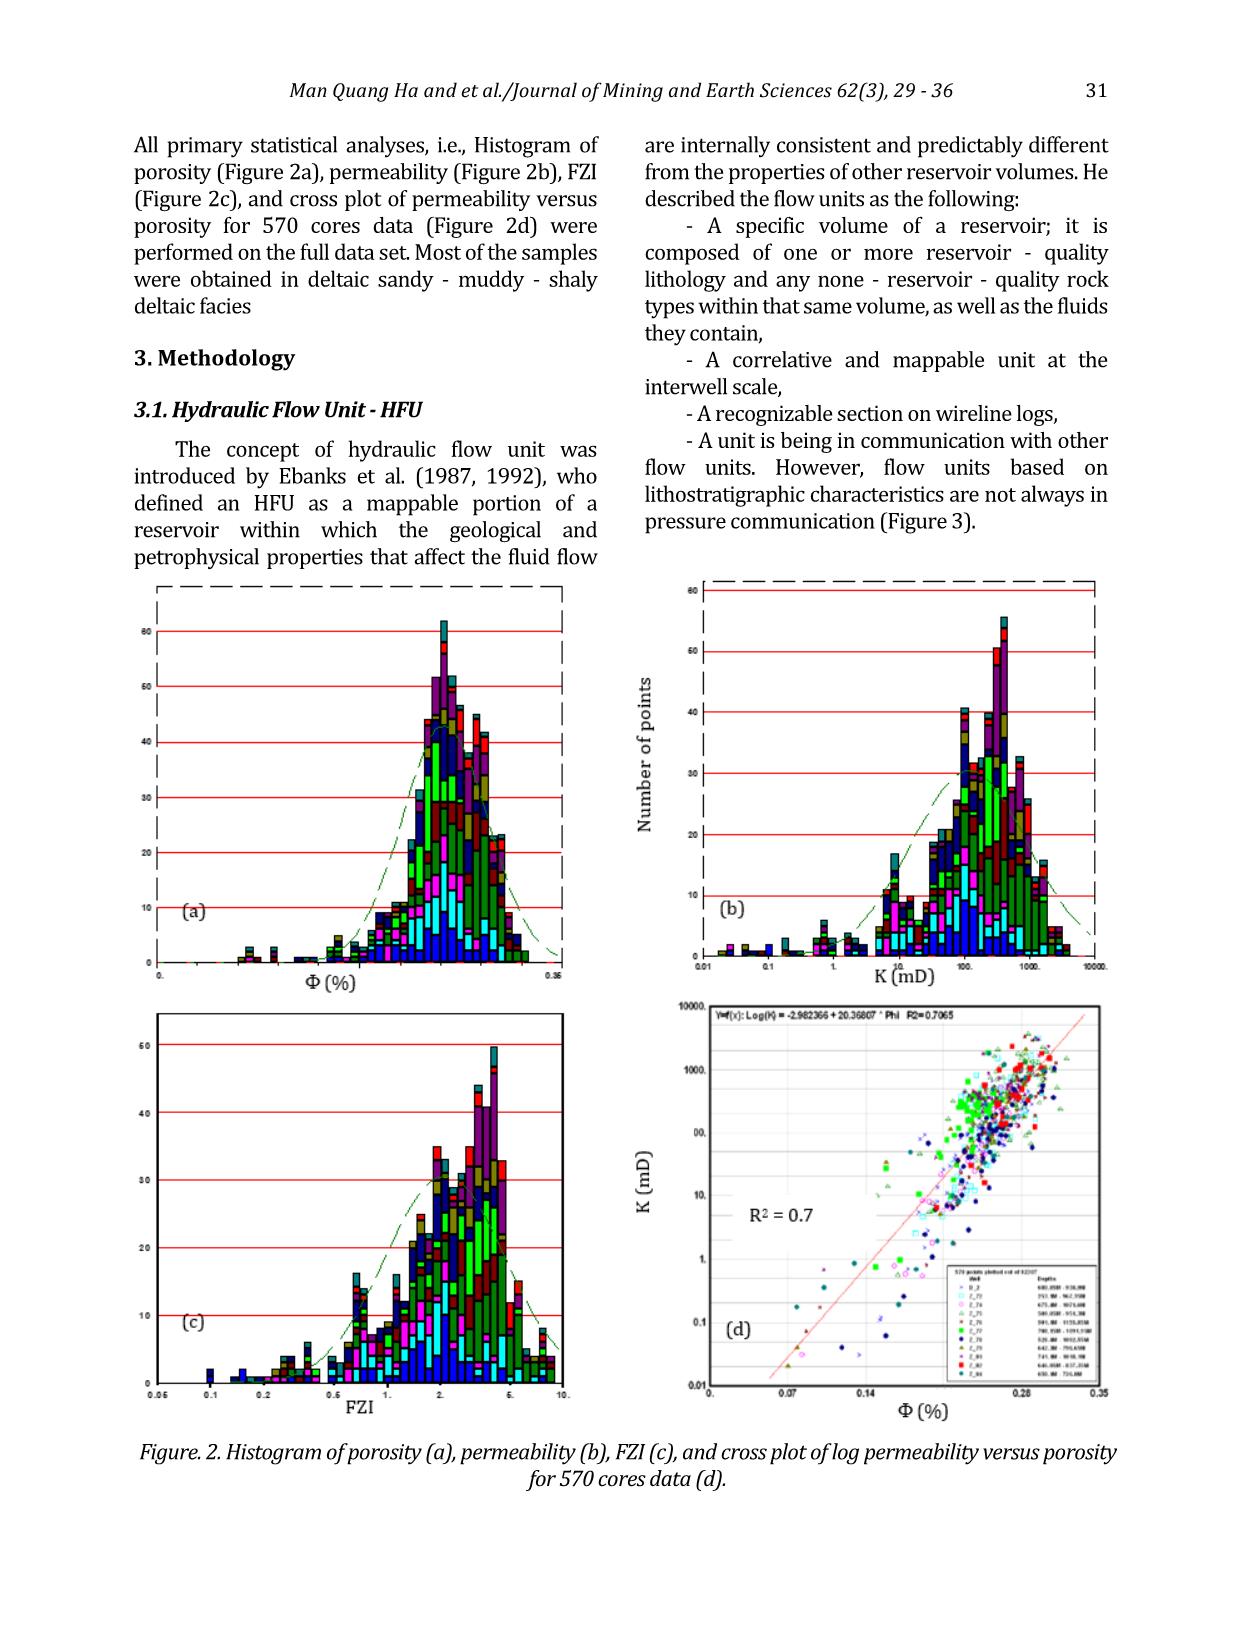
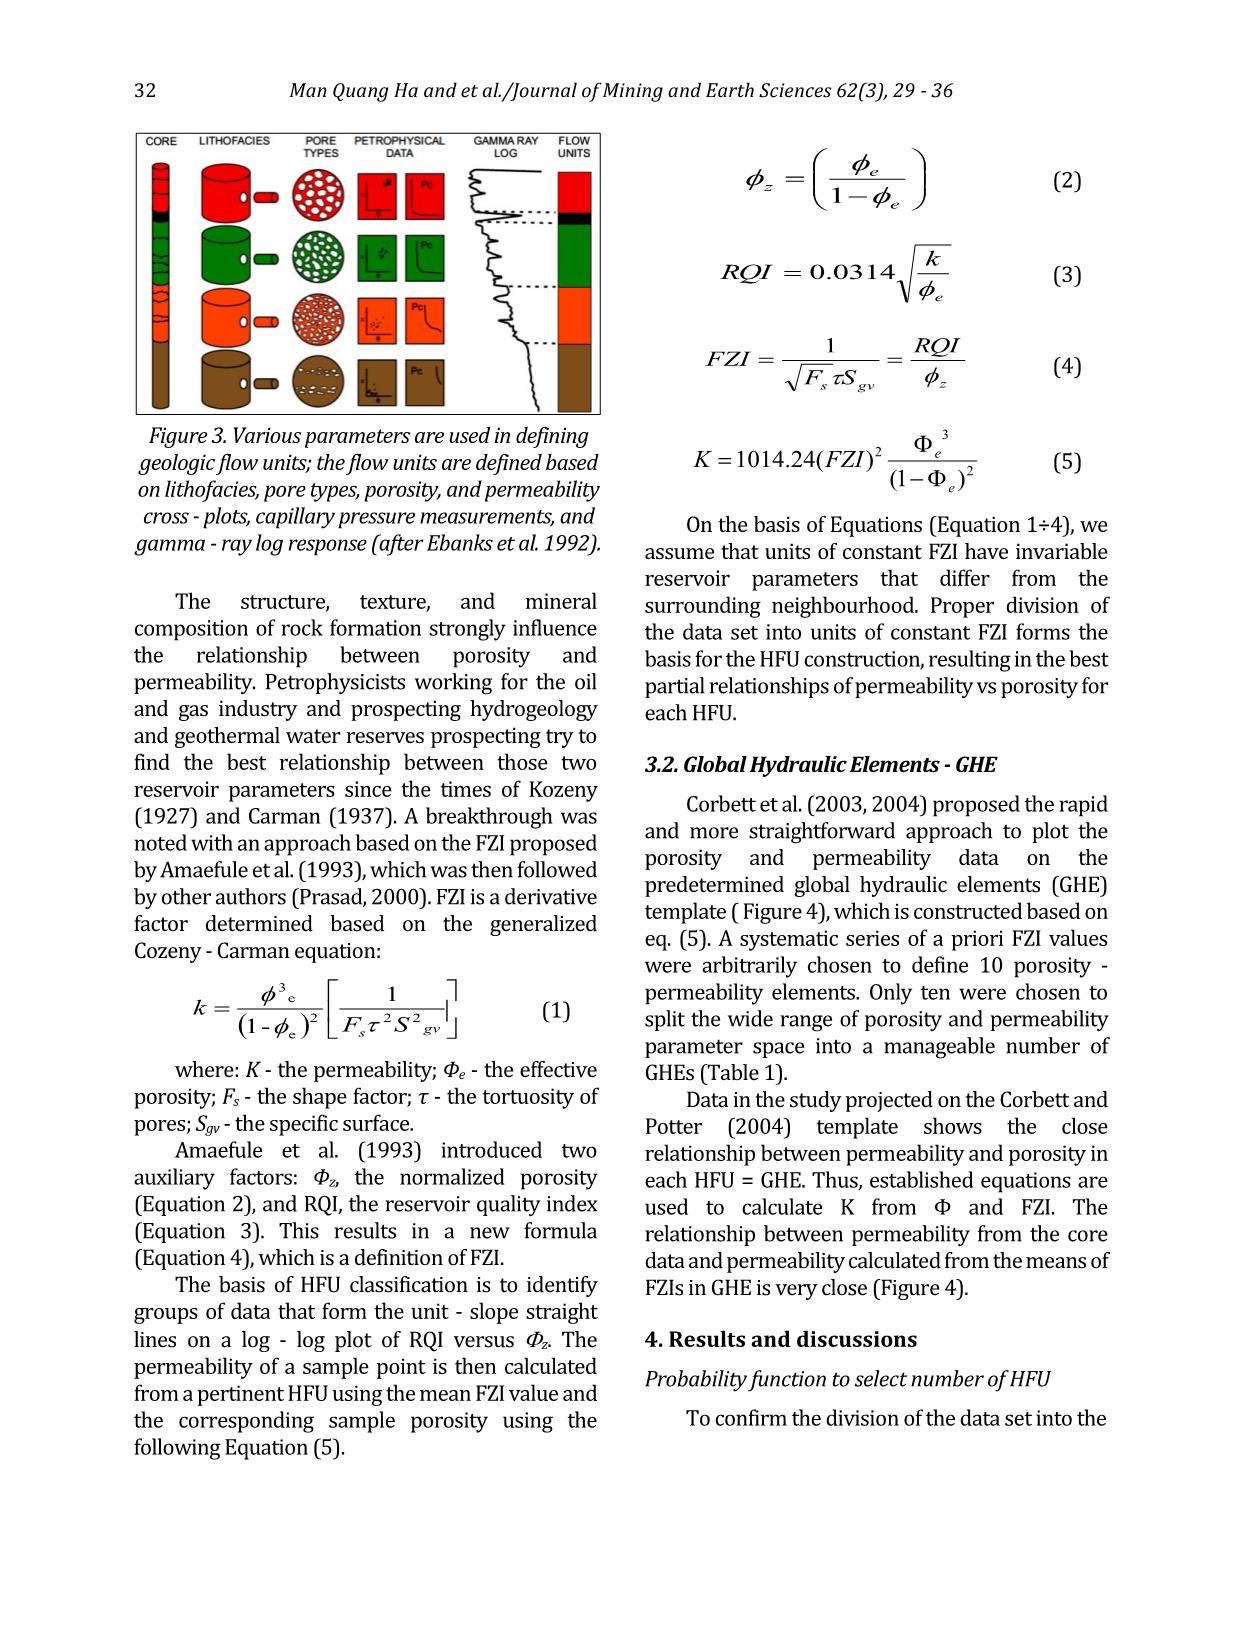
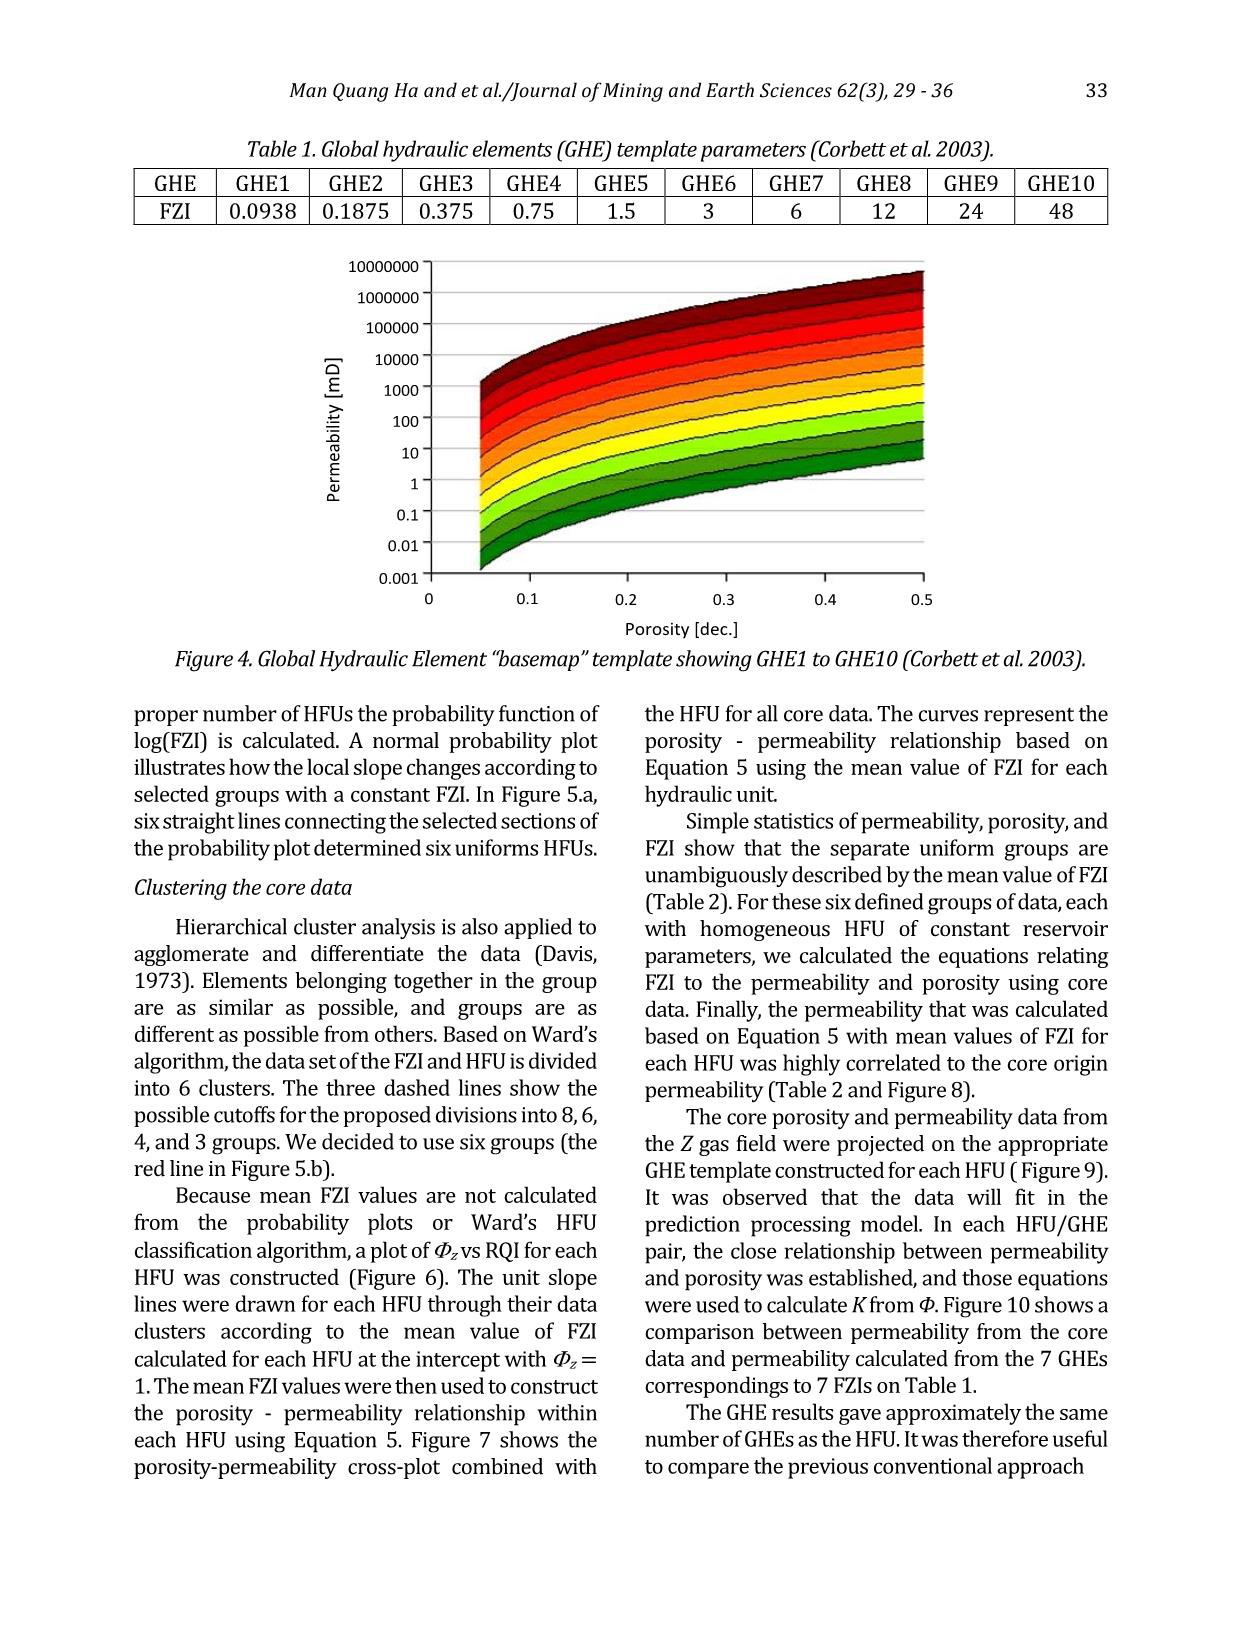
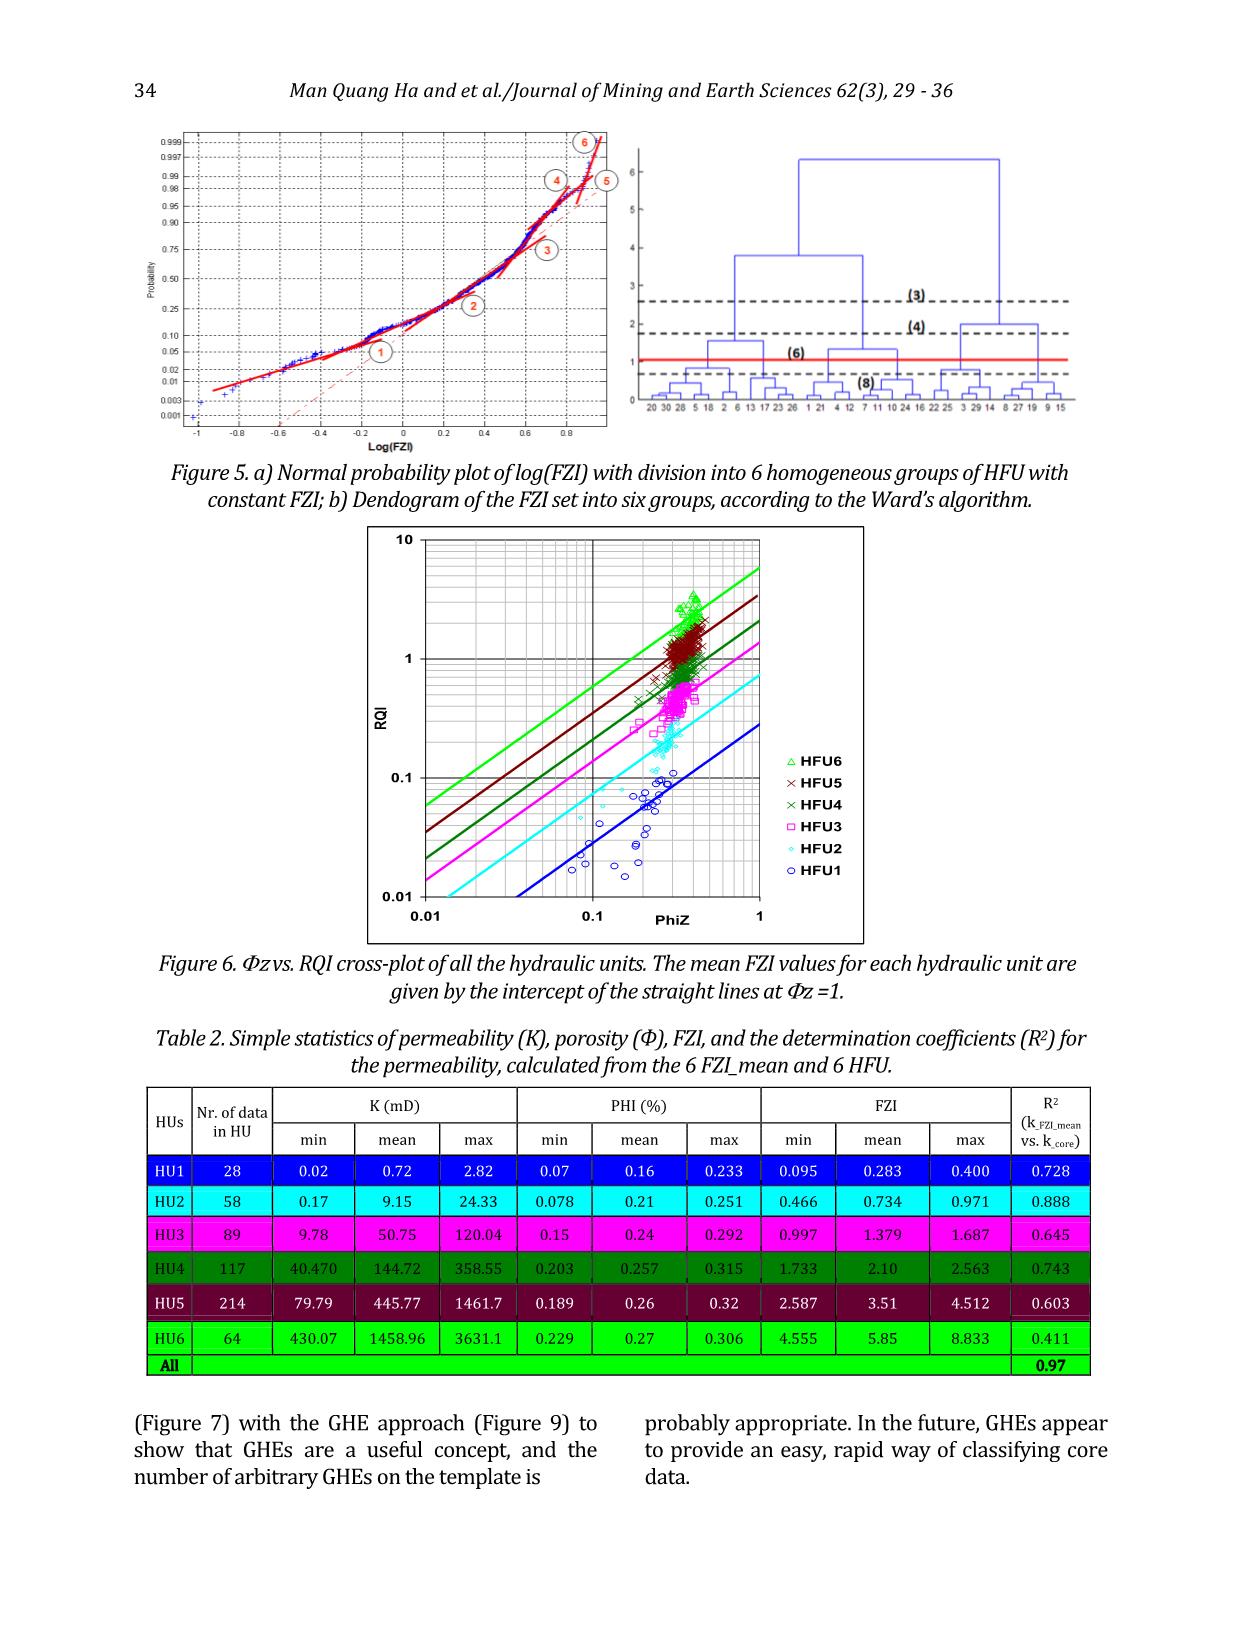
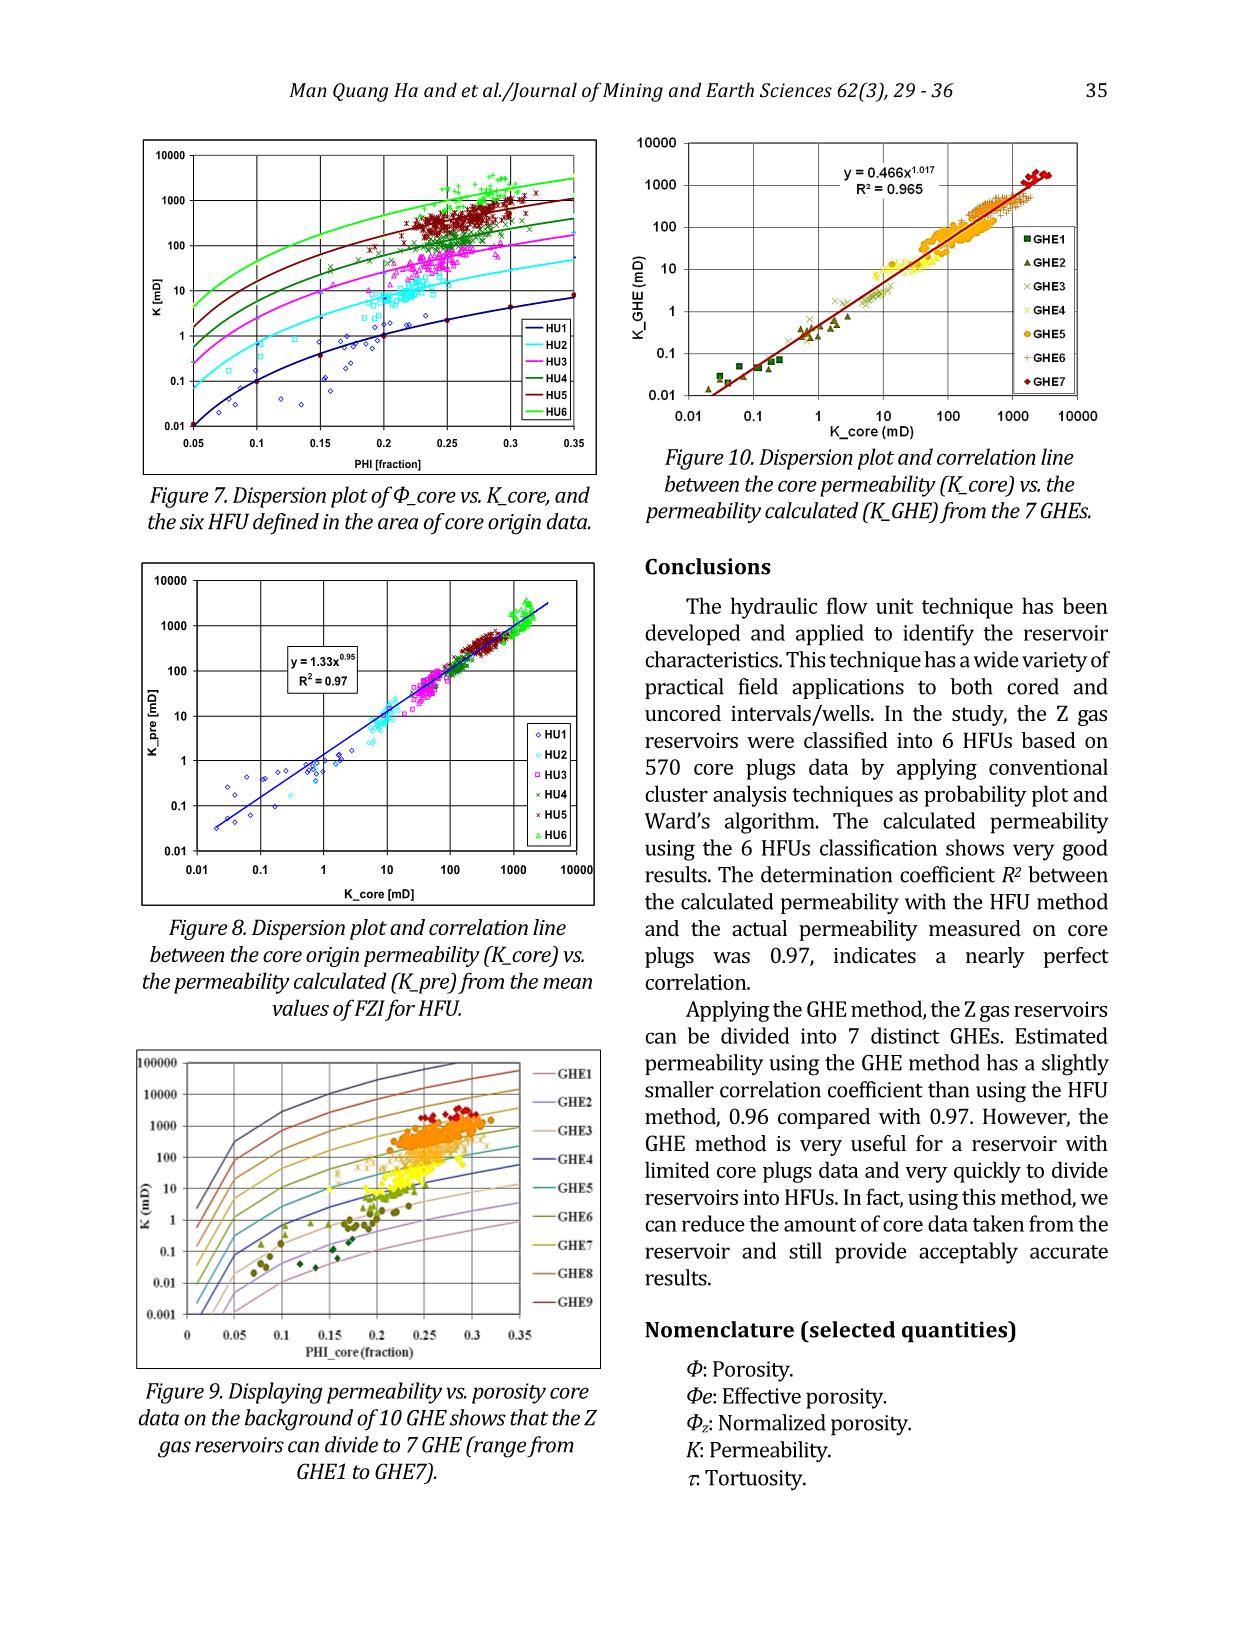
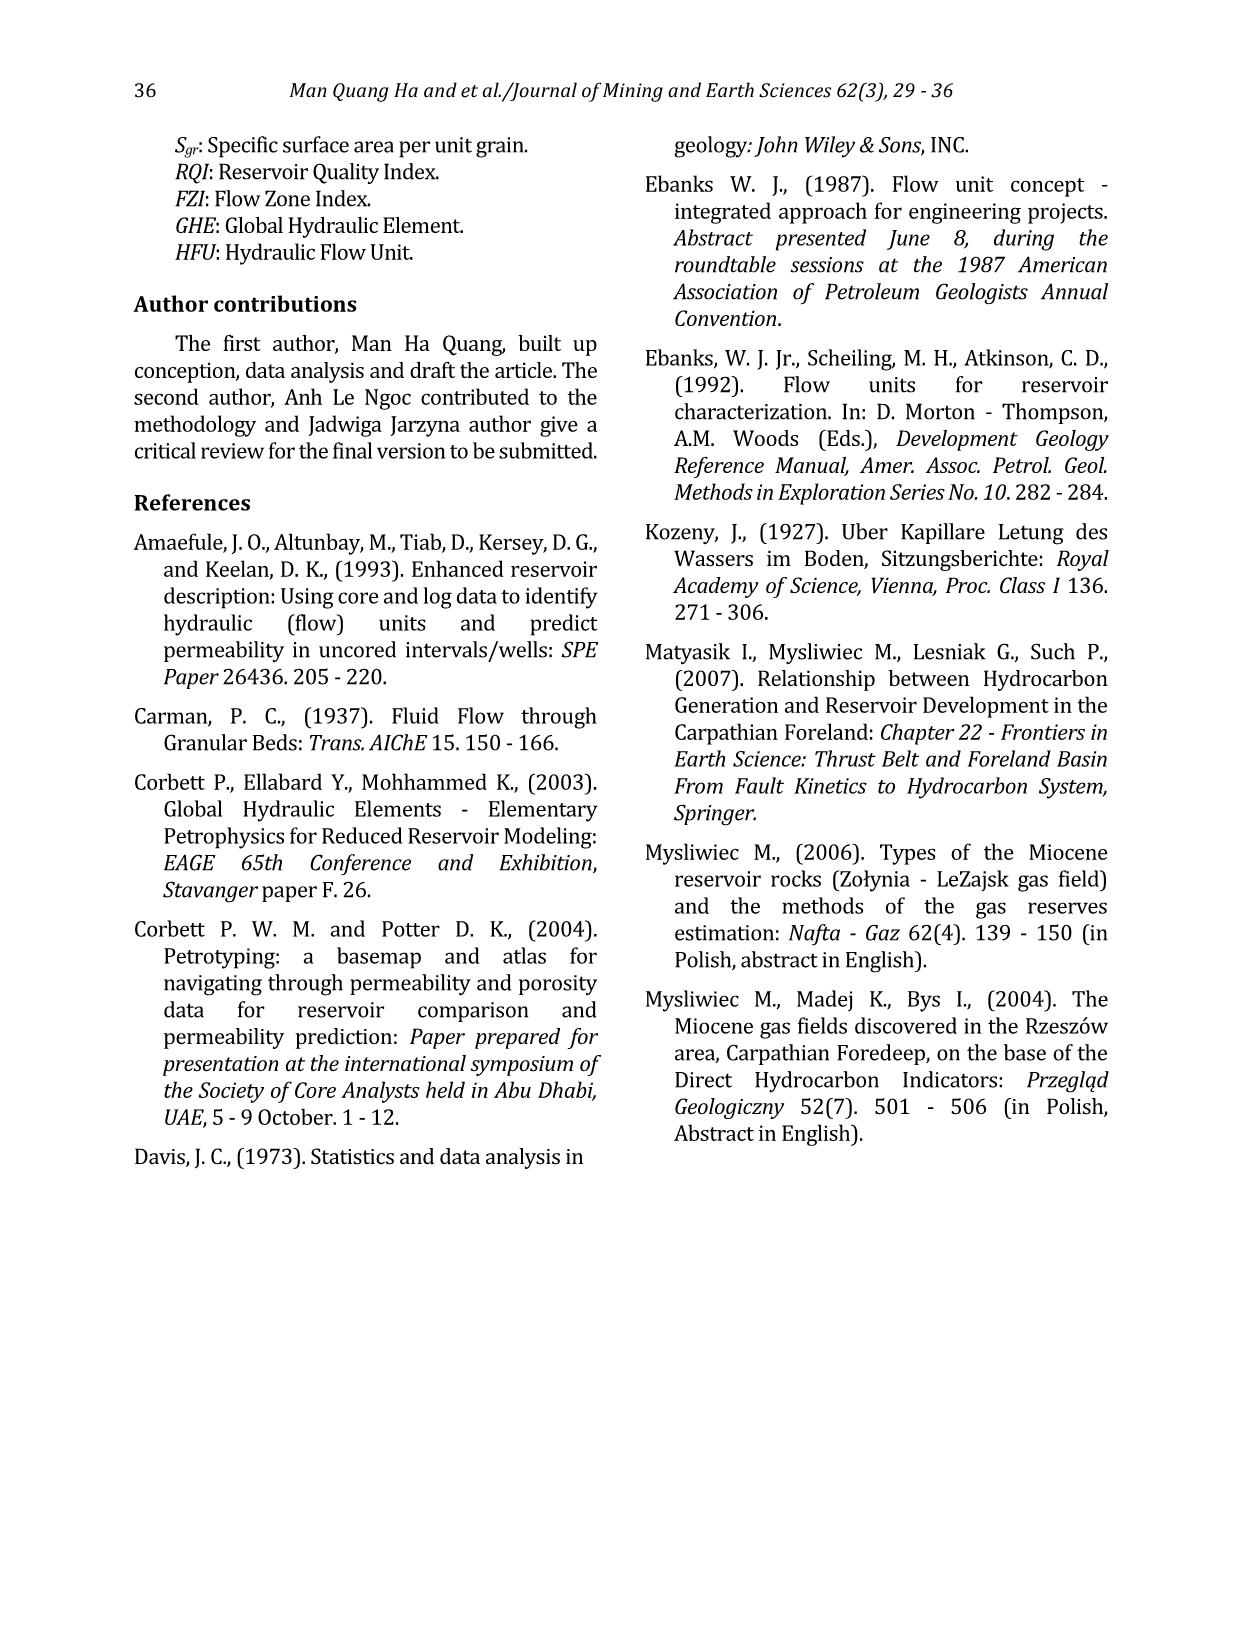
d with the 11 wells location (after Mysliwiec, 2006; Mysliwiec et al., 2004). Man Quang Ha and et al./Journal of Mining and Earth Sciences 62(3), 29 - 36 31 All primary statistical analyses, i.e., Histogram of porosity (Figure 2a), permeability (Figure 2b), FZI (Figure 2c), and cross plot of permeability versus porosity for 570 cores data (Figure 2d) were performed on the full data set. Most of the samples were obtained in deltaic sandy - muddy - shaly deltaic facies 3. Methodology 3.1. Hydraulic Flow Unit - HFU The concept of hydraulic flow unit was introduced by Ebanks et al. (1987, 1992), who defined an HFU as a mappable portion of a reservoir within which the geological and petrophysical properties that affect the fluid flow are internally consistent and predictably different from the properties of other reservoir volumes. He described the flow units as the following: - A specific volume of a reservoir; it is composed of one or more reservoir - quality lithology and any none - reservoir - quality rock types within that same volume, as well as the fluids they contain, - A correlative and mappable unit at the interwell scale, - A recognizable section on wireline logs, - A unit is being in communication with other flow units. However, flow units based on lithostratigraphic characteristics are not always in pressure communication (Figure 3). Figure. 2. Histogram of porosity (a), permeability (b), FZI (c), and cross plot of log permeability versus porosity for 570 cores data (d). 32 Man Quang Ha and et al./Journal of Mining and Earth Sciences 62(3), 29 - 36 The structure, texture, and mineral composition of rock formation strongly influence the relationship between porosity and permeability. Petrophysicists working for the oil and gas industry and prospecting hydrogeology and geothermal water reserves prospecting try to find the best relationship between those two reservoir parameters since the times of Kozeny (1927) and Carman (1937). A breakthrough was noted with an approach based on the FZI proposed by Amaefule et al. (1993), which was then followed by other authors (Prasad, 2000). FZI is a derivative factor determined based on the generalized Cozeny - Carman equation: gvs SF k 222 e e 3 1 -1 (1) where: K - the permeability; Φe - the effective porosity; Fs - the shape factor; τ - the tortuosity of pores; Sgv - the specific surface. Amaefule et al. (1993) introduced two auxiliary factors: Φz, the normalized porosity (Equation 2), and RQI, the reservoir quality index (Equation 3). This results in a new formula (Equation 4), which is a definition of FZI. The basis of HFU classification is to identify groups of data that form the unit - slope straight lines on a log - log plot of RQI versus z. The permeability of a sample point is then calculated from a pertinent HFU using the mean FZI value and the corresponding sample porosity using the following Equation (5). e e z 1 (2) e k RQI 0314.0 (3) zgvs RQI SF FZI 1 (4) 2 3 2 )1( )(24.1014 e eFZIK (5) On the basis of Equations (Equation 1÷4), we assume that units of constant FZI have invariable reservoir parameters that differ from the surrounding neighbourhood. Proper division of the data set into units of constant FZI forms the basis for the HFU construction, resulting in the best partial relationships of permeability vs porosity for each HFU. 3.2. Global Hydraulic Elements - GHE Corbett et al. (2003, 2004) proposed the rapid and more straightforward approach to plot the porosity and permeability data on the predetermined global hydraulic elements (GHE) template ( Figure 4), which is constructed based on eq. (5). A systematic series of a priori FZI values were arbitrarily chosen to define 10 porosity - permeability elements. Only ten were chosen to split the wide range of porosity and permeability parameter space into a manageable number of GHEs (Table 1). Data in the study projected on the Corbett and Potter (2004) template shows the close relationship between permeability and porosity in each HFU = GHE. Thus, established equations are used to calculate K from Φ and FZI. The relationship between permeability from the core data and permeability calculated from the means of FZIs in GHE is very close (Figure 4). 4. Results and discussions Probability function to select number of HFU To confirm the division of the data set into the Figure 3. Various parameters are used in defining geologic flow units; the flow units are defined based on lithofacies, pore types, porosity, and permeability cross - plots, capillary pressure measurements, and gamma - ray log response (after Ebanks et al. 1992). Man Quang Ha and et al./Journal of Mining and Earth Sciences 62(3), 29 - 36 33 GHE GHE1 GHE2 GHE3 GHE4 GHE5 GHE6 GHE7 GHE8 GHE9 GHE10 FZI 0.0938 0.1875 0.375 0.75 1.5 3 6 12 24 48 proper number of HFUs the probability function of log(FZI) is calculated. A normal probability plot illustrates how the local slope changes according to selected groups with a constant FZI. In Figure 5.a, six straight lines connecting the selected sections of the probability plot determined six uniforms HFUs. Clustering the core data Hierarchical cluster analysis is also applied to agglomerate and differentiate the data (Davis, 1973). Elements belonging together in the group are as similar as possible, and groups are as different as possible from others. Based on Ward’s algorithm, the data set of the FZI and HFU is divided into 6 clusters. The three dashed lines show the possible cutoffs for the proposed divisions into 8, 6, 4, and 3 groups. We decided to use six groups (the red line in Figure 5.b). Because mean FZI values are not calculated from the probability plots or Ward’s HFU classification algorithm, a plot of z vs RQI for each HFU was constructed (Figure 6). The unit slope lines were drawn for each HFU through their data clusters according to the mean value of FZI calculated for each HFU at the intercept with z = 1. The mean FZI values were then used to construct the porosity - permeability relationship within each HFU using Equation 5. Figure 7 shows the porosity-permeability cross-plot combined with the HFU for all core data. The curves represent the porosity - permeability relationship based on Equation 5 using the mean value of FZI for each hydraulic unit. Simple statistics of permeability, porosity, and FZI show that the separate uniform groups are unambiguously described by the mean value of FZI (Table 2). For these six defined groups of data, each with homogeneous HFU of constant reservoir parameters, we calculated the equations relating FZI to the permeability and porosity using core data. Finally, the permeability that was calculated based on Equation 5 with mean values of FZI for each HFU was highly correlated to the core origin permeability (Table 2 and Figure 8). The core porosity and permeability data from the Z gas field were projected on the appropriate GHE template constructed for each HFU ( Figure 9). It was observed that the data will fit in the prediction processing model. In each HFU/GHE pair, the close relationship between permeability and porosity was established, and those equations were used to calculate K from Φ. Figure 10 shows a comparison between permeability from the core data and permeability calculated from the 7 GHEs correspondings to 7 FZIs on Table 1. The GHE results gave approximately the same number of GHEs as the HFU. It was therefore useful to compare the previous conventional approach 1000000 100000 10000 1000 100 10 1 0.1 0.01 0.001 10000000 P er m ea b ili ty [ m D ] Porosity [dec.] 0 0.1 0.2 0.3 0.4 0.5 Figure 4. Global Hydraulic Element “basemap” template showing GHE1 to GHE10 (Corbett et al. 2003). Table 1. Global hydraulic elements (GHE) template parameters (Corbett et al. 2003). 34 Man Quang Ha and et al./Journal of Mining and Earth Sciences 62(3), 29 - 36 (Figure 7) with the GHE approach (Figure 9) to show that GHEs are a useful concept, and the number of arbitrary GHEs on the template is probably appropriate. In the future, GHEs appear to provide an easy, rapid way of classifying core data. Figure 5. a) Normal probability plot of log(FZI) with division into 6 homogeneous groups of HFU with constant FZI; b) Dendogram of the FZI set into six groups, according to the Ward’s algorithm. 0.01 0.1 1 10 0.01 0.1 1PhiZ R Q I HFU6 HFU5 HFU4 HFU3 HFU2 HFU1 Figure 6. z vs. RQI cross-plot of all the hydraulic units. The mean FZI values for each hydraulic unit are given by the intercept of the straight lines at z =1. HUs Nr. of data in HU K (mD) PHI (%) FZI R2 (k_FZI_mean vs. k_core) min mean max min mean max min mean max HU1 28 0.02 0.72 2.82 0.07 0.16 0.233 0.095 0.283 0.400 0.728 HU2 58 0.17 9.15 24.33 0.078 0.21 0.251 0.466 0.734 0.971 0.888 HU3 89 9.78 50.75 120.04 0.15 0.24 0.292 0.997 1.379 1.687 0.645 HU4 117 40.470 144.72 358.55 0.203 0.257 0.315 1.733 2.10 2.563 0.743 HU5 214 79.79 445.77 1461.7 0.189 0.26 0.32 2.587 3.51 4.512 0.603 HU6 64 430.07 1458.96 3631.1 0.229 0.27 0.306 4.555 5.85 8.833 0.411 All 0.97 Table 2. Simple statistics of permeability (K), porosity (Ф), FZI, and the determination coefficients (R2) for the permeability, calculated from the 6 FZI_mean and 6 HFU. Man Quang Ha and et al./Journal of Mining and Earth Sciences 62(3), 29 - 36 35 Conclusions The hydraulic flow unit technique has been developed and applied to identify the reservoir characteristics. This technique has a wide variety of practical field applications to both cored and uncored intervals/wells. In the study, the Z gas reservoirs were classified into 6 HFUs based on 570 core plugs data by applying conventional cluster analysis techniques as probability plot and Ward’s algorithm. The calculated permeability using the 6 HFUs classification shows very good results. The determination coefficient R2 between the calculated permeability with the HFU method and the actual permeability measured on core plugs was 0.97, indicates a nearly perfect correlation. Applying the GHE method, the Z gas reservoirs can be divided into 7 distinct GHEs. Estimated permeability using the GHE method has a slightly smaller correlation coefficient than using the HFU method, 0.96 compared with 0.97. However, the GHE method is very useful for a reservoir with limited core plugs data and very quickly to divide reservoirs into HFUs. In fact, using this method, we can reduce the amount of core data taken from the reservoir and still provide acceptably accurate results. Nomenclature (selected quantities) Ф: Porosity. Фe: Effective porosity. Фz: Normalized porosity. K: Permeability. : Tortuosity. 0.01 0.1 1 10 100 1000 10000 0.05 0.1 0.15 0.2 0.25 0.3 0.35 PHI [fraction] K [ m D ] HU1 HU2 HU3 HU4 HU5 HU6 y = 1.33x 0.95 R 2 = 0.97 0.01 0.1 1 10 100 1000 10000 0.01 0.1 1 10 100 1000 10000 K_core [mD] K _ p re [ m D ] HU1 HU2 HU3 HU4 HU5 HU6 Figure 7. Dispersion plot of Ф_core vs. K_core, and the six HFU defined in the area of core origin data. Figure 8. Dispersion plot and correlation line between the core origin permeability (K_core) vs. the permeability calculated (K_pre) from the mean values of FZI for HFU. Figure 9. Displaying permeability vs. porosity core data on the background of 10 GHE shows that the Z gas reservoirs can divide to 7 GHE (range from GHE1 to GHE7). Figure 10. Dispersion plot and correlation line between the core permeability (K_core) vs. the permeability calculated (K_GHE) from the 7 GHEs. 36 Man Quang Ha and et al./Journal of Mining and Earth Sciences 62(3), 29 - 36 Sgr: Specific surface area per unit grain. RQI: Reservoir Quality Index. FZI: Flow Zone Index. GHE: Global Hydraulic Element. HFU: Hydraulic Flow Unit. Author contributions The first author, Man Ha Quang, built up conception, data analysis and draft the article. The second author, Anh Le Ngoc contributed to the methodology and Jadwiga Jarzyna author give a critical review for the final version to be submitted. References Amaefule, J. O., Altunbay, M., Tiab, D., Kersey, D. G., and Keelan, D. K., (1993). Enhanced reservoir description: Using core and log data to identify hydraulic (flow) units and predict permeability in uncored intervals/wells: SPE Paper 26436. 205 - 220. Carman, P. C., (1937). Fluid Flow through Granular Beds: Trans. AIChE 15. 150 - 166. Corbett P., Ellabard Y., Mohhammed K., (2003). Global Hydraulic Elements - Elementary Petrophysics for Reduced Reservoir Modeling: EAGE 65th Conference and Exhibition, Stavanger paper F. 26. Corbett P. W. M. and Potter D. K., (2004). Petrotyping: a basemap and atlas for navigating through permeability and porosity data for reservoir comparison and permeability prediction: Paper prepared for presentation at the international symposium of the Society of Core Analysts held in Abu Dhabi, UAE, 5 - 9 October. 1 - 12. Davis, J. C., (1973). Statistics and data analysis in geology: John Wiley & Sons, INC. Ebanks W. J., (1987). Flow unit concept - integrated approach for engineering projects. Abstract presented June 8, during the roundtable sessions at the 1987 American Association of Petroleum Geologists Annual Convention. Ebanks, W. J. Jr., Scheiling, M. H., Atkinson, C. D., (1992). Flow units for reservoir characterization. In: D. Morton - Thompson, A.M. Woods (Eds.), Development Geology Reference Manual, Amer. Assoc. Petrol. Geol. Methods in Exploration Series No. 10. 282 - 284. Kozeny, J., (1927). Uber Kapillare Letung des Wassers im Boden, Sitzungsberichte: Royal Academy of Science, Vienna, Proc. Class I 136. 271 - 306. Matyasik I., Mysliwiec M., Lesniak G., Such P., (2007). Relationship between Hydrocarbon Generation and Reservoir Development in the Carpathian Foreland: Chapter 22 - Frontiers in Earth Science: Thrust Belt and Foreland Basin From Fault Kinetics to Hydrocarbon System, Springer. Mysliwiec M., (2006). Types of the Miocene reservoir rocks (Zołynia - LeZajsk gas field) and the methods of the gas reserves estimation: Nafta - Gaz 62(4). 139 - 150 (in Polish, abstract in English). Mysliwiec M., Madej K., Bys I., (2004). The Miocene gas fields discovered in the Rzeszów area, Carpathian Foredeep, on the base of the Direct Hydrocarbon Indicators: Przegląd Geologiczny 52(7). 501 - 506 (in Polish, Abstract in English).
File đính kèm:
 hydraulic_flow_unit_classification_from_core_data_case_study.pdf

