Experimental investigation of hydrodynamic phenomena in vertical-upward adiabatic two-phase Flow Conditions
In order to investigate hydrodynamic phenomena in two-phase flow conditions in nuclear
safety analysis, a series of two-phase flow experiments were conducted using a single flow channel in
which air and water were simultaneously injected into the test section. The experiments under
atmospheric pressure conditions were carried out with the water velocity and the air velocity covering
the ranges from 0.2 to 1.5 m/s and 0.05 to 0.2 m/s, respectively. The technique of two-sensor
conductivity probe was used for the measurement of bubble parameters. The experimental results
presented and analyzed in this study are the local time-averaged void fraction and bubble velocities at
three axial positions L/D = 14.4, 51.2 and 71.3.
Trang 1
Trang 2
Trang 3
Trang 4
Trang 5
Trang 6
Trang 7
Trang 8
Trang 9
Trang 10
Tải về để xem bản đầy đủ
Tóm tắt nội dung tài liệu: Experimental investigation of hydrodynamic phenomena in vertical-upward adiabatic two-phase Flow Conditions
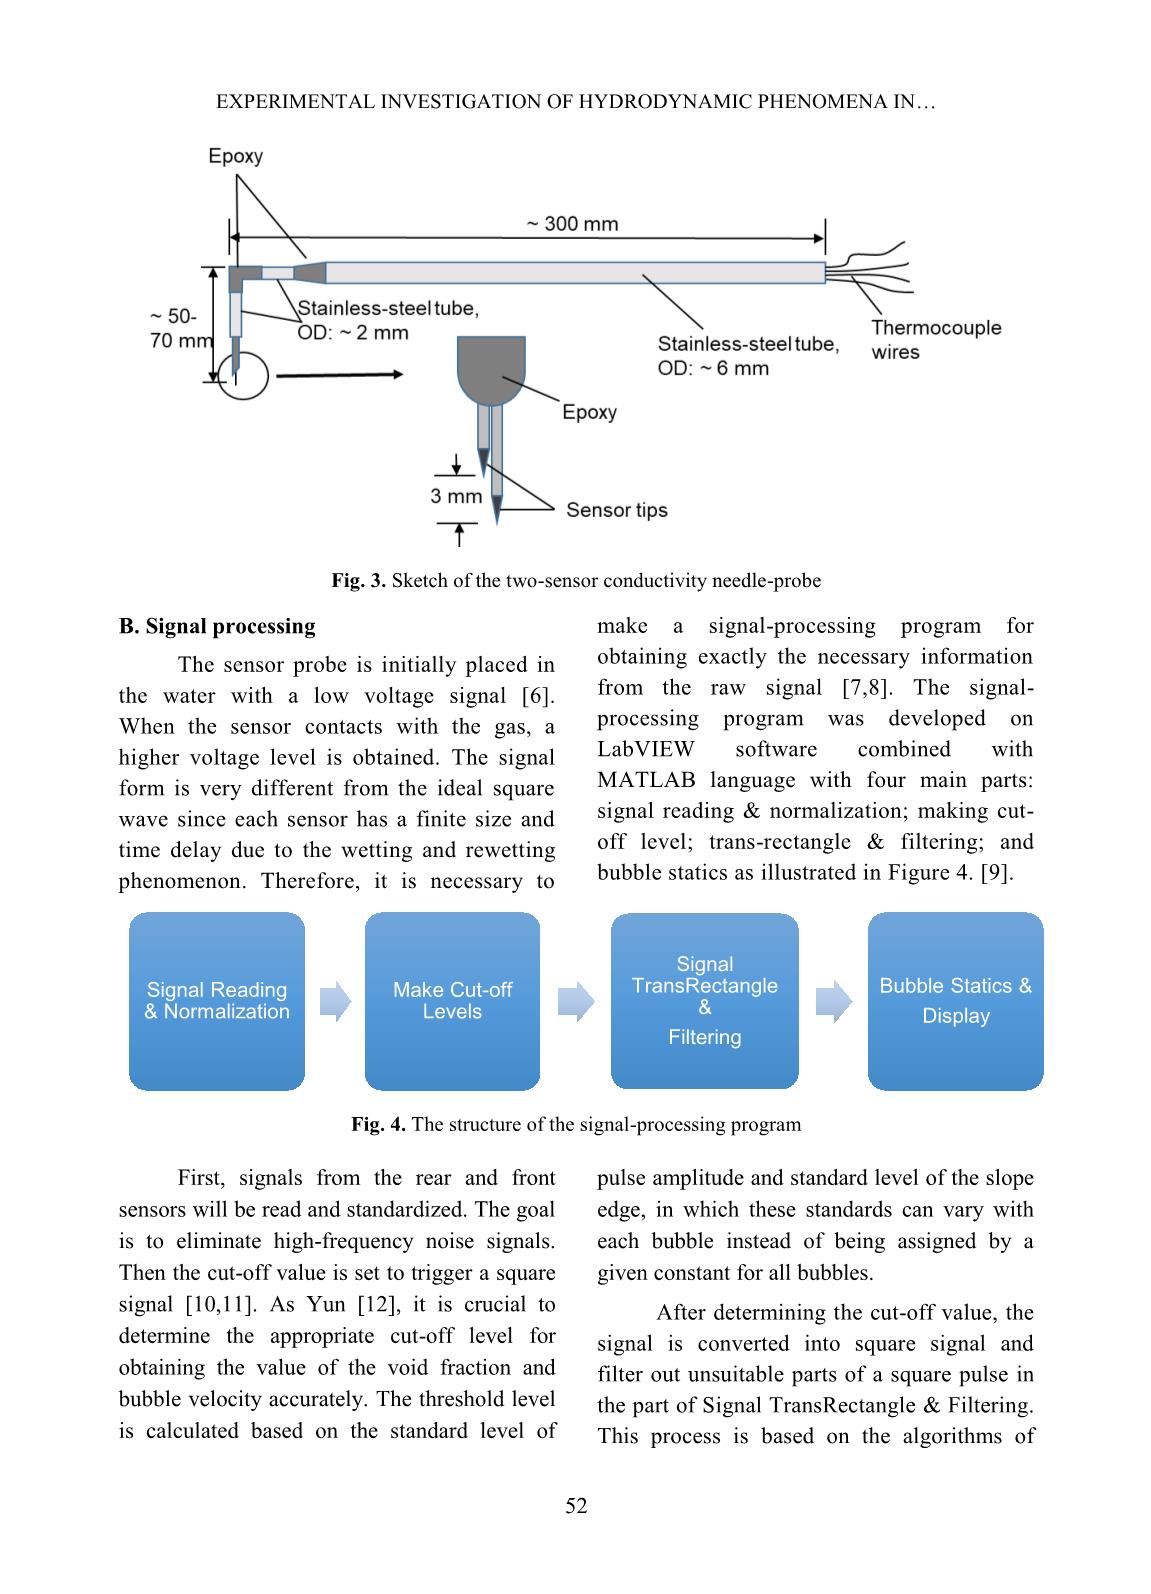
t of Signal TransRectangle & Filtering.
This process is based on the algorithms of
Signal Reading
& Normalization
Make Cut-off
Levels
Signal
TransRectangle
&
Filtering
Bubble Statics &
Display
DINH ANH TUAN et al.
53
Yun [12] and Euh [13]. Finally, the two-phase
flow parameters are calculated in the part of
Bubble Statics.
From the square wave signal, the
number of bubbles that hit the sensor can be
measured by counting the number of pulses in
the signal. The interfacial velocity of each
interface can be obtained by using the
distance to the different tips of the two-sensor
probe and the time delay between the
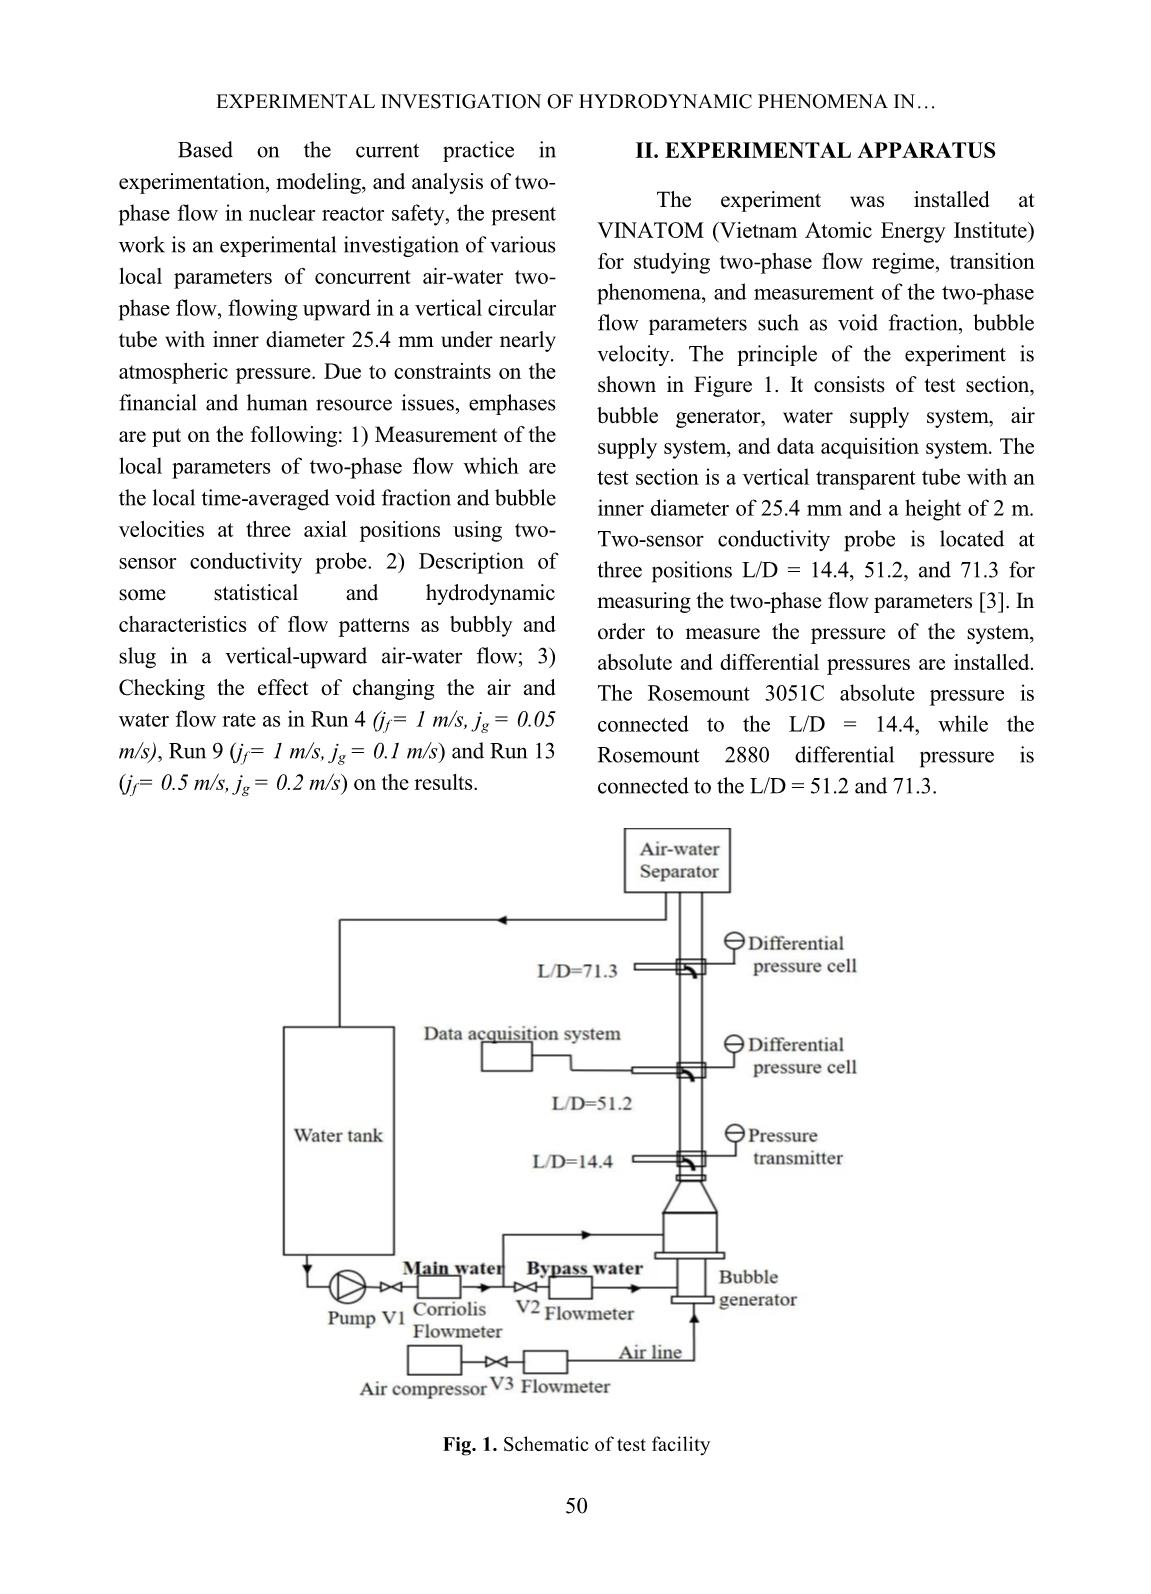
upstream and downstream signals. The
parameters of the two-phase flow have been
calculated as below [14].
- The time-averaged void fraction:
The time-averaged void fraction is a
function of the total sampling time - Ω, and the
accumulated pulse widths of the upstream
sensor during the sampling period. Thus, this
time-averaged void fraction is simply the
accumulated time the sensor is exposed to the
gas phase divided by the total sampling time of
the sensor.
 ̅
∑
Where, Nt is the number of bubbles that
strike the sensor; (tTF – tTR)j is the time that the
sensor is exposed to the gas phase.
- The time-averaged interfacial velocity:
The interfacial velocity can be computed
by taking into account the span among the tips
of the front and rear sensor and the time
difference between the front and rear signals.
Thus, the time-averaged interfacial velocity is
given as:
| ⃗ |
∑
Where Δs is the distance between the
front and rear sensor; tRR – tTR is the relative
time between the bubble striking the front and
rear sensor.
IV. PRELIMINARY RESULTS AND DISCUSSION
Experiment data was collected at 8 radial
measurement points with each point distance of
1.5 mm along three axial positions (L/D =
14.4, L/D = 51.2, L/D = 71.3). All the flow
conditions are summarized in Table I.
Table I. Experimental flow condition
Parameter Run
1-5
Run
6 -10
Run
11-13
Run
14-16
Run
17-19
Run
20-22
Run
23-25
Superficial gas
velocity, jg [m/s]
0.05 0.10 0.20 0.30 0.50 0.80 1.00
Superficial water
velocity, jf [m/s]
0.2
0.3
0.5
1.0
1.5
0.2
0.3
0.5
1.0
1.5
0.2
0.3
0.5
0.2
0.3
0.5
0.2
0.3
0.5
0.2
0.3
0.5
0.2
0.3
0.5
(1)
(2)
EXPERIMENTAL INVESTIGATION OF HYDRODYNAMIC PHENOMENA IN
54
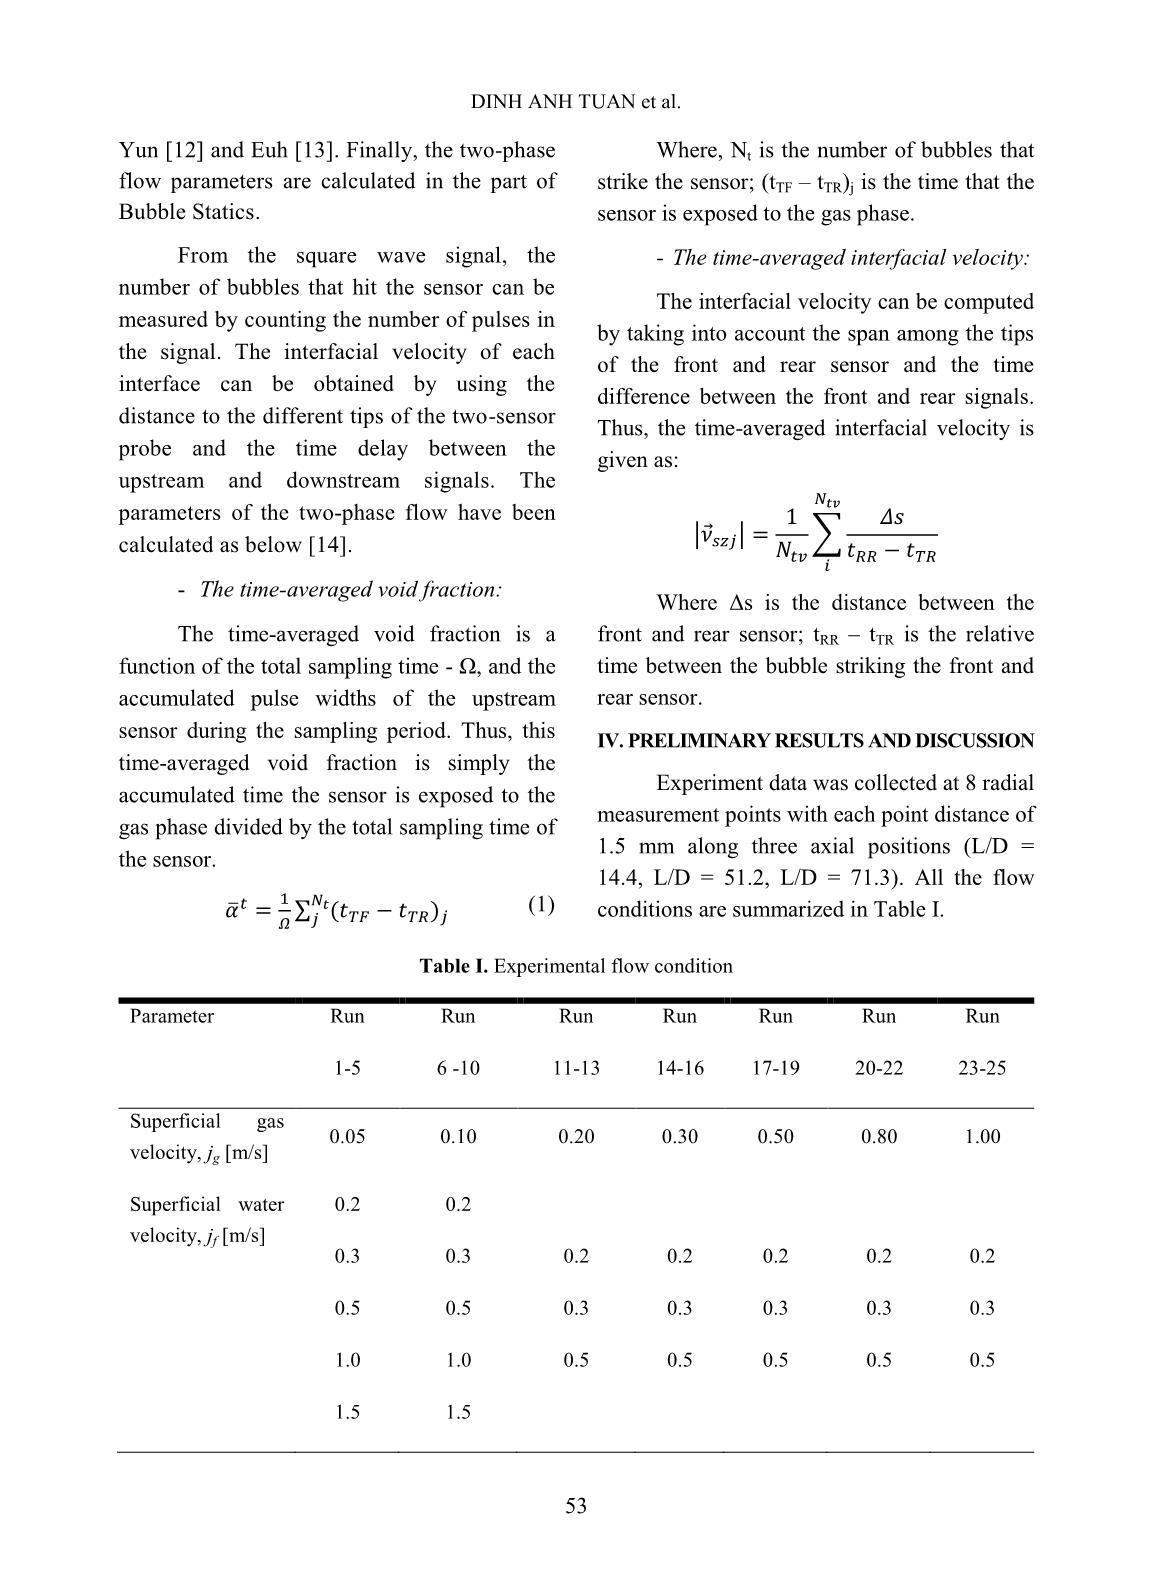
Experiments carried out are represented
in the flow regime map shown in figure 5 [15].
According to the flow map it can be seen that,
when studying measurement of two-phase flow
parameters, the authors measured with wider
ranges based on the liquid and gas superficial
velocities. However, it is still not possible to
cover the entire. Therefore, the experimental
system built at VINATOM with the
measurement range shown in Figure 5 is
expected to contribute to the missing
experimental data on the flow regime map.
Fig. 5. Test conditions on flow regime map
A. Signal processing verification
In order to ensure the quality of
conductivity probe and the signal processing,
the imaging technique is applied using the high-
speed camera with xenon lamp for observing
and recording the time of bubbles passed
through the conductivity probe [16,17]. An
independent small-scale experimental system
was built. Test Section is a shape square acrylic
box with a size of 2 × 2 cm
2
 and a length of 40
cm. A small steel tube is used to generate a
single bubble with a diameter of 2 to 5 mm. It is
possible to determine the velocity of each
bubble through the image processing software
developed by the research team of Hanoi
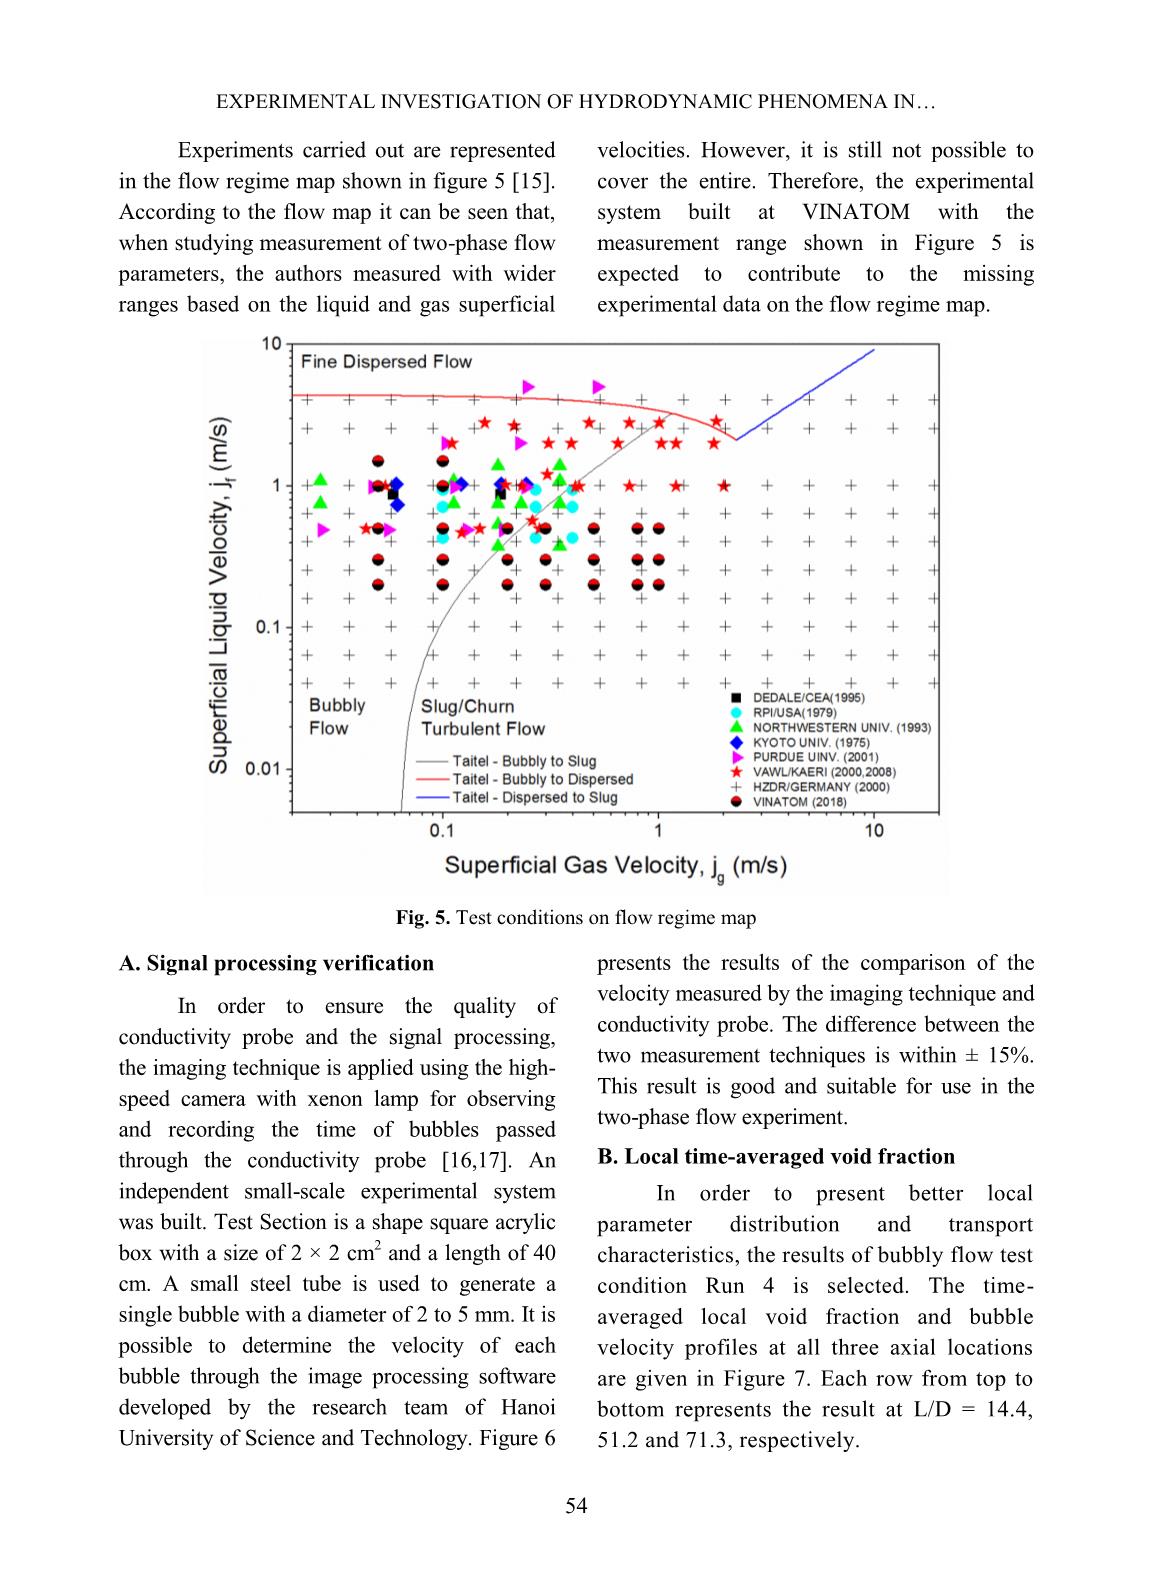
University of Science and Technology. Figure 6
presents the results of the comparison of the
velocity measured by the imaging technique and
conductivity probe. The difference between the
two measurement techniques is within ± 15%.
This result is good and suitable for use in the
two-phase flow experiment.
B. Local time-averaged void fraction
In order to present better local
parameter distribution and transport
characteristics, the results of bubbly flow test
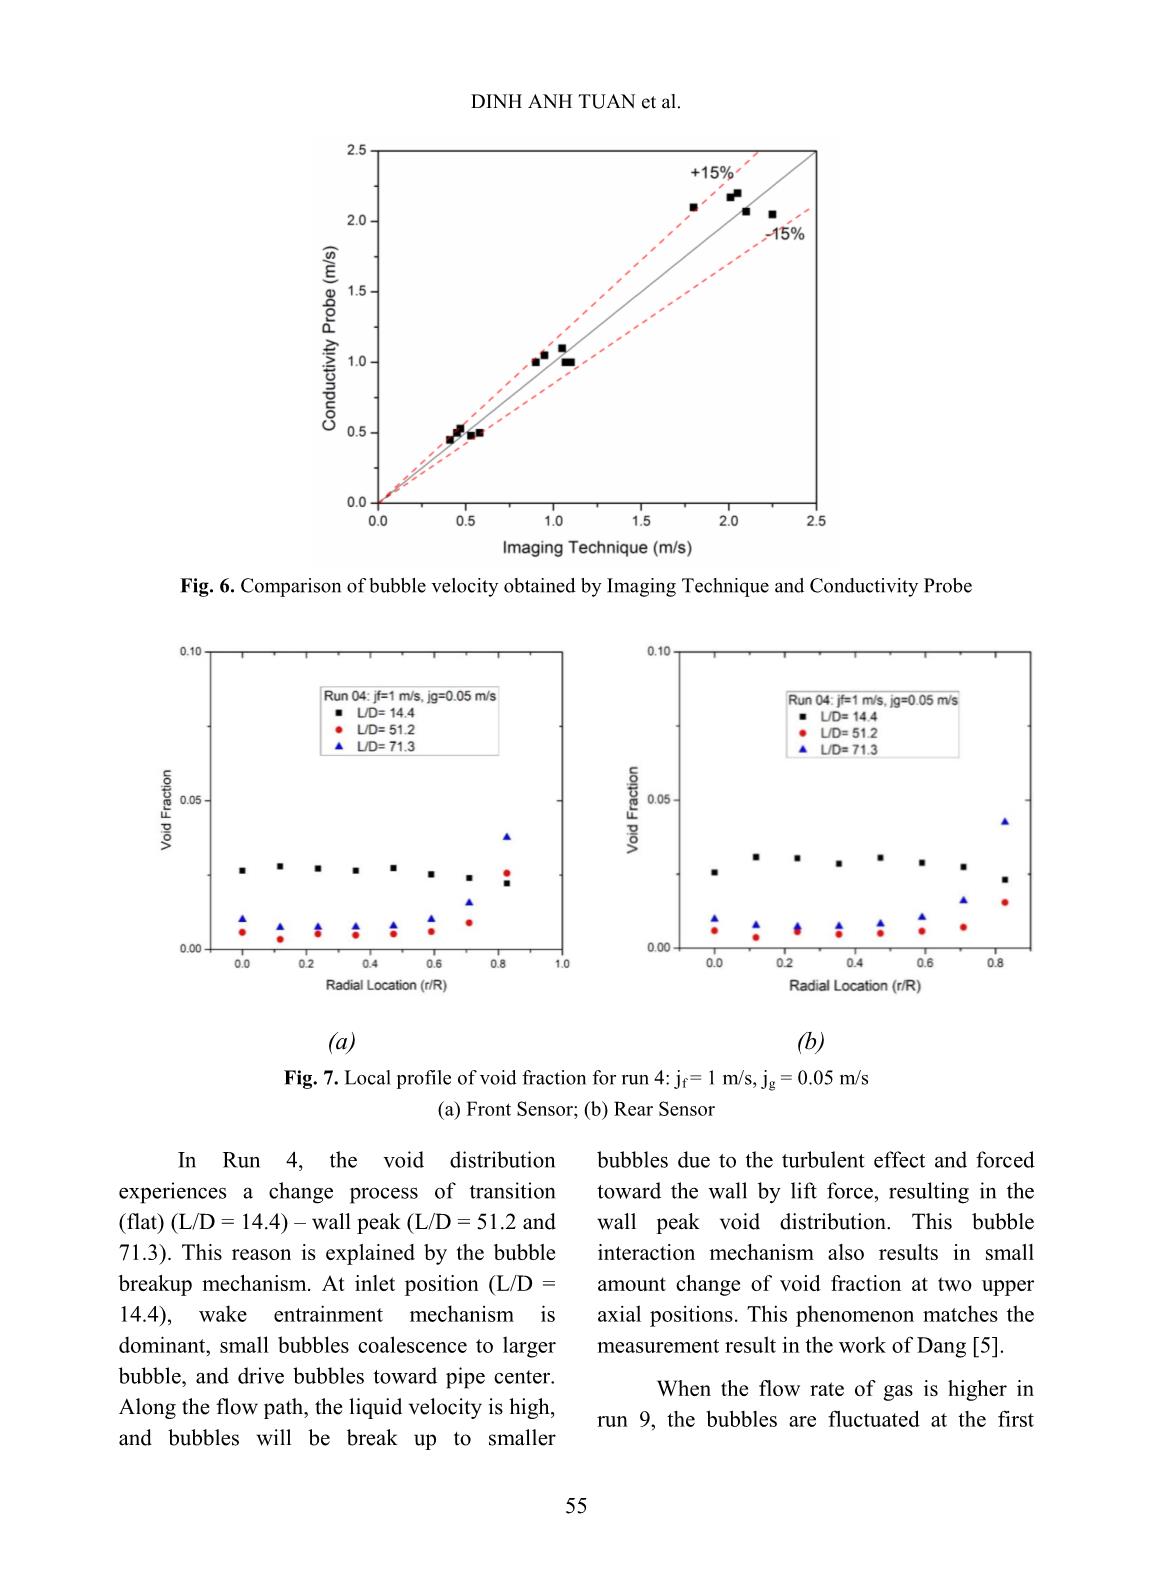
condition Run 4 is selected. The time-
averaged local void fraction and bubble
velocity profiles at all three axial locations
are given in Figure 7. Each row from top to
bottom represents the result at L/D = 14.4,
51.2 and 71.3, respectively.
DINH ANH TUAN et al.
55
Fig. 6. Comparison of bubble velocity obtained by Imaging Technique and Conductivity Probe
(a) (b)
Fig. 7. Local profile of void fraction for run 4: jf = 1 m/s, jg = 0.05 m/s
(a) Front Sensor; (b) Rear Sensor
In Run 4, the void distribution
experiences a change process of transition
(flat) (L/D = 14.4) – wall peak (L/D = 51.2 and
71.3). This reason is explained by the bubble
breakup mechanism. At inlet position (L/D =
14.4), wake entrainment mechanism is
dominant, small bubbles coalescence to larger
bubble, and drive bubbles toward pipe center.
Along the flow path, the liquid velocity is high,
and bubbles will be break up to smaller
bubbles due to the turbulent effect and forced
toward the wall by lift force, resulting in the
wall peak void distribution. This bubble
interaction mechanism also results in small
amount change of void fraction at two upper
axial positions. This phenomenon matches the
measurement result in the work of Dang [5].
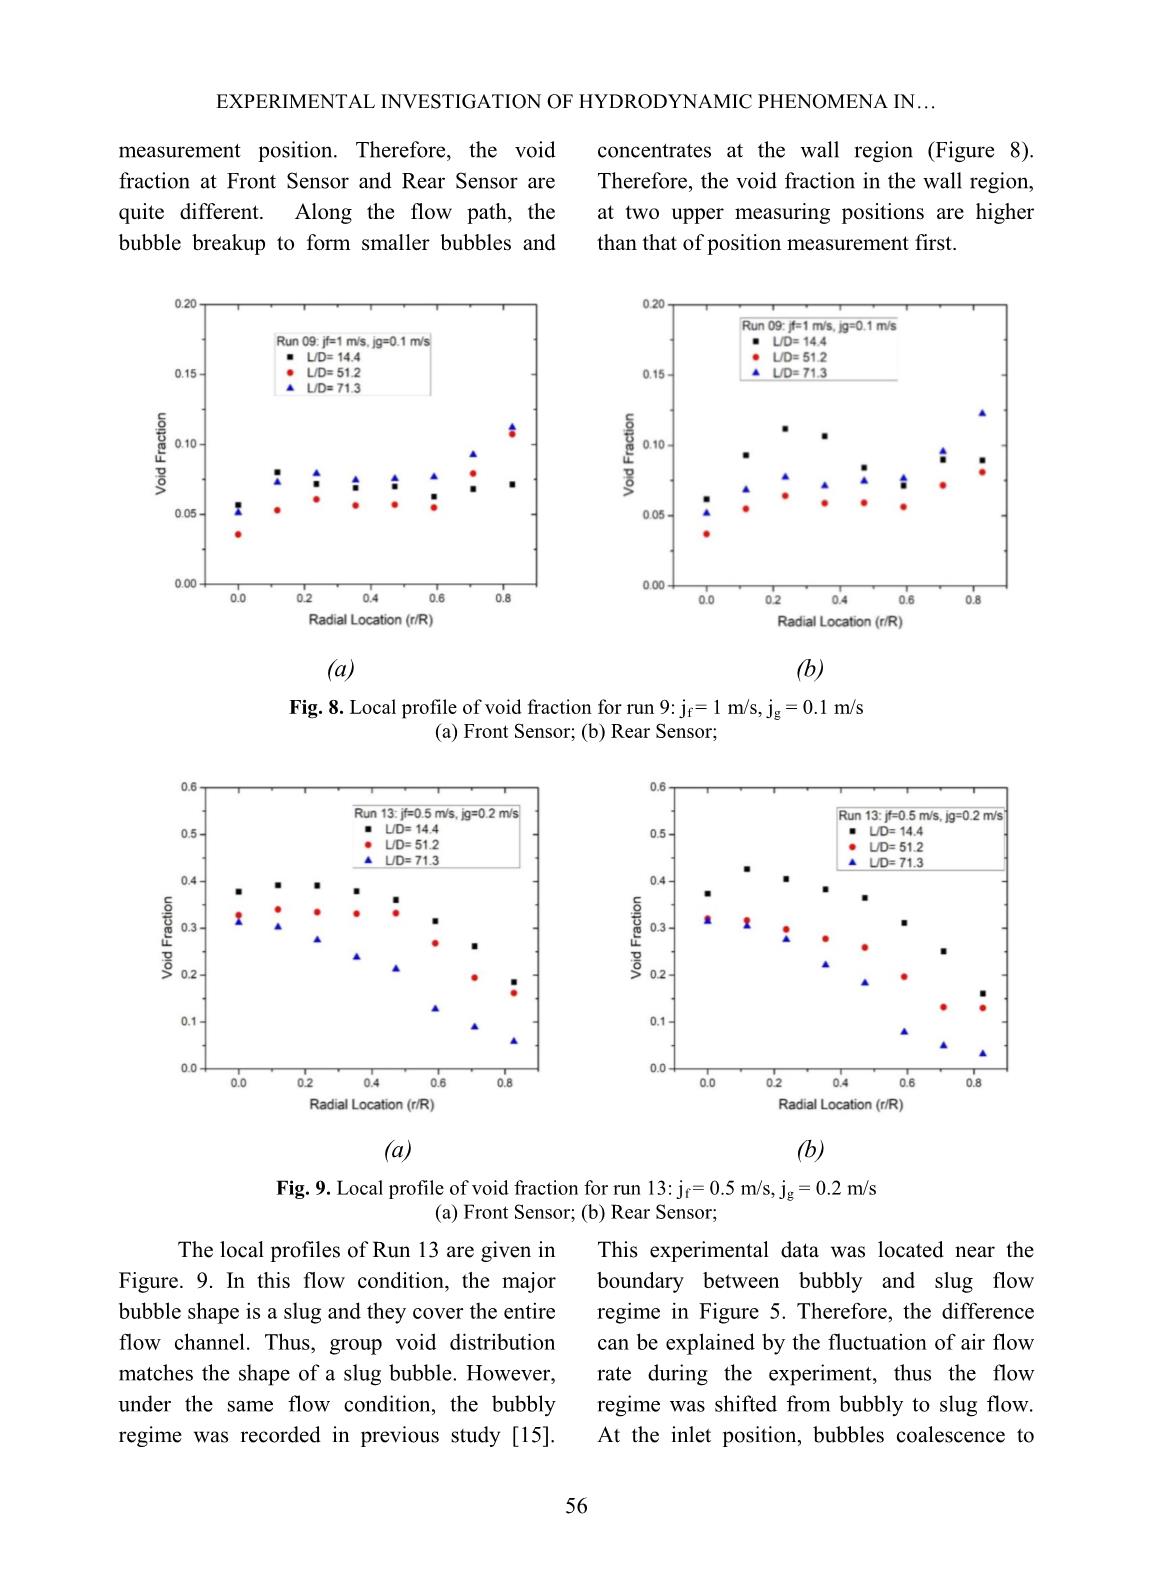
When the flow rate of gas is higher in
run 9, the bubbles are fluctuated at the first
EXPERIMENTAL INVESTIGATION OF HYDRODYNAMIC PHENOMENA IN
56
measurement position. Therefore, the void
fraction at Front Sensor and Rear Sensor are
quite different. Along the flow path, the
bubble breakup to form smaller bubbles and
concentrates at the wall region (Figure 8).
Therefore, the void fraction in the wall region,
at two upper measuring positions are higher
than that of position measurement first.
(a) (b)
Fig. 8. Local profile of void fraction for run 9: jf = 1 m/s, jg = 0.1 m/s
(a) Front Sensor; (b) Rear Sensor;
(a) (b)
Fig. 9. Local profile of void fraction for run 13: jf = 0.5 m/s, jg = 0.2 m/s
(a) Front Sensor; (b) Rear Sensor;
The local profiles of Run 13 are given in
Figure. 9. In this flow condition, the major
bubble shape is a slug and they cover the entire
flow channel. Thus, group void distribution
matches the shape of a slug bubble. However,
under the same flow condition, the bubbly
regime was recorded in previous study [15].
This experimental data was located near the
boundary between bubbly and slug flow
regime in Figure 5. Therefore, the difference
can be explained by the fluctuation of air flow
rate during the experiment, thus the flow
regime was shifted from bubbly to slug flow.
At the inlet position, bubbles coalescence to
DINH ANH TUAN et al.
57
form larger bubbles. At second measuring
position, the void distribution is affected by
slug bubbles that small bubbles follow the slug
bubbles, distributing in the slug bubbles’ wake
regions. Besides, the effect of shear off
mechanism starts to contribute to the number
of small bubbles near-wall region. According
to shear off mechanism, when slug bubbles are
large enough, they are sheared at the rim, and
many small bubbles show up.
C. Bubble Velocity
(a) (b)
(c)
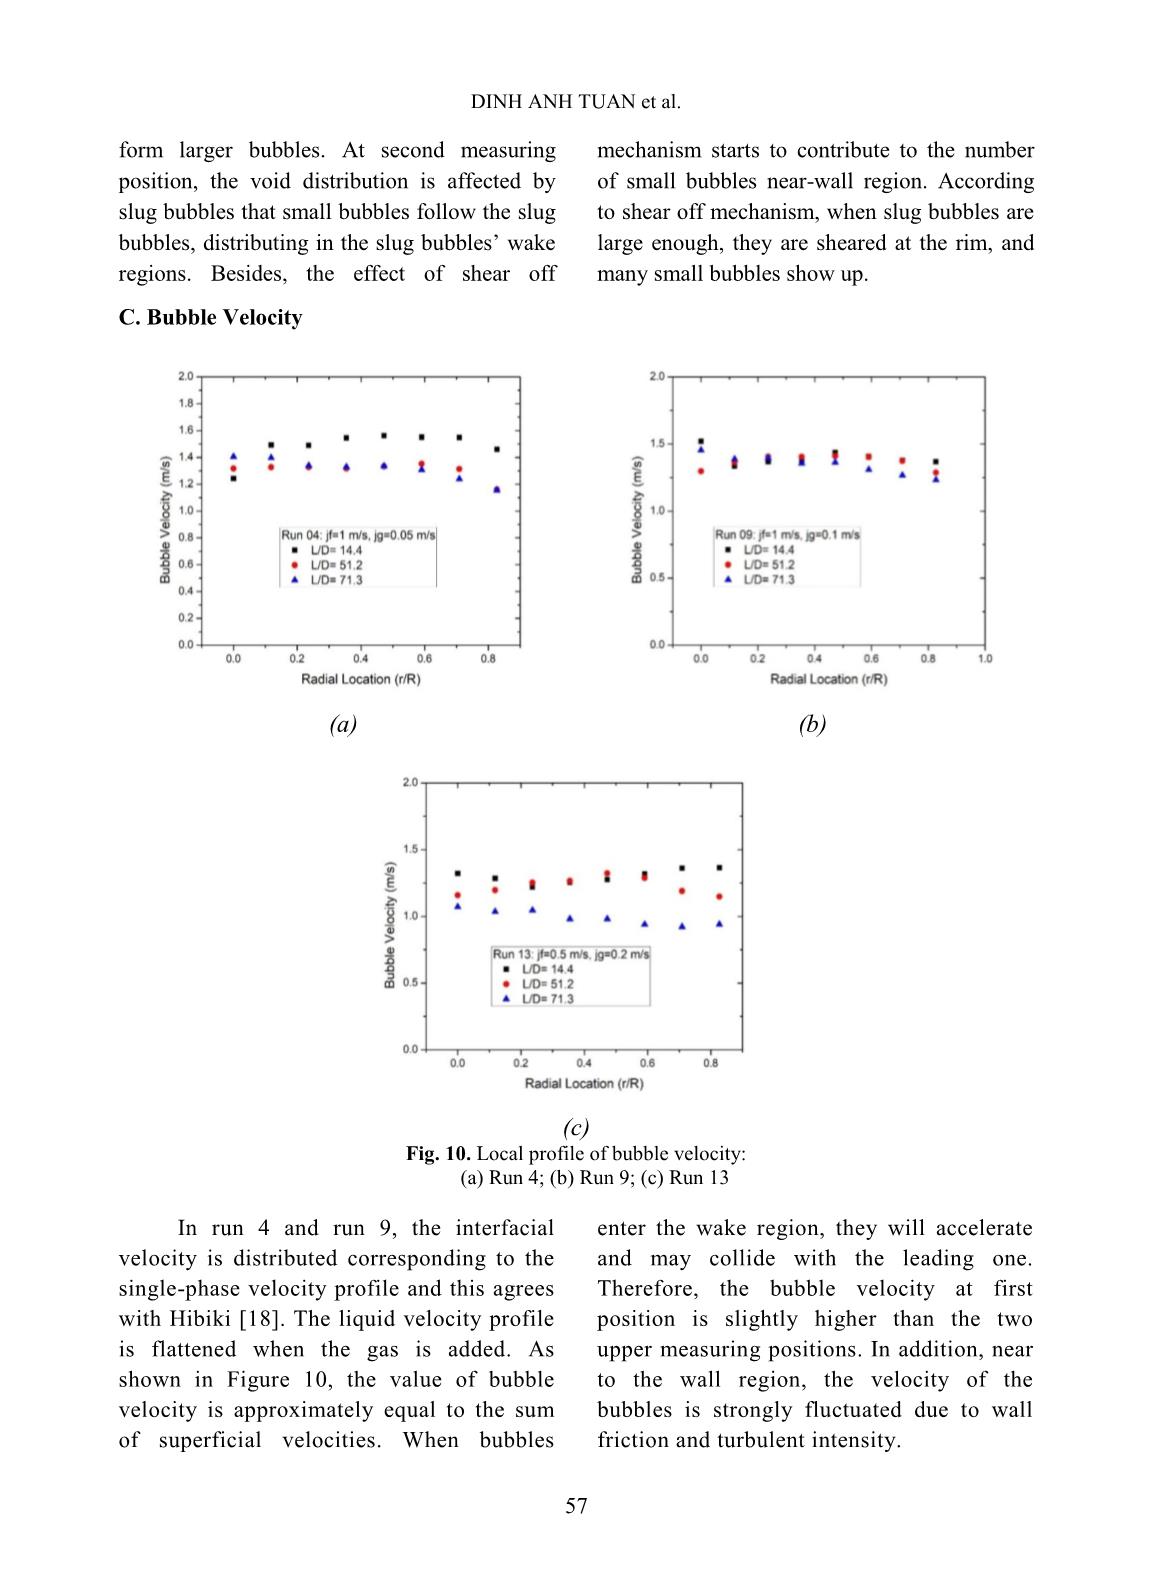
Fig. 10. Local profile of bubble velocity:
(a) Run 4; (b) Run 9; (c) Run 13
In run 4 and run 9, the interfacial
velocity is distributed corresponding to the
single-phase velocity profile and this agrees
with Hibiki [18]. The liquid velocity profile
is flattened when the gas is added. As
shown in Figure 10, the value of bubble
velocity is approximately equal to the sum
of superficial velocities. When bubbles
enter the wake region, they will accelerate
and may collide with the leading one.
Therefore, the bubble velocity at first
position is slightly higher than the two
upper measuring positions. In addition, near
to the wall region, the velocity of the
bubbles is strongly fluctuated due to wall
friction and turbulent intensity.
EXPERIMENTAL INVESTIGATION OF HYDRODYNAMIC PHENOMENA IN
58
In Run 13, the channel-averaged velocity
at the higher measuring positions are gradually
decreased and are distributed almost uniformly
in the radius. This phenomenon occurs in the
case of low water superficial velocity, and drag
force is domination. As the bubble grows, the
bubble is normally accelerated by the effect of
buoyancy force. However, due to the effect of
drag force, velocity in run 13 is suitable.
V. CONCLUSIONS
The experimental investigation on local
interfacial parameters for vertical upward air-
water two-phase flow was performed in this
study. Two-sensor conductivity probe was used
for the measurement of 25 flow conditions that
covers from bubbly flow to slug flow. The
local parameters included are a time-averaged
void fraction and bubble interfacial velocity.
The data acquisition frequency of 10 kHz and
the sampling time of 60 s were applied.
From the local experimental results, the
profiles of void fraction and interfacial velocity
along the axial and radial of the flow channel
were discussed in detail. The bubble
interaction mechanisms caused the differences
in local parameter distribution. For high liquid
superficial velocity (jf), the effect of buoyancy
force is dominant, and bubble break up
phenomena is observed. On the contrary, for
low liquid superficial velocity (jf), the effect of
drag force is dominant and bubble interaction
mechanism will change from bubble break up
to bubble coalescence.
When changing the flow conditions, the
void fraction distribution changes from wall
peaking at Run 4 and Run 9 to center peak at
Run 13. The reason might be due to the
uncertainties in the measured results that need
to be carefully considered and reduced in
future works. In conclusion, the test facility,
the experimental methods, and the preliminary
experimental results obtained in this study can
be helpful to study and comprehend the
fundamental two-phase flow phenomena. For
practical application in nuclear reactor safety,
they are envisaged to be further improved and
applied to verification and validation of
calculation methods and codes, e.g., CFD
codes, in modeling of two-phase flow.
NOMENCLATURE
D – pipe diameter
g – acceleration of gravity
L – length
lchord – chord length
N – number of bubble
p – pressure
t – time
tdelay – delay time
u – velocity
V – Volume
Greek Symbols
α – void fraction
µ – viscosity
ρ – density
σ – deviation standard
Ω – total sampling time
Subscripts
b – bubble
f – liquid
g – gas
ACKNOWLEDGEMENT
This work was performed at Institute of
Nuclear Science and Technology, Vietnam
Atomic Energy Institute under the project
“Construction of Thermal-hydraulic Experiment
and Investigation of Hydrodynamic Phenomena
of Two-phase Flow”, grant code
DTCB.17/16/VKHKTHN. The authors would
like to thank Ministry of Science and
Technology for their support on this project.
REFERENCES
[1]. L.S. Tong and Y.S. Tang., Boiling Heat
Transfer And Two-Phase Flow (Series in
DINH ANH TUAN et al.
59
Chemical and Mechanical Engineering), CRC
Press (book), 1997.
[2]. L.G. Neal and S.G. Bankoff., A high resolution
resistivity probe for determination of local
void properties in gas-liquid flow. AIChEJ (9)
490-494, 1963.
[3]. M. Walter., Study on interfacial area transport in
vertical bubbly flows, Ingenieur Thesis, Korea
Atomic Energy Research Institute, Korea, 2008.
[4]. A. Manera, B. Ozar, S. Paranjape, M. Ishii, H.-
M. Prasser., Comparison between wire-mesh
sensors and conductive needle-probes for
measurements of two-phase flow parameters,
Nuclear Engineering and Design (239) 1718–
1724, 2009.
[5]. Z. Dang, G. Wang, P. Ju, X. Yang, R. Bean,
M. Ishii, S. Bajorek, M. Bernard.,
Experimental study of interfacial
characteristics of vertical upward air-water
two-phase flow in 25.4 mm ID round pipe.
International Journal of Heat and Mass
Transfer (108) 1825–1838, 2017.
[6]. K. Sekoguchi, H. Fukui, M. Tsutsui and K.
Nishikawa., Investigation into the statistical
characteristics of bubbles in two-phase flow
(2nd Report, Application and establishment of
electrical resistivity probe method), Bull.
JSME (18) 397-404, 1975.
[7]. M.S. Hoffer and W. Resnick., A modified
electro resistivity probe technique for steady-
and unsteady-state measurements in fine
dispersions – I. Hardware and practical aspects,
Chem. Engng. Sci. (30) 473-480, 1975.
[8]. J.M. Burgess and P.H. Calderbank., The
measurement of bubble parameters in two-
phase dispersions-I. The development of an
improved probe techniques, Chem. Engng Sci.
(30) 743-750, 1975.
[9]. M. Behnia, S.J., Gillespie., Void fraction
measurement by a computerized double-point
resistivity probe. Flow. Meas. Instrum. (2)
243-247, 1991.
[10]. W.H. Leung, S.T. Revankar, Y. Ishii and M.
Ishii., Axial development of interfacial area
and void concentration profiles measured by
double-sensor probe method, Int. J. Heat Mass
Transfer (38) 445-453, 1995.
[11]. X. Zhao, G. Lucas, and S. Pradhan., Signal
Processing method in using four-sensor probe
for measuring the velocity vector of air-liquid
two phase flow. Journal of the Japanese
Society of Experimental Mechanics (JSEM)
(9) 19-24, 2009.
[12]. B.J. Yun, K.H. Kim, G.C. Park, C.H. Chung,,
A study on the Measurement of Local Void
Fraction. Journal of the Korean Nuclear
Society 24(2) 168-177, 1992.
[13]. D.J. Euh, B.J. Yun, C.H. Song, T.S. Kwon,
M.K. Chung, U.C. Lee., Development of the
five-sensor conductivity probe method for the
measurement of the interfacial are
concentration, Nuclear Engineering and
Design (205) 35-51, 2001.
[14]. I. Kataoka and A. Serizawa., Averaged bubble
diameter and interfacial area in bubbly flow,
Proc. 5th Two-phase Symp. Japan, Kobe,
Japan, 28-29 November 77-80, 1984.
[15]. Y. Taitel, D. Bornea and A. E. Dukler.,
Modelling Flow Pattern Transitions for Steady
Upward Gas-Liquid Flow in Vertical Tubes,
AlChE Journal (Vol. 26, No. 3) 345–354, 1980.
[16]. M. Ishii and S. Kim., Micro four-sensor probe
measurement of interfacial area transport for
bubbly flow in round pipes. Nuclear
Engineering and Design 205 123-131, 2001.
[17]. M. McCreary., Design and Testing
Conductivity Probes for the Measurement of
Two-Phase Flow Parameters. MS Thesis,
Oregon State University, US, 2001.
[18]. T. Hibiki, M. Ishii, Z. Xiao., Axial interfacial
area transport of vertical bubbly flows,
International Journal of Heat and Mass
Transfer (44) 1869–1888, 2001.
File đính kèm:
 experimental_investigation_of_hydrodynamic_phenomena_in_vert.pdf

