Evaluation of slip ratio correlations in two-phase flow
Critical flow is one of the essential parameters in LOCA accident analysis in which
pressure difference is very high. Void fraction (α), in another term, slip ratio, s, is the key parameter
that could affect critical flow prediction. Henry-Fauske (HF) model is the model for critical flow
calculation existing in current computer codes such as MARS, RELAP, TRACE. However, the
limitation of this model is slip ratio s=1. By modified the slip ratio correlation, the paper focuses on
evaluating the HF model. Among the chosen correlations for slip ratio, Smith correlation is the best
option for this purpose. The results in our paper showed that while the original Smith correlation with
k=0.4 is suggested for horizontal tests, the modified one with k=0.2 could be applied for vertical tests.
Trang 1
Trang 2
Trang 3
Trang 4
Trang 5
Trang 6
Trang 7
Trang 8
Trang 9
Trang 10
Tóm tắt nội dung tài liệu: Evaluation of slip ratio correlations in two-phase flow
epends on the phase velocity ratio,
slip ratio in the general form [8], [9] as a
function of quality (x), density (ρ), and
viscosity (µ):
 (
 )
(
)
(
)
In reality, only several types of
reactors for gas/liquid exist. Moreover, one
could be noted that the contribution of the
viscosity component as shown in Table I,
(
)
, is less dominant. Therefore, this
parameter could be negligible in the void
fraction form. Void fraction correlations then
could be reduced as follows:
 (
)
(
)
 or
 (
 ) (
)
Where the slip ratio, s, is determined
as follows:
 (
)
(
)
Select the void fraction correlations
having the form in Eq. (7), the author has
compared them with the available experimental
data (Table I).
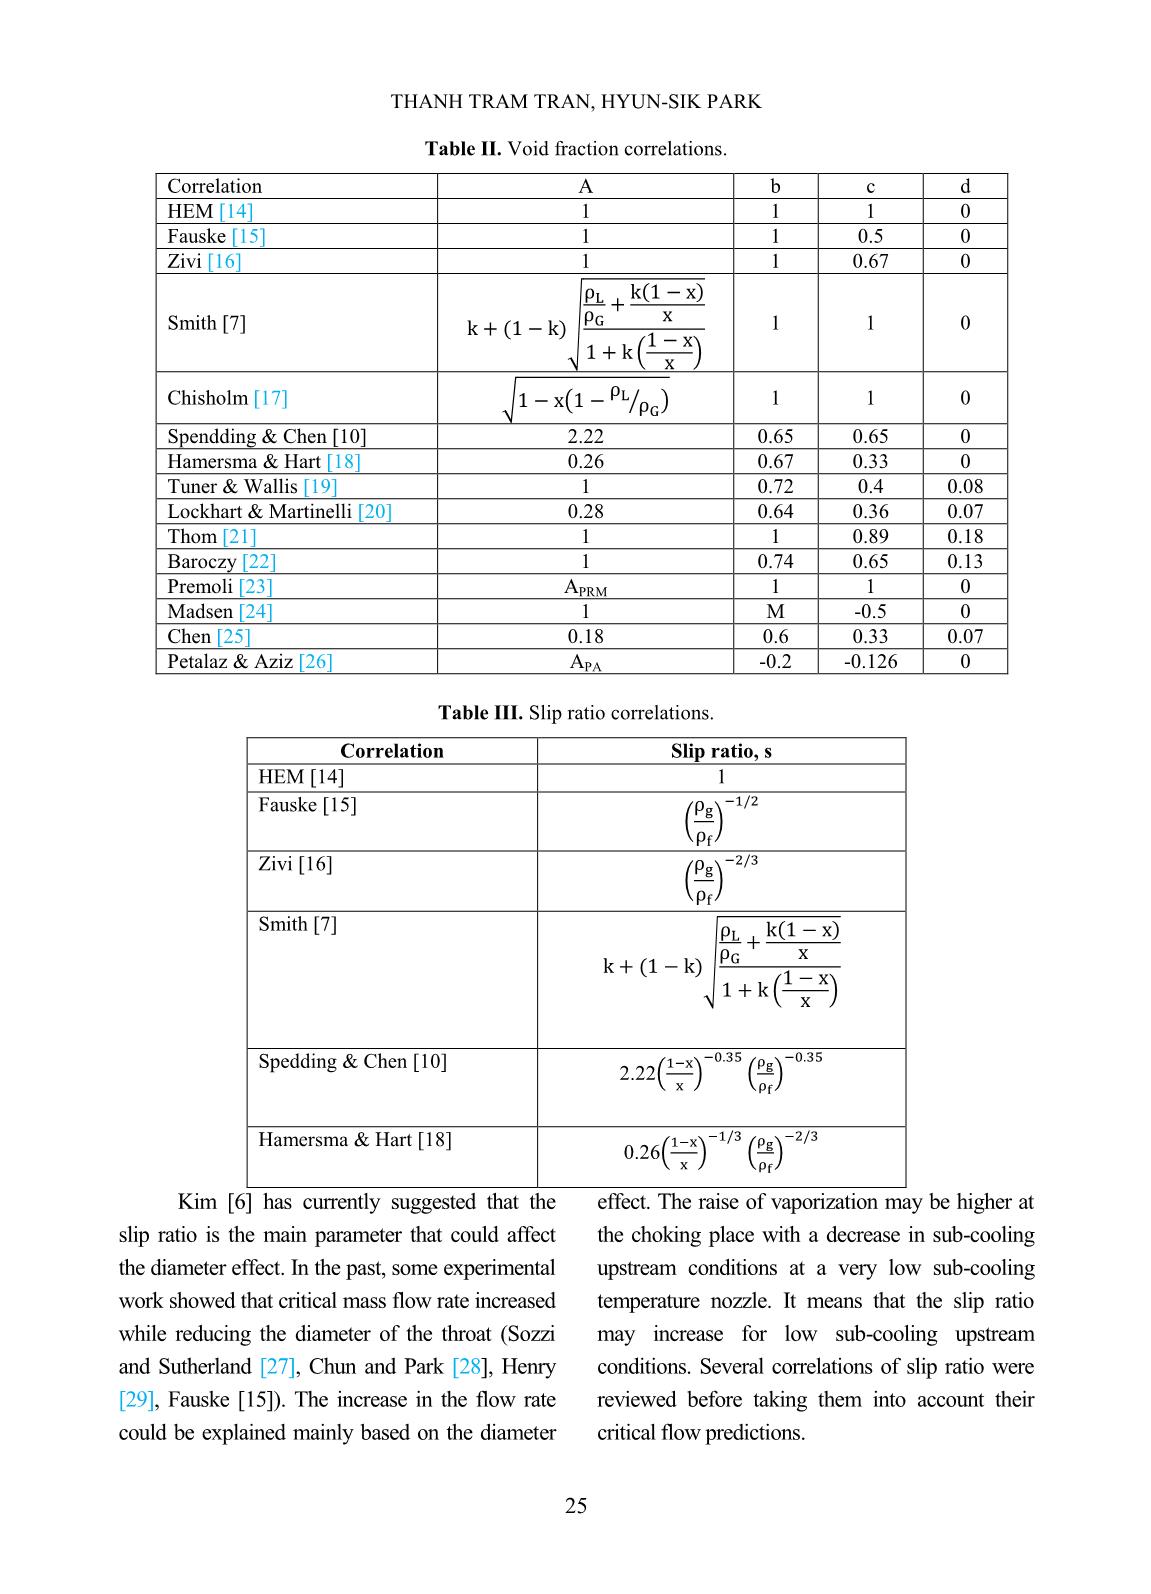
Void fraction correlations related to slip
ratio are listed in Table II.
Where: Re and We are Reynolds and
Weber numbers, D is the equivalent diameter.
APRM, APA and M parameters are determined as
followings:
 {
 },
 (
)
,
, (
)
(
)
,
,
, a
 1+log(
) log(
) ,
 , σ is surface
tension.
Table I. References related void fraction data measurement.
Reference Diameter[mm] Working fluid Geometry Pressure [psi]
Marchettere[11] 127 Steam-Water Rectangular, vertical 114 - 600
Cook [12] 127 Steam-Water Rectangular, vertical 114 - 600
Haywood [13] 12.7-38.1 Steam-Water Pipe, horizontal 250 - 2100
THANH TRAM TRAN, HYUN-SIK PARK
25
Table II. Void fraction correlations.
Correlation A b c d
HEM [14] 1 1 1 0
Fauske [15] 1 1 0.5 0
Zivi [16] 1 1 0.67 0
Smith [7] √
 (
 )
 1 1 0
Chisholm [17] √ (
 ⁄ )
1 1 0
Spendding & Chen [10] 2.22 0.65 0.65 0
Hamersma & Hart [18] 0.26 0.67 0.33 0
Tuner & Wallis [19] 1 0.72 0.4 0.08
Lockhart & Martinelli [20] 0.28 0.64 0.36 0.07
Thom [21] 1 1 0.89 0.18
Baroczy [22] 1 0.74 0.65 0.13
Premoli [23] APRM 1 1 0
Madsen [24] 1 M -0.5 0
Chen [25] 0.18 0.6 0.33 0.07
Petalaz & Aziz [26] APA -0.2 -0.126 0
Table III. Slip ratio correlations.
Kim [6] has currently suggested that the
slip ratio is the main parameter that could affect
the diameter effect. In the past, some experimental
work showed that critical mass flow rate increased
while reducing the diameter of the throat (Sozzi
and Sutherland [27], Chun and Park [28], Henry
[29], Fauske [15]). The increase in the flow rate
could be explained mainly based on the diameter
effect. The raise of vaporization may be higher at
the choking place with a decrease in sub-cooling
upstream conditions at a very low sub-cooling
temperature nozzle. It means that the slip ratio
may increase for low sub-cooling upstream
conditions. Several correlations of slip ratio were
reviewed before taking them into account their
critical flow predictions.
Correlation Slip ratio, s
HEM [14] 1
Fauske [15]
(
)
Zivi [16]
(
)
Smith [7]
 √
 (
 )
Spedding & Chen [10]
2.22(
)
(
)
Hamersma & Hart [18]
0.26(
)
(
)
EVALUATION OF SLIP RATIO CORRELATIONS IN TWO-PHASE FLOW
26
By comparing with the experimental
data, void fraction correlations listed in Table I
are evaluated. The six selected correlations are
rewritten in the slip ratio form, as shown in
Table III. Those slip ratio correlations will be
evaluated in more detail using different
pressures for both horizontal [11] and vertical
[12],[13] tests.
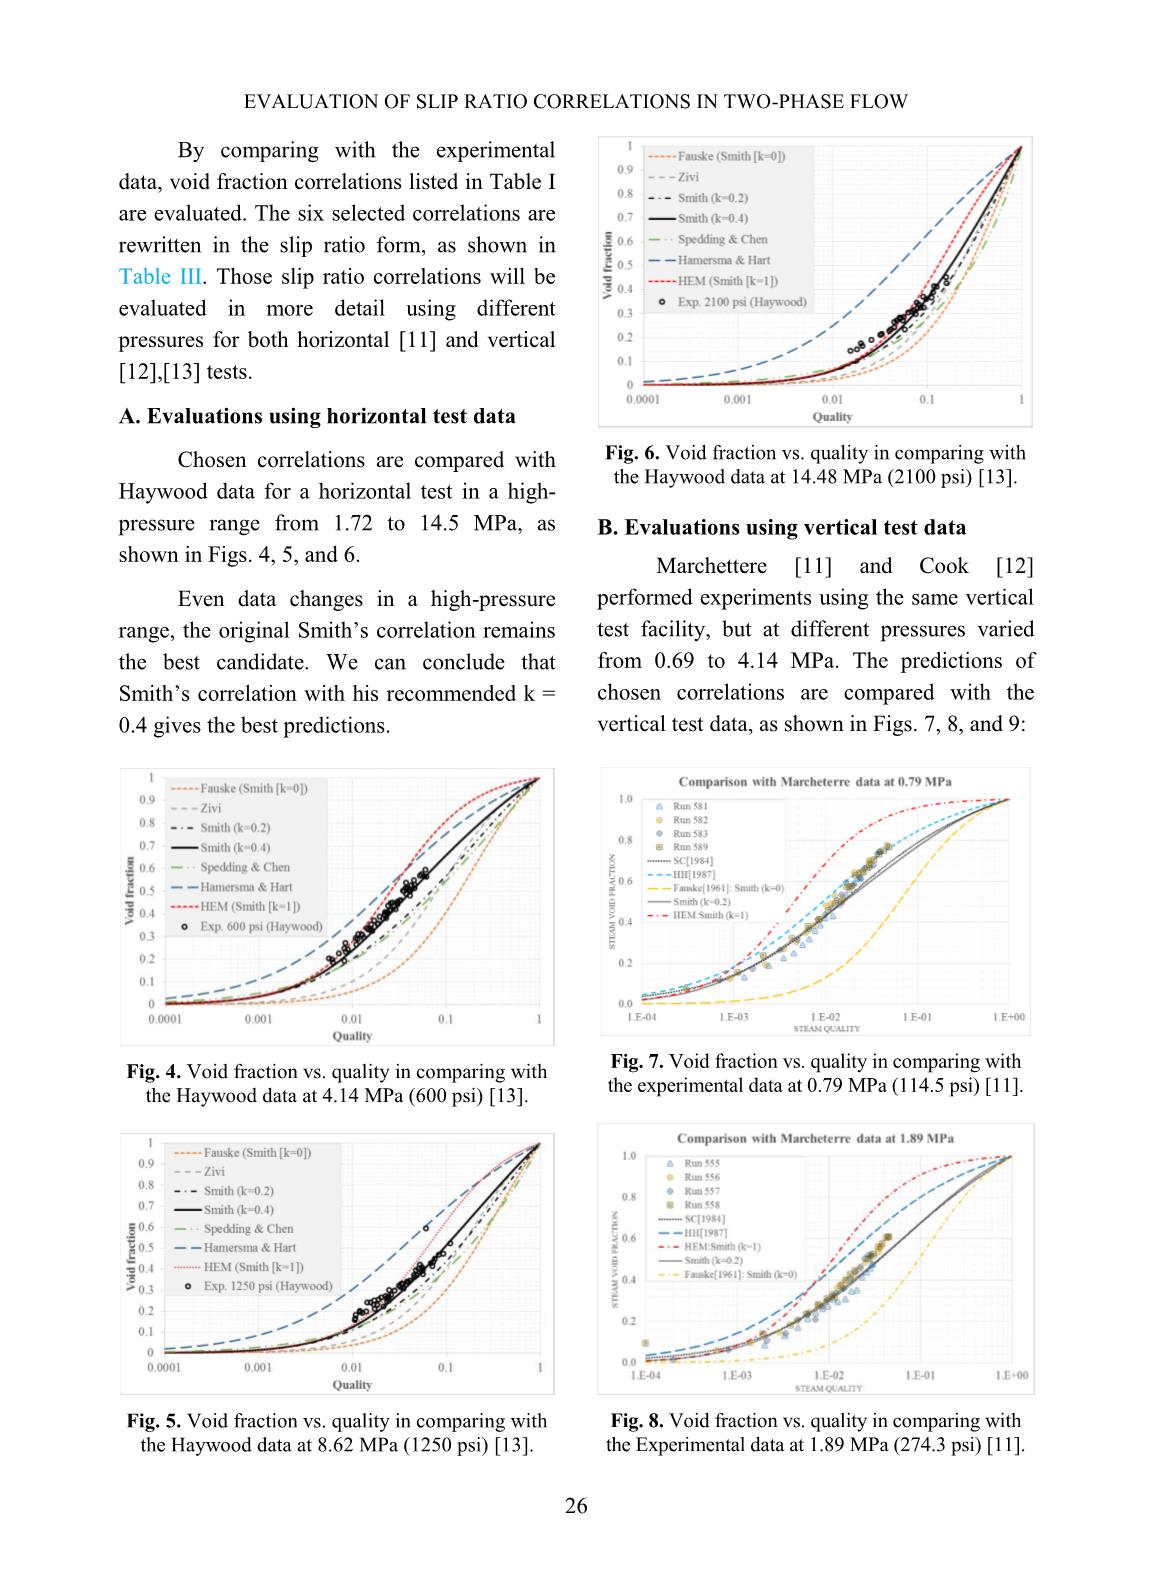
A. Evaluations using horizontal test data
Chosen correlations are compared with
Haywood data for a horizontal test in a high-
pressure range from 1.72 to 14.5 MPa, as
shown in Figs. 4, 5, and 6.
Even data changes in a high-pressure
range, the original Smith’s correlation remains
the best candidate. We can conclude that
Smith’s correlation with his recommended k =
0.4 gives the best predictions.
Fig. 4. Void fraction vs. quality in comparing with
the Haywood data at 4.14 MPa (600 psi) [13].
Fig. 5. Void fraction vs. quality in comparing with
the Haywood data at 8.62 MPa (1250 psi) [13].
Fig. 6. Void fraction vs. quality in comparing with
the Haywood data at 14.48 MPa (2100 psi) [13].
B. Evaluations using vertical test data
Marchettere [11] and Cook [12]
performed experiments using the same vertical
test facility, but at different pressures varied
from 0.69 to 4.14 MPa. The predictions of
chosen correlations are compared with the
vertical test data, as shown in Figs. 7, 8, and 9:
Fig. 7. Void fraction vs. quality in comparing with
the experimental data at 0.79 MPa (114.5 psi) [11].
Fig. 8. Void fraction vs. quality in comparing with
the Experimental data at 1.89 MPa (274.3 psi) [11].
THANH TRAM TRAN, HYUN-SIK PARK
27
The comparison of predictions between
the chosen correlations and the experimental
data from Marchettere [11] and Cook [12]
show that the modified Smith’s correlation
with k = 0.2, as well as Speeding and Chen
[10] one, are the best predictions.
Fig. 9. Void fraction vs. quality in comparing with
the experimental data at 4.24 MPa (614.4 psi) [12].
From these above comparisons, we
could conclude that while the original Smith
correlation with k=0.4 seems to be the best
correlation for the horizontal test, its
modification with k=0.2 could be the best
correlation for the vertical test.
IV. EVALUATION OF SMITH’S
CORRELATION
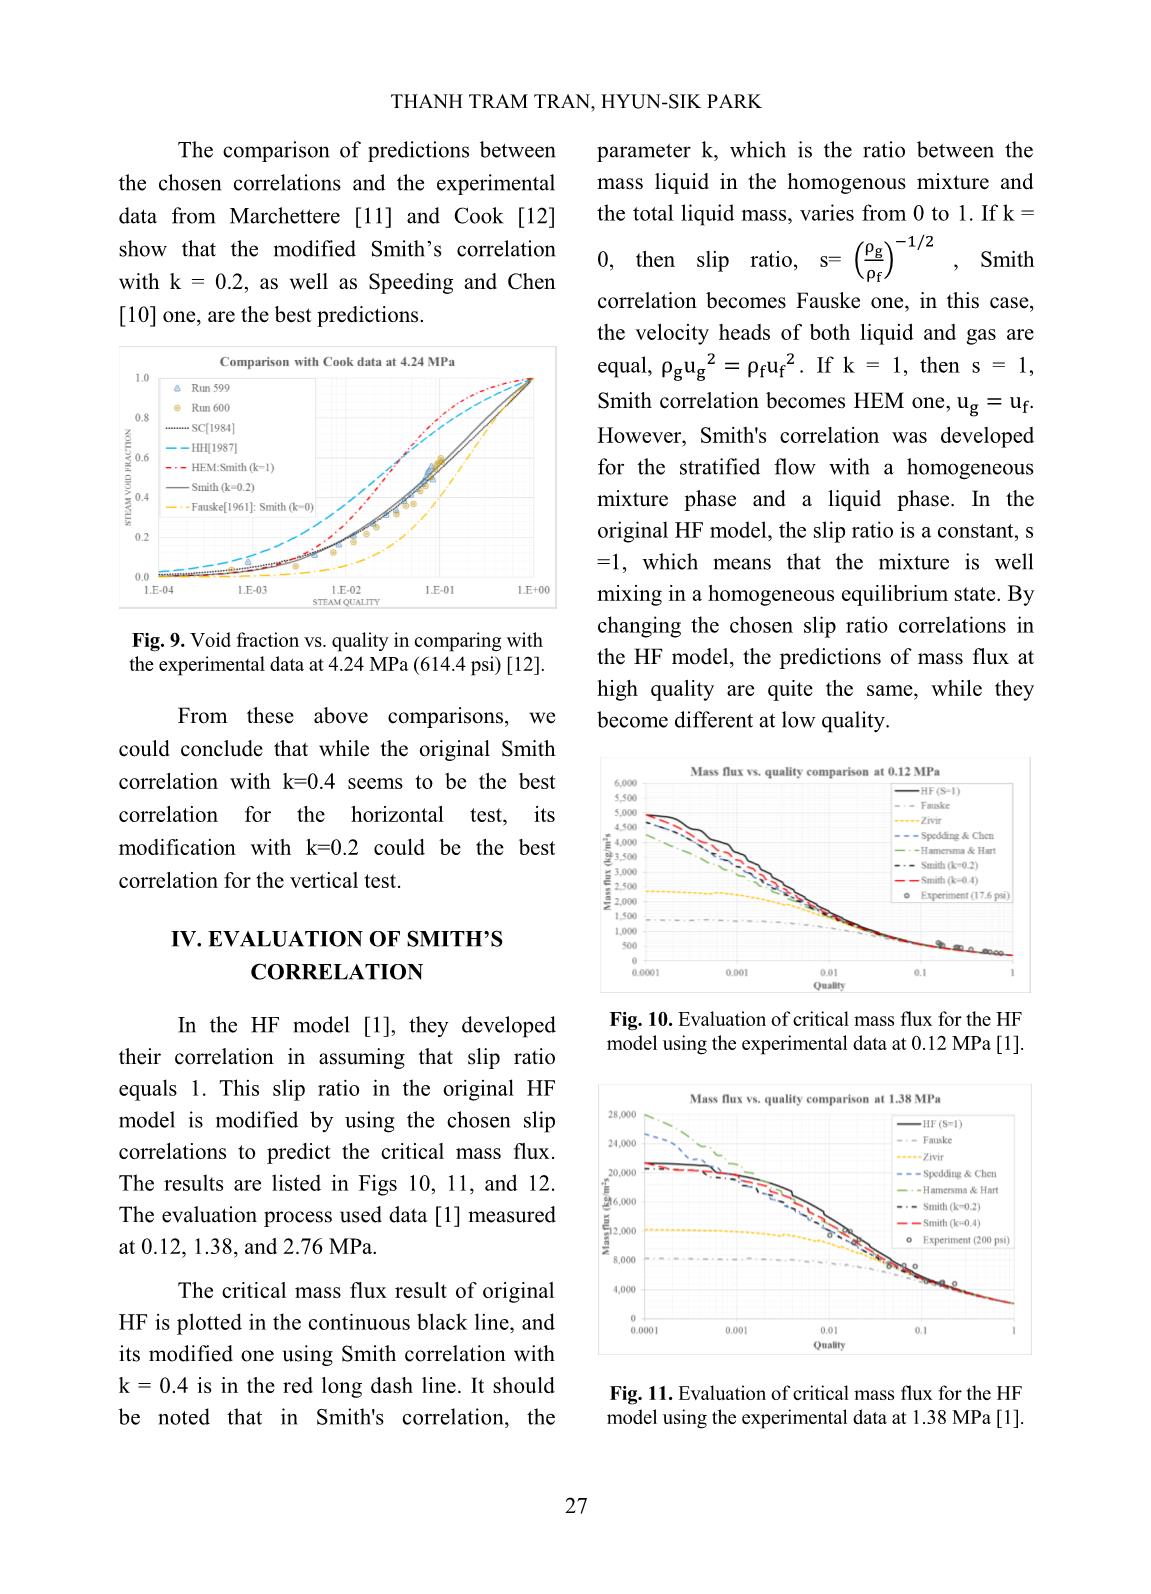
In the HF model [1], they developed
their correlation in assuming that slip ratio
equals 1. This slip ratio in the original HF
model is modified by using the chosen slip
correlations to predict the critical mass flux.
The results are listed in Figs 10, 11, and 12.
The evaluation process used data [1] measured
at 0.12, 1.38, and 2.76 MPa.
The critical mass flux result of original
HF is plotted in the continuous black line, and
its modified one using Smith correlation with
k = 0.4 is in the red long dash line. It should
be noted that in Smith's correlation, the
parameter k, which is the ratio between the
mass liquid in the homogenous mixture and
the total liquid mass, varies from 0 to 1. If k =
0, then slip ratio, s= (
)
 , Smith
correlation becomes Fauske one, in this case,
the velocity heads of both liquid and gas are
equal,
 . If k = 1, then s = 1,
Smith correlation becomes HEM one, .
However, Smith's correlation was developed
for the stratified flow with a homogeneous
mixture phase and a liquid phase. In the
original HF model, the slip ratio is a constant, s
=1, which means that the mixture is well
mixing in a homogeneous equilibrium state. By
changing the chosen slip ratio correlations in
the HF model, the predictions of mass flux at
high quality are quite the same, while they
become different at low quality.
Fig. 10. Evaluation of critical mass flux for the HF
model using the experimental data at 0.12 MPa [1].
Fig. 11. Evaluation of critical mass flux for the HF
model using the experimental data at 1.38 MPa [1].
EVALUATION OF SLIP RATIO CORRELATIONS IN TWO-PHASE FLOW
28
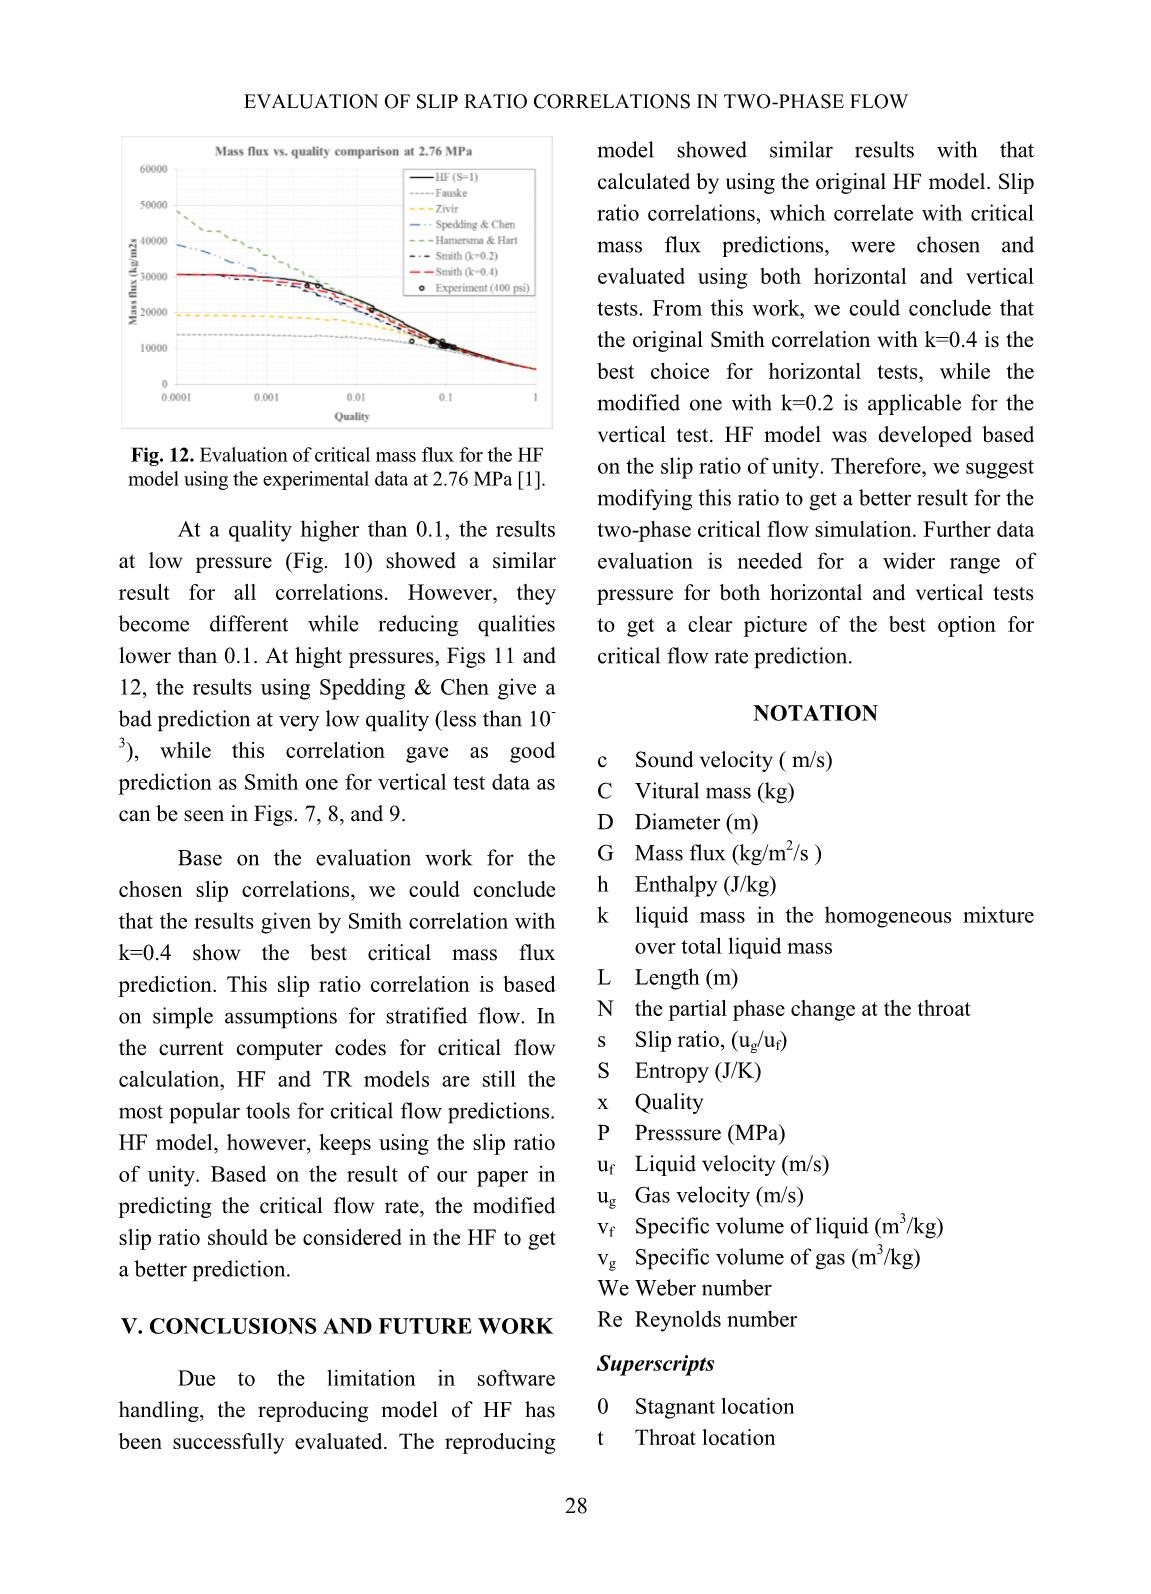
Fig. 12. Evaluation of critical mass flux for the HF
model using the experimental data at 2.76 MPa [1].
At a quality higher than 0.1, the results
at low pressure (Fig. 10) showed a similar
result for all correlations. However, they
become different while reducing qualities
lower than 0.1. At hight pressures, Figs 11 and
12, the results using Spedding & Chen give a
bad prediction at very low quality (less than 10
-
3
), while this correlation gave as good
prediction as Smith one for vertical test data as
can be seen in Figs. 7, 8, and 9.
Base on the evaluation work for the
chosen slip correlations, we could conclude
that the results given by Smith correlation with
k=0.4 show the best critical mass flux
prediction. This slip ratio correlation is based
on simple assumptions for stratified flow. In
the current computer codes for critical flow
calculation, HF and TR models are still the
most popular tools for critical flow predictions.
HF model, however, keeps using the slip ratio
of unity. Based on the result of our paper in
predicting the critical flow rate, the modified
slip ratio should be considered in the HF to get
a better prediction.
V. CONCLUSIONS AND FUTURE WORK
Due to the limitation in software
handling, the reproducing model of HF has
been successfully evaluated. The reproducing
model showed similar results with that
calculated by using the original HF model. Slip
ratio correlations, which correlate with critical
mass flux predictions, were chosen and
evaluated using both horizontal and vertical
tests. From this work, we could conclude that
the original Smith correlation with k=0.4 is the
best choice for horizontal tests, while the
modified one with k=0.2 is applicable for the
vertical test. HF model was developed based
on the slip ratio of unity. Therefore, we suggest
modifying this ratio to get a better result for the
two-phase critical flow simulation. Further data
evaluation is needed for a wider range of
pressure for both horizontal and vertical tests
to get a clear picture of the best option for
critical flow rate prediction.
NOTATION
c Sound velocity ( m/s)
C Vitural mass (kg)
D Diameter (m)
G Mass flux (kg/m
2
/s )
h Enthalpy (J/kg)
k liquid mass in the homogeneous mixture
over total liquid mass
L Length (m)
N the partial phase change at the throat
s Slip ratio, (ug/uf)
S Entropy (J/K)
x Quality
P Presssure (MPa)
uf Liquid velocity (m/s)
ug Gas velocity (m/s)
vf Specific volume of liquid (m
3
/kg)
vg Specific volume of gas (m
3
/kg)
We Weber number
Re Reynolds number
Superscripts
0 Stagnant location
t Throat location
THANH TRAM TRAN, HYUN-SIK PARK
29
g Gas component
f Fluid component
Greeks
α Void fraction
γ Isentropic exponent
λ The root of characteristic equation
η Critical pressure ratio
ρf Liquid density (kg/m
3
)
ρg Gas density (kg/m
3
)
µf Liquid viscosity (Ns/m
2
)
µg Gas viscosity (Ns/m
2
)
REFERENCE
[1]. R. E. Henry, H. K. Fauske, “The two-phase
critical flow of one-component mixtures in
nozzles, orifices and short tubes”, Journal of
heat transfer, 93, 179-187, 1971.
[2]. J. A. Trap and V. H. Ransom, “A choked-flow
calculation criterion for nonhomogeneous,
nonequilibrium, two-phase flows”, Int. J.
Multiphase Flow, 8, 669-681, 1982.
[3]. B. D. Chung et al., MARS Code Manual
Volume V: Models and Correlations,
KAERI, 2006.
[4]. TRACE, V5.0, Theory manual, Field
Equations, solution methods, and physical
models, 2010.
[5]. T. T. Tran, Y.S. Kim, H.S. Park, Study on the
most applicable critical flow models in the
current system codes, KNS Conference
2017, Korea.
[6]. Y. S. Kim et al., “Overview of geometrical
effects on the critical flow rate of sub-cooled
and saturated water”, Annals of Nuclear
Energy, 76, 12-18, 2015.
[7]. S. L. Smith, “Void fractions in two-phase flow:
a correlation based upon an equal velocity
head model”, Proc. Inst. Mech. Engrs, 184,
647-657, Part 1, 1969.
[8]. D. Butterworth, “A comparison of some void
fraction relationships for co-current gas-liquid
flow”, Int. J. Multiphase Flow, 1, 845-850, 1975.
[9]. M.A. Woldesemayat, A.J. Ghajar, “Comparison
of void fraction correlations for different flow
patterns in horizontal and upward vertical
pipes”, International Journal of Multiphase
Flow, 33, 347–370, 2007.
[10]. P. L. Spedding, J. J. J. Chen, “Holdup in two-
phase flow”, Int. J. Multiphase Flow, 10, 307-
339, 1984.
[11]. Marchettere, The effect of pressure on boiling
density in multiple rectangular channels,
Argonne National Laboratory, Illinois, United
States, 1956.
[12]. Cook, Boiling density in vertical rectangular
multichannel sections with natural circulation,
Argonne National Laboratory, Illinois, United
States, 1956.
[13]. Haywood, Experimental study on the flow
conditions and pressure drop of steam-
water mixture at high pressure in heated
and unheated tubes, University of
Cambridge, 1961.
[14]. E. S. Starkman et al., “Expansion of a very
low-quality two-phase fluid through a
convergent-divergent nozzle”, Journal of Basic
Engineering, 86, 247-254, 1964.
[15]. H. K. Fauske, Contribution to the theory of
two-phase, one-component critical flow,
Argonne National Lab, United States, 1962.
[16]. S.M. Zivi, “Estimation of steady-state steam
void fraction by means of the principle of
minimum entropy production”. Trans. ASME,
J. Heat Transfer, 86, 247–252, 1964.
[17]. D. Chisholm, “Pressure gradients due to
friction during the flow of evaporating two-
phase mixtures in smooth tubes and channels”,
Int. J. Heat Mass Transfer, 16, 347-358, 1973.
[18]. P.J. Hamersma, J. Hart,. “A pressure drop
correlation for gas/liquid pipe flow with a
small liquid holdup”. Chem. Eng. Sci.
42,1187–1196, 1987.
[19]. J.M. Turner, G.B. Wallis, The separate-
cylinders model of two-phase flow, Paper No.
NYO-3114-6, Thayer’s School Eng.,
Dartmouth College, Hanover, NH, USA, 1965.
EVALUATION OF SLIP RATIO CORRELATIONS IN TWO-PHASE FLOW
30
[20]. R.W. Lockhart, R.C. Martinelli, “Proposed
correlation of data for isothermal two-phase,
two-component flow in pipes”, Chem. Eng.
Progr. 45, 39–48, 1949.
[21]. J.R.S. Thom, “Prediction of pressure drop
during forced circulation boiling of water”, Int.
J. Heat Mass Transfer 7, 709–724, 1964.
[22]. C.J. Baroczy, “A systemic correlation for two-
phase pressure drop”, Chem. Eng. Progr.
Symp. Ser. 62, 232–249, 1966.
[23]. A. Premoli, D. Francesco, A. Prima, An
empirical correlation for evaluating two-phase
mixture density under adiabatic conditions,
European Two-Phase Flow Group Meeting,
Milan, Italy, 1970.
[24]. N. Madsen, “A void fraction correlation for
vertical and horizontal bulk-boiling of water”.
AIChE J. 21, 607–608, 1975.
[25]. J.J.J. Chen, “A further examination of void-
fraction in the annular two-phase flow”, Int. J.
Heat Mass Transfer 29, 1760–1763, 1986.
[26]. N. Petalaz, K. Aziz, A mechanistic model for
stabilized multiphase flow in pipes, a report for
the members of Stanford reservoir simulation
industrial affiliates and Stanford project on the
productivity and injectivity of horizontal wells,
Stanford University, Palo Alto, CA, 1997.
[27]. G. L. Sozzi, W. A. Sutherland, “Critical flow
of saturated and subcooled water at high
pressure”, Amer. Soc. Mech. Eng. Non-
Equilibrium Two-Phase Flow Symp., 47, 1975.
[28]. M. H. Chun and C. K. Park, “An experimental
investigation of critical flow rates of subcooled
water through short pipes with small
diameters”, Int. Comm. Heat Mass Transfer, 23
(No. 8), 1053-1064, 1996.
[29]. R. E. Henry, Pressure pulse propagation in
two-phase one and two-component mixtures,
ANL-7792, Argonne National Laboratory.
Illinois, United States, 1971.
File đính kèm:
 evaluation_of_slip_ratio_correlations_in_two_phase_flow.pdf

