Effects of number of simulated particles on the uncertainty in simulation of dispersion of radioactive material using FLEXPART program
FLEXPART software simulates atmospheric emissions based on wind-field movements and
random disturbances. To simulate random processes, FLEXPART uses a certain number of simulation
particles. Changing the number of simulation particles causes a change in the simulated results of the
dispersion concentration of the radionuclides. The larger number of simulated particles results in the
more accurate simulated results. However, increasing the number of simulated particles results in the
increasing of the computational cost. The report presents an assessment of the uncertainty in the
concentration of radionuclides in simulating dispersion of 137Cs and 131I nuclides using FLEXPART
software according to the number of simulation particles. The number of simulation particles used in
this study are 100, 1000, 5000, 7500, 10000, 15000, 20000, 25000 and 30000 particles / hour. Using
the image processing software OpenCV to evaluate the uncertainties of simulated results according to
the number of simulated particles used. Evaluation results show that the simulated results are
acceptable with the number of simulated particles being of 20000 particles/hour.
Trang 1
Trang 2
Trang 3
Trang 4
Trang 5
Trang 6
Trang 7
Tóm tắt nội dung tài liệu: Effects of number of simulated particles on the uncertainty in simulation of dispersion of radioactive material using FLEXPART program
Technology, 179 Hoang Quoc Viet, Ha Noi, Viet Nam
3
Nuclear Training Center, 140 Nguyen Tuan, Ha Noi, Viet Nam
(Received 05 August 2019, accepted 15 September 2019)
Abstract: FLEXPART software simulates atmospheric emissions based on wind-field movements and
random disturbances. To simulate random processes, FLEXPART uses a certain number of simulation
particles. Changing the number of simulation particles causes a change in the simulated results of the
dispersion concentration of the radionuclides. The larger number of simulated particles results in the
more accurate simulated results. However, increasing the number of simulated particles results in the
increasing of the computational cost. The report presents an assessment of the uncertainty in the
concentration of radionuclides in simulating dispersion of
137
Cs and
131I nuclides using FLEXPART
software according to the number of simulation particles. The number of simulation particles used in
this study are 100, 1000, 5000, 7500, 10000, 15000, 20000, 25000 and 30000 particles / hour. Using
the image processing software OpenCV to evaluate the uncertainties of simulated results according to
the number of simulated particles used. Evaluation results show that the simulated results are
acceptable with the number of simulated particles being of 20000 particles/hour.
Keywords: FLEXPART, uncertainty, simulation particle, OpenCV.
I. INTRODUCTION
 FLEXPART software is widely used in
simulation of air dispersion. FLEXPART
software uses the Lagrangian particle model to
describe particle trajectories moving in the
environment. The Lagrangian particle model is
widely used and generally accepted as a
powerful tool to simulate the dispersion of
pollutants in a gaseous environment. To
simulate random processes the FLEXPART
program uses a certain number of simulated
particles. They are the notional particles that do
not represent the real aerosol particles, but the
points moving with the ambient flows. The
output of FLEXPART program is the
distribution of these points in three
dimensional space and converted into the
distribution of pollutant concentration. In this
study, we use the FLEXPART program to
simulate the dispersion of radionuclides during
the Fukushima nuclear power plant accident.
The change in the number of simulated
particles leads to a change in the simulation
results of the dispersion concentrations of
radionuclides. The larger number of simulation
particles, the more accurate the simulation
result we can get. However, as the number of
particles simulated increases, the cost of
calculation also increases. So the question is
how we can determine the reasonable number
of simulated particles which can produce the
good enough result, while the computational
cost is kept at the feasible level. In the
published works using the FLEXPART
program to simulate the dispersion of
pollutants in the air environment, the used
number of simulated particles varied in a fairly
wide range from 5000 particles/hour [1] to
1000000 particles/hour [2]. However, there has
EFFECTS OF NUMBER OF SIMULATED PARTICLES ON THE UNCERTAINTY IN
22
not been a publication on how to choose the
number of simulated particles to be used. In
this study, we investigated and assessed the
difference in the concentration of radionuclides
in the dispersion simulation of
137
Cs and
131
I
when using FLEXPART software according to
the various numbers of simulated particles. The
numbers of simulated particles used in this
study to be 100, 1000, 5000, 7500, 10000,
15000, 20000, 25000, and 30000
particles/hour.
II. CONTENT
A. Subjects and methods
The FLEXPART program uses the
number of simulated particles to simulate the
dispersion of pollutants. The program
provides simulation results of pollutant
concentration in the form of three-
dimensional grid longitude, latitude and
altitude. These output data are not easily to
compare directly. Use the Quicklook software
to process the three-dimensional output data
of FLEXPART into the two dimensional
images of distribution for radionuclide
concentrations. In this study, in order to
simulate the dispersion, we use the same
source terms of
137
Cs and
131
I emitted during
the Fukushima nuclear power plant accident
from 15:00 UTC on March 11
st
,2011 to 0:00
UTC on April 20
th
,2011 with number of
simulated particles being of 100, 1000, 5000,
7500, 10000, 15000, 20000, 25000, and
30000 particles/ hour. Radioactive nuclide
137
Cs has the aerosol form and radioactive
nuclide
131
I has the gaseous form. The
simulation results for dispersion of the
radionuclides
137
Cs and
131
I with the number
of simulated particles being of 30000 particles
per hour are considered as the reference
results. We assessed the difference in the
simulation results of the concentration of
radionuclides according to the number of
simulated particles being of 100, 1000, 5000,
7500, 10000, 15000, 20000, 25000
particles/hour with the case of simulated
particles of 30000 particles/hour. In order to
assess the difference in the concentration
distribution of radionuclides between the two
images, one is the simulation result with the
number of simulated particles used as one of
these cases 100, 1000, 5000, 7500, 10000,
15000, 20000, 25000 particles/hour and
another is the simulation result with the
number of particles simulated being of 30000
particles/hour, we used the quantity of
average squared error (Mean Squared Error -
MSE). The quantity MSE is defined as
follows:
∑ ∑ [ ( ) ( )]
 (1)
Where m, n are the coordinate indexes of
longitude and latitude coordinates.
I (i, j) is the radionuclide concentration
at the coordinate (i, j) with the number of
simulated particles as one of these cases 100,
1000, 5000, 7500, 10000, 15000, 20000, 25000
particles/hour.
K (i, j) is the concentration of
radionuclide at the coordinate (i, j) with the
number of simulated particles being of 30000
particles/hour.
To calculate MSE quantity we use a
piece of software written in the Python
language with the numpy library [3].
In order to simulate the dispersion
process of radionuclides with the number of
simulated particles as one of these cases 100,
1000, 5000, 7500, 10000, 15000, 20000, 25000
and 30000 particles/hour we run FLEXPART
on a supercomputer with configuration 24 CPU
Intel (R) Xeon (R) X5650 @ 2.67GHz Linux
operating system, 32Gb RAM.
NGUYEN HAO QUANG et al.
23
B. Results
With the above computer configuration, the
calculated times with the number of simulated
particles being of 100, 1000, 5000, 7500,
10000, 15000, 20000, 25000 and 30000
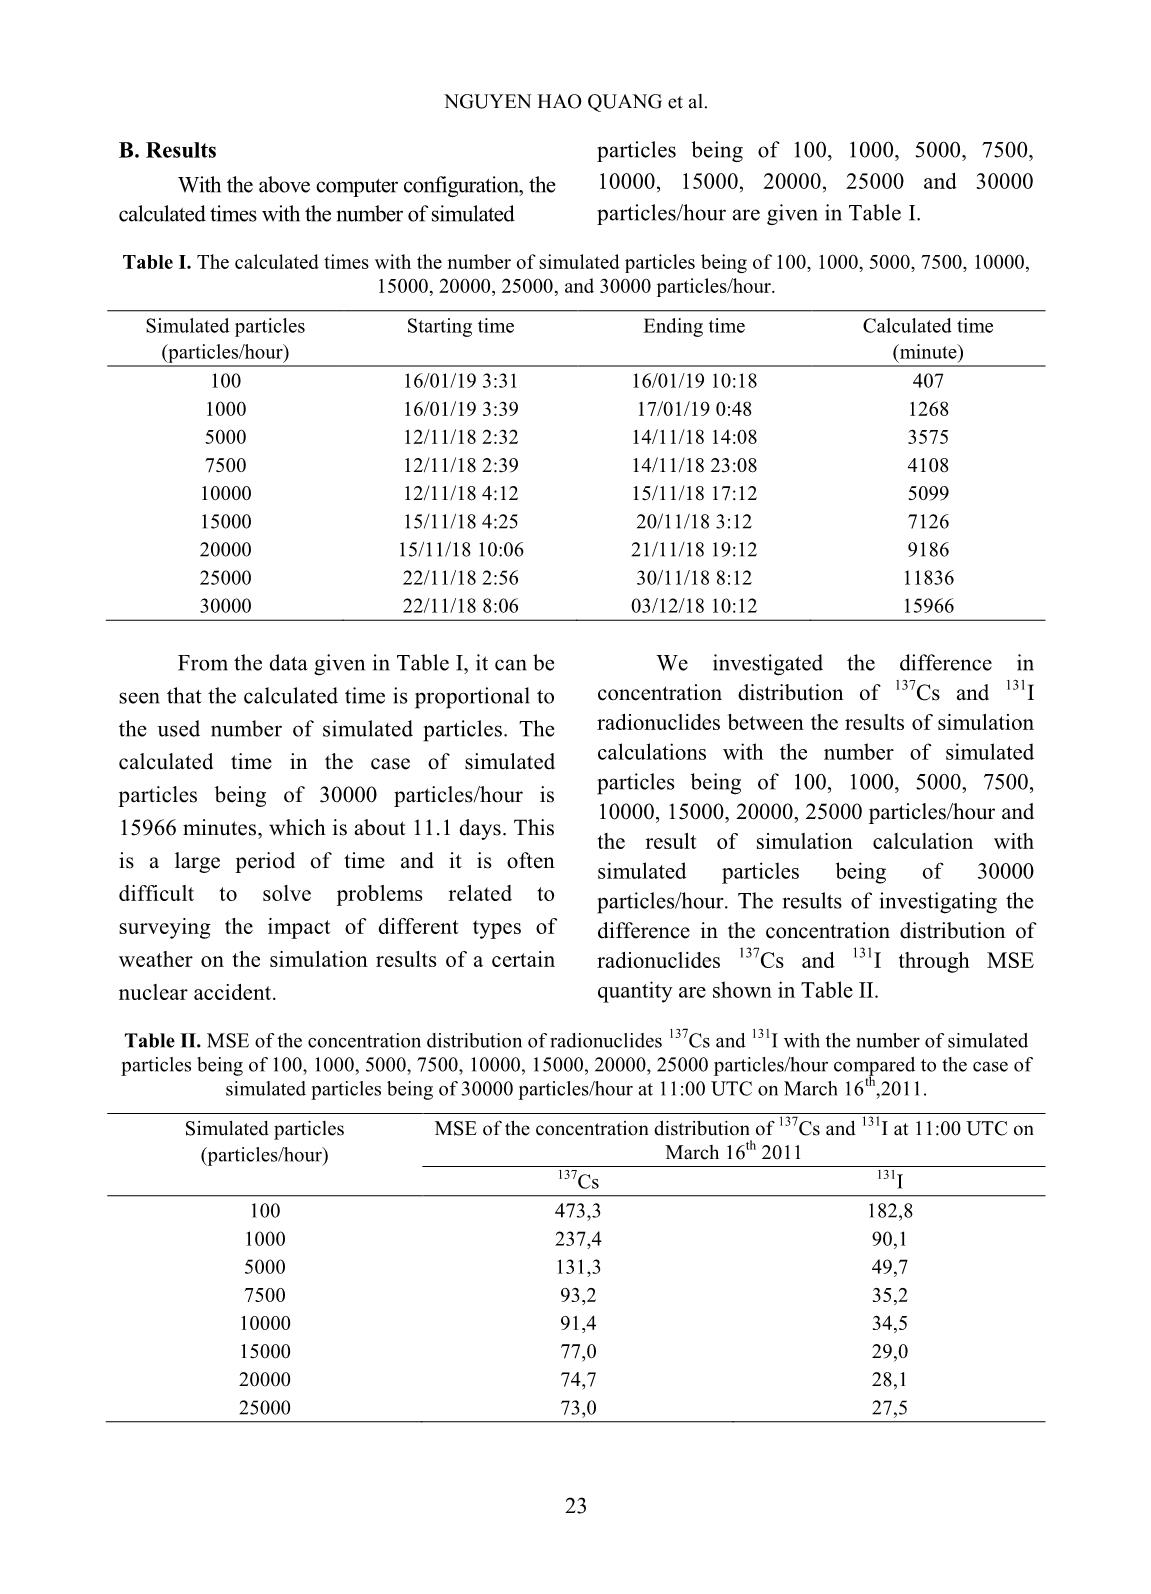
particles/hour are given in Table I.
Table I. The calculated times with the number of simulated particles being of 100, 1000, 5000, 7500, 10000,
15000, 20000, 25000, and 30000 particles/hour.
Simulated particles
(particles/hour)
Starting time Ending time Calculated time
(minute)
100 16/01/19 3:31 16/01/19 10:18 407
1000 16/01/19 3:39 17/01/19 0:48 1268
5000 12/11/18 2:32 14/11/18 14:08 3575
7500 12/11/18 2:39 14/11/18 23:08 4108
10000 12/11/18 4:12 15/11/18 17:12 5099
15000 15/11/18 4:25 20/11/18 3:12 7126
20000 15/11/18 10:06 21/11/18 19:12 9186
25000 22/11/18 2:56 30/11/18 8:12 11836
30000 22/11/18 8:06 03/12/18 10:12 15966
From the data given in Table I, it can be
seen that the calculated time is proportional to
the used number of simulated particles. The
calculated time in the case of simulated
particles being of 30000 particles/hour is
15966 minutes, which is about 11.1 days. This
is a large period of time and it is often
difficult to solve problems related to
surveying the impact of different types of
weather on the simulation results of a certain
nuclear accident.
We investigated the difference in
concentration distribution of
137
Cs and
131
I
radionuclides between the results of simulation
calculations with the number of simulated
particles being of 100, 1000, 5000, 7500,
10000, 15000, 20000, 25000 particles/hour and
the result of simulation calculation with
simulated particles being of 30000
particles/hour. The results of investigating the
difference in the concentration distribution of
radionuclides
137
Cs and
131
I through MSE
quantity are shown in Table II.
Table II. MSE of the concentration distribution of radionuclides
137
Cs and
131
I with the number of simulated
particles being of 100, 1000, 5000, 7500, 10000, 15000, 20000, 25000 particles/hour compared to the case of
simulated particles being of 30000 particles/hour at 11:00 UTC on March 16
th
,2011.
Simulated particles
(particles/hour)
MSE of the concentration distribution of
137
Cs and
131
I at 11:00 UTC on
March 16
th
 2011
137
Cs
131
I
100 473,3 182,8
1000 237,4 90,1
5000 131,3 49,7
7500 93,2 35,2
10000 91,4 34,5
15000 77,0 29,0
20000 74,7 28,1
25000 73,0 27,5
EFFECTS OF NUMBER OF SIMULATED PARTICLES ON THE UNCERTAINTY IN
24
Table III. MSE of the concentration distribution of radionuclides
137
Cs and
131
I with the number of simulated
particles being of 100, 1000, 5000, 7500, 10000, 15000, 20000, 25000 particles/hour compared to the case of
simulated particles being of 30000 particles/hour at 18:00 UTC on April 2
nd
,2011.
Simulated particles
(particles/hour)
MSE of the concentration distribution of
137
Cs and
131
I at 11:00 UTC on
April 2
nd
,2011
137
Cs
131
I
100 3906,4 4055,2
1000 1264,5 1256,0
5000 466,0 457,6
7500 363,2 356,3
10000 312,6 306,5
15000 248,5 243,6
20000 226,4 222,2
25000 217,2 213,3
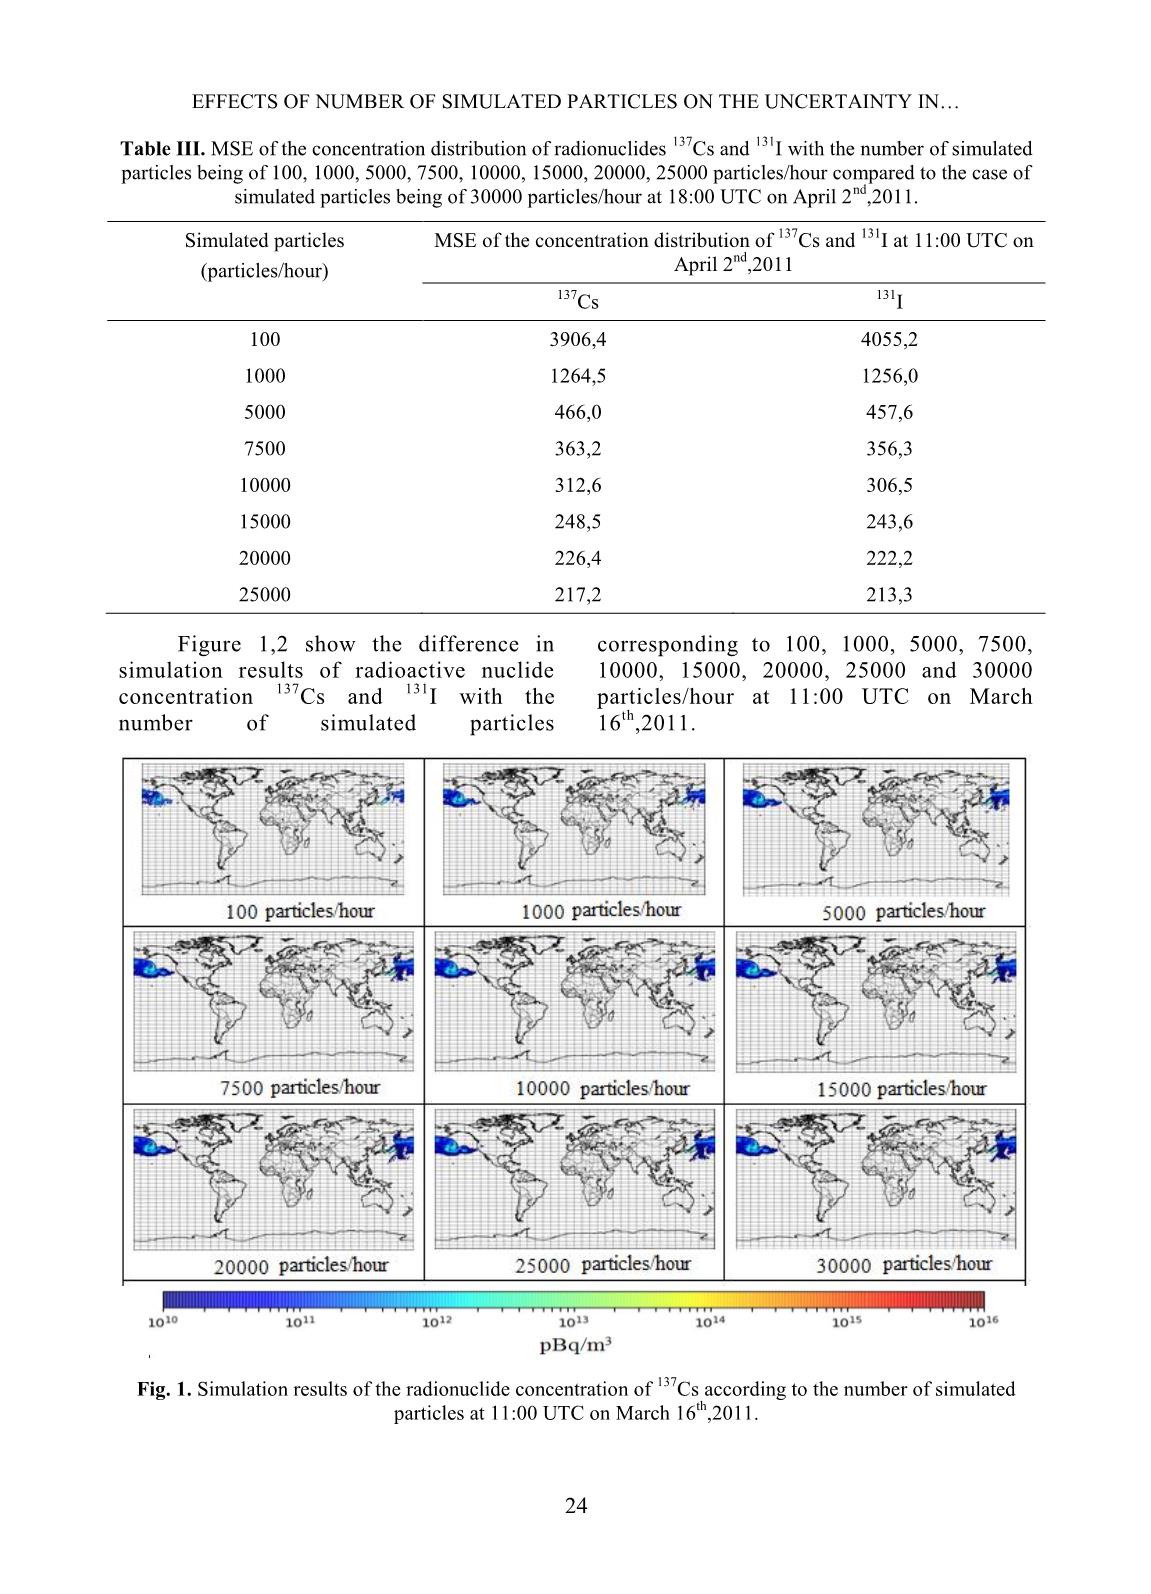
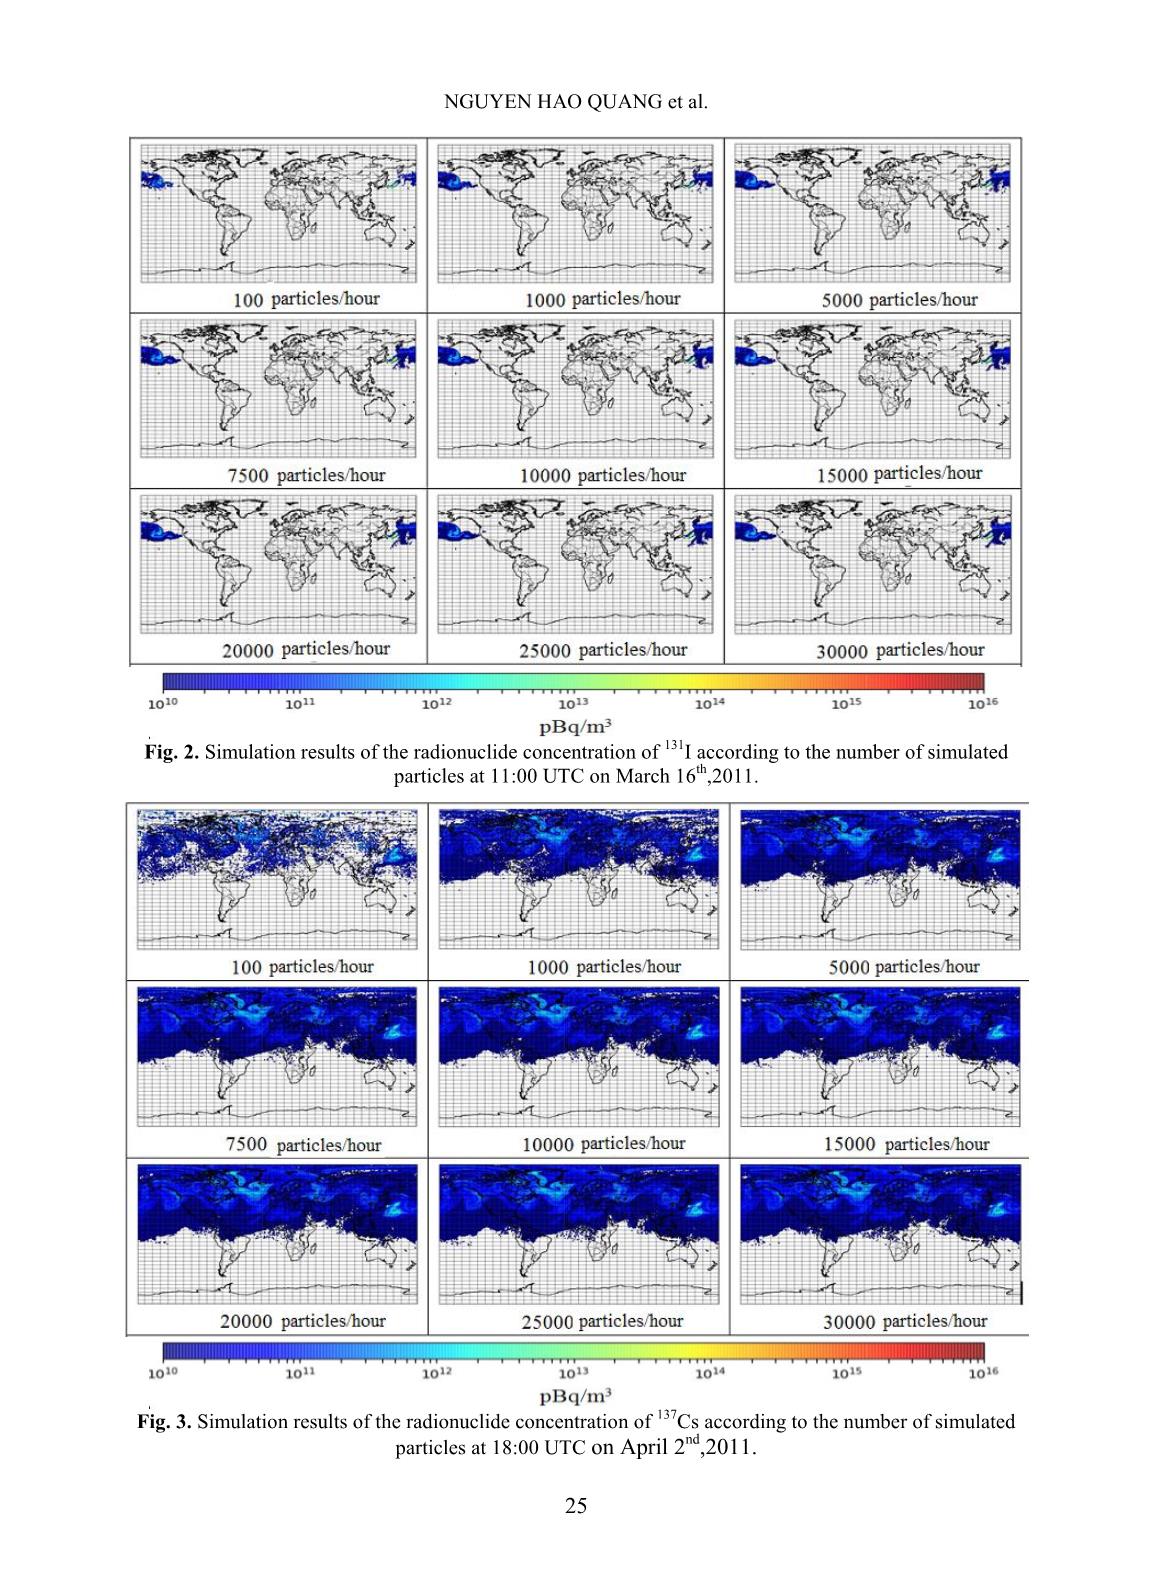
Figure 1,2 show the difference in
simulation results of radioactive nuclide
concentration
137
Cs and
131
I with the
number of simulated particles
corresponding to 100, 1000, 5000, 7500,
10000, 15000, 20000, 25000 and 30000
particles/hour at 11:00 UTC on March
16
th
,2011.
Fig. 1. Simulation results of the radionuclide concentration of
137
Cs according to the number of simulated
particles at 11:00 UTC on March 16
th
,2011.
NGUYEN HAO QUANG et al.
25
Fig. 2. Simulation results of the radionuclide concentration of
131
I according to the number of simulated
particles at 11:00 UTC on March 16
th
,2011.
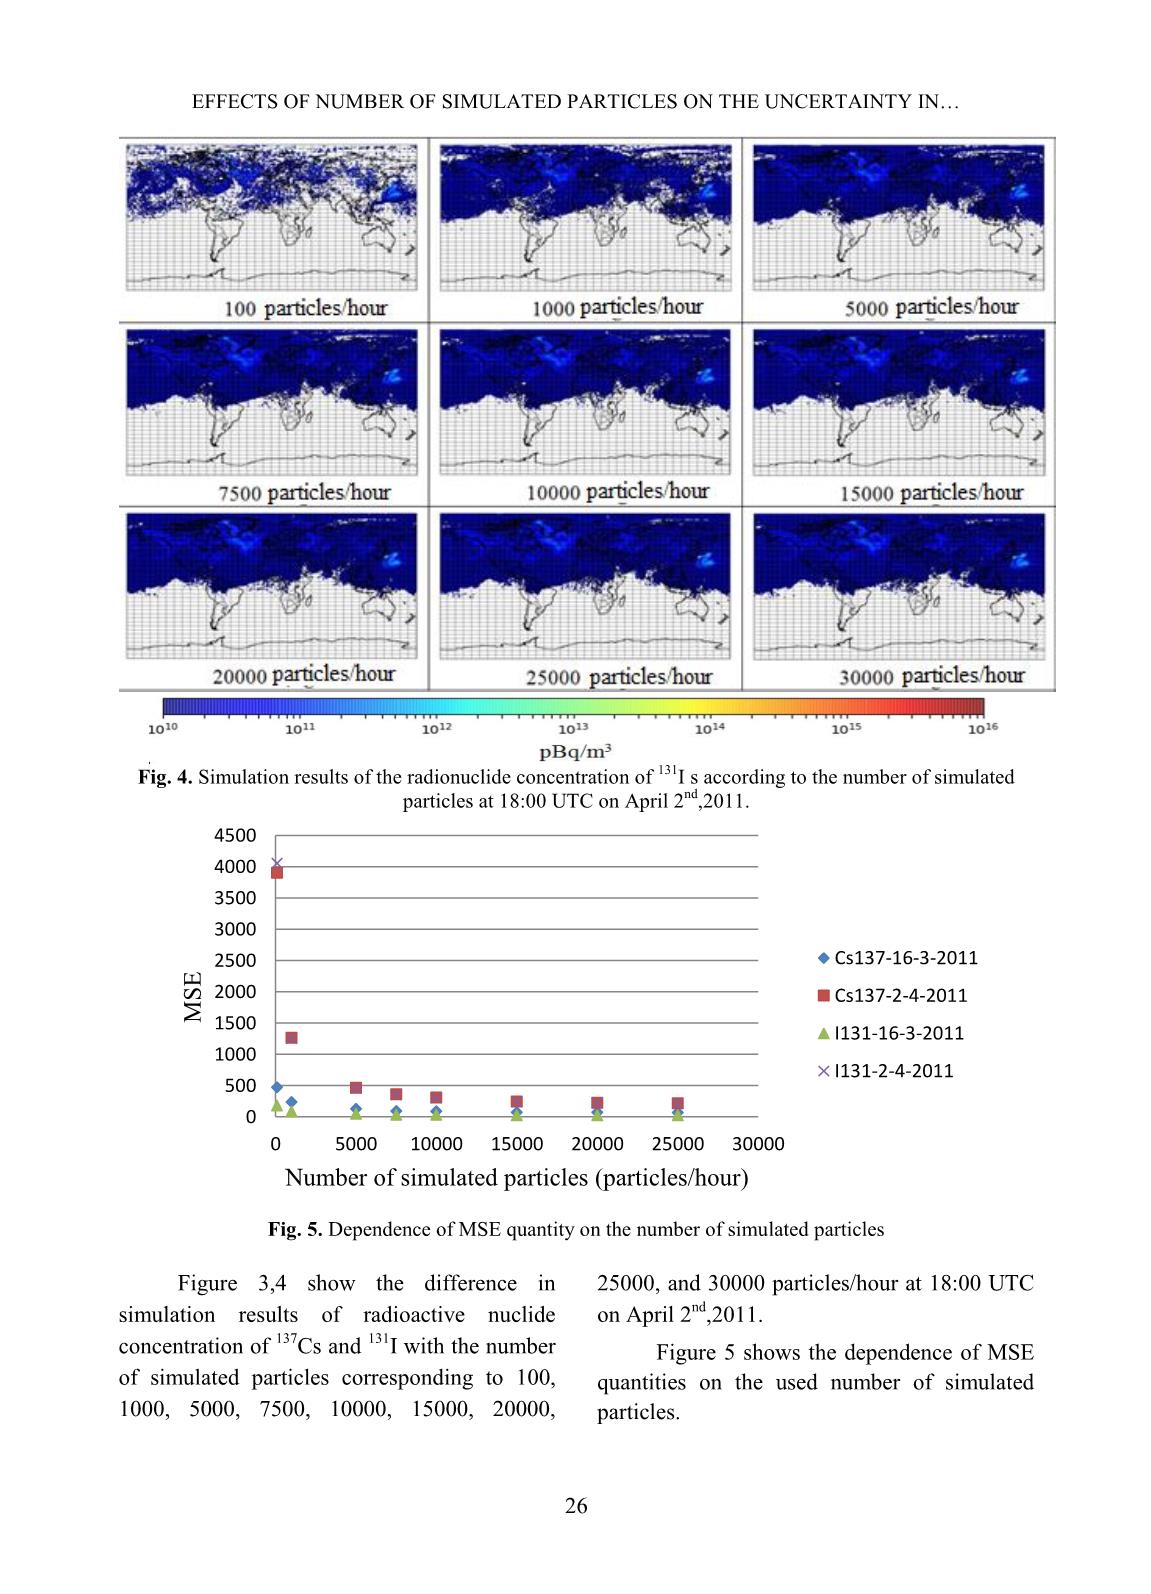
Fig. 3. Simulation results of the radionuclide concentration of
137
Cs according to the number of simulated
particles at 18:00 UTC on April 2
nd
,2011.
EFFECTS OF NUMBER OF SIMULATED PARTICLES ON THE UNCERTAINTY IN
26
Fig. 4. Simulation results of the radionuclide concentration of
131
I s according to the number of simulated
particles at 18:00 UTC on April 2
nd
,2011.
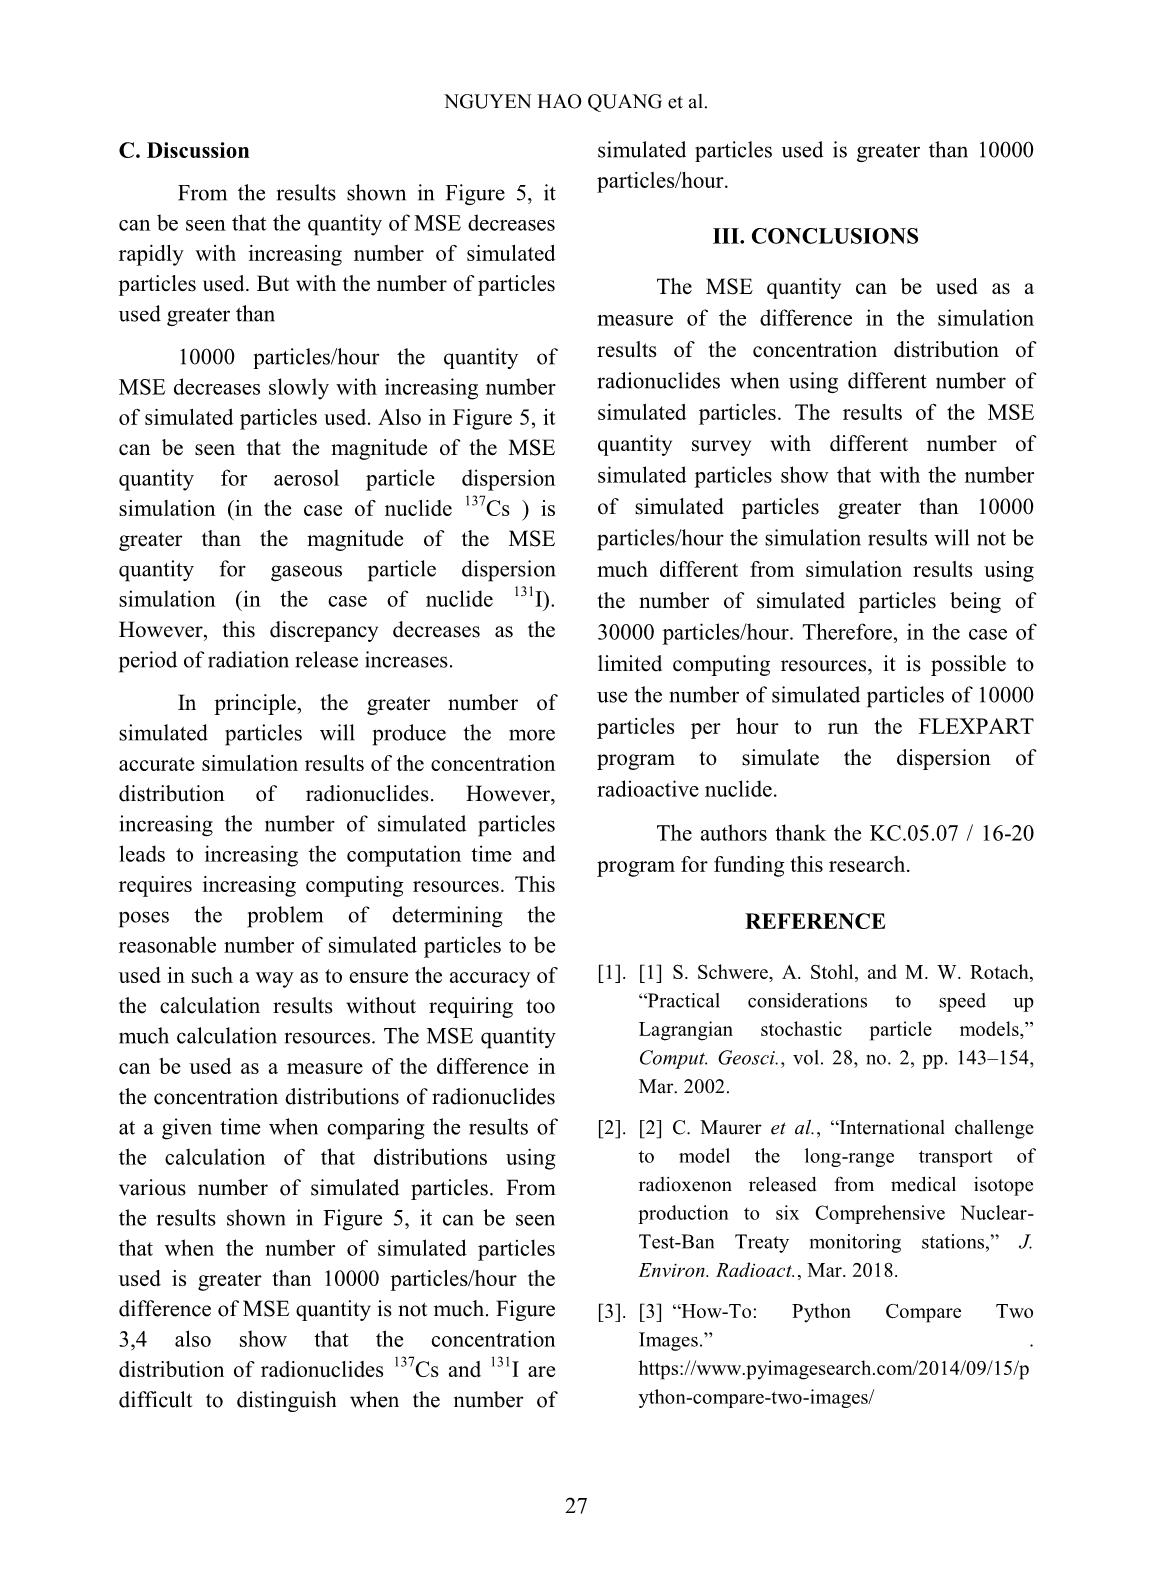
Fig. 5. Dependence of MSE quantity on the number of simulated particles
Figure 3,4 show the difference in
simulation results of radioactive nuclide
concentration of
137
Cs and
131
I with the number
of simulated particles corresponding to 100,
1000, 5000, 7500, 10000, 15000, 20000,
25000, and 30000 particles/hour at 18:00 UTC
on April 2
nd
,2011.
Figure 5 shows the dependence of MSE
quantities on the used number of simulated
particles.
0
500
1000
1500
2000
2500
3000
3500
4000
4500
0 5000 10000 15000 20000 25000 30000
M
S
E
Number of simulated particles (particles/hour)
Cs137-16-3-2011
Cs137-2-4-2011
I131-16-3-2011
I131-2-4-2011
NGUYEN HAO QUANG et al.
27
C. Discussion
From the results shown in Figure 5, it
can be seen that the quantity of MSE decreases
rapidly with increasing number of simulated
particles used. But with the number of particles
used greater than
10000 particles/hour the quantity of
MSE decreases slowly with increasing number
of simulated particles used. Also in Figure 5, it
can be seen that the magnitude of the MSE
quantity for aerosol particle dispersion
simulation (in the case of nuclide
137
Cs ) is
greater than the magnitude of the MSE
quantity for gaseous particle dispersion
simulation (in the case of nuclide
131
I).
However, this discrepancy decreases as the
period of radiation release increases.
In principle, the greater number of
simulated particles will produce the more
accurate simulation results of the concentration
distribution of radionuclides. However,
increasing the number of simulated particles
leads to increasing the computation time and
requires increasing computing resources. This
poses the problem of determining the
reasonable number of simulated particles to be
used in such a way as to ensure the accuracy of
the calculation results without requiring too
much calculation resources. The MSE quantity
can be used as a measure of the difference in
the concentration distributions of radionuclides
at a given time when comparing the results of
the calculation of that distributions using
various number of simulated particles. From
the results shown in Figure 5, it can be seen
that when the number of simulated particles
used is greater than 10000 particles/hour the
difference of MSE quantity is not much. Figure
3,4 also show that the concentration
distribution of radionuclides
137
Cs and
131
I are
difficult to distinguish when the number of
simulated particles used is greater than 10000
particles/hour.
III. CONCLUSIONS
The MSE quantity can be used as a
measure of the difference in the simulation
results of the concentration distribution of
radionuclides when using different number of
simulated particles. The results of the MSE
quantity survey with different number of
simulated particles show that with the number
of simulated particles greater than 10000
particles/hour the simulation results will not be
much different from simulation results using
the number of simulated particles being of
30000 particles/hour. Therefore, in the case of
limited computing resources, it is possible to
use the number of simulated particles of 10000
particles per hour to run the FLEXPART
program to simulate the dispersion of
radioactive nuclide.
The authors thank the KC.05.07 / 16-20
program for funding this research.
REFERENCE
[1]. [1] S. Schwere, A. Stohl, and M. W. Rotach,
“Practical considerations to speed up
Lagrangian stochastic particle models,”
Comput. Geosci., vol. 28, no. 2, pp. 143–154,
Mar. 2002.
[2]. [2] C. Maurer et al., “International challenge
to model the long-range transport of
radioxenon released from medical isotope
production to six Comprehensive Nuclear-
Test-Ban Treaty monitoring stations,” J.
Environ. Radioact., Mar. 2018.
[3]. [3] “How-To: Python Compare Two
Images.” .
https://www.pyimagesearch.com/2014/09/15/p
ython-compare-two-images/
File đính kèm:
 effects_of_number_of_simulated_particles_on_the_uncertainty.pdf

