Determining node density to guarantee average latency in duty-Cycled wireless sensor networks
Some applications of Internet of Things (IoTs) require that generated data are delivered to
the sink within an end-to-end (E2E) delay bound. Moreover, to save energy consumption or
to lengthen the network lifetime, a duty cycle scheme is applied in which sensor nodes
periodically switch the radio on and off. In the duty-cycled networks, packet delay is
greatly affected by node deployment, therefore we aim to determine node density in a
wireless sensor network in order to guarantee the average E2E delay given network
parameters using the probability theory. Simulation results show that the proposed node
deployment method consumes less energy while requiring a smaller number of sensor
nodes than those of other existing works.
Trang 1
Trang 2
Trang 3
Trang 4
Trang 5
Trang 6
Trang 7
Trang 8
Trang 9
Trang 10
Tải về để xem bản đầy đủ
Tóm tắt nội dung tài liệu: Determining node density to guarantee average latency in duty-Cycled wireless sensor networks
s in each
layer, the duty cycle interval, and the area radius. After that, the average delay of nodes
in layer k can be approximated using one-hop delays.
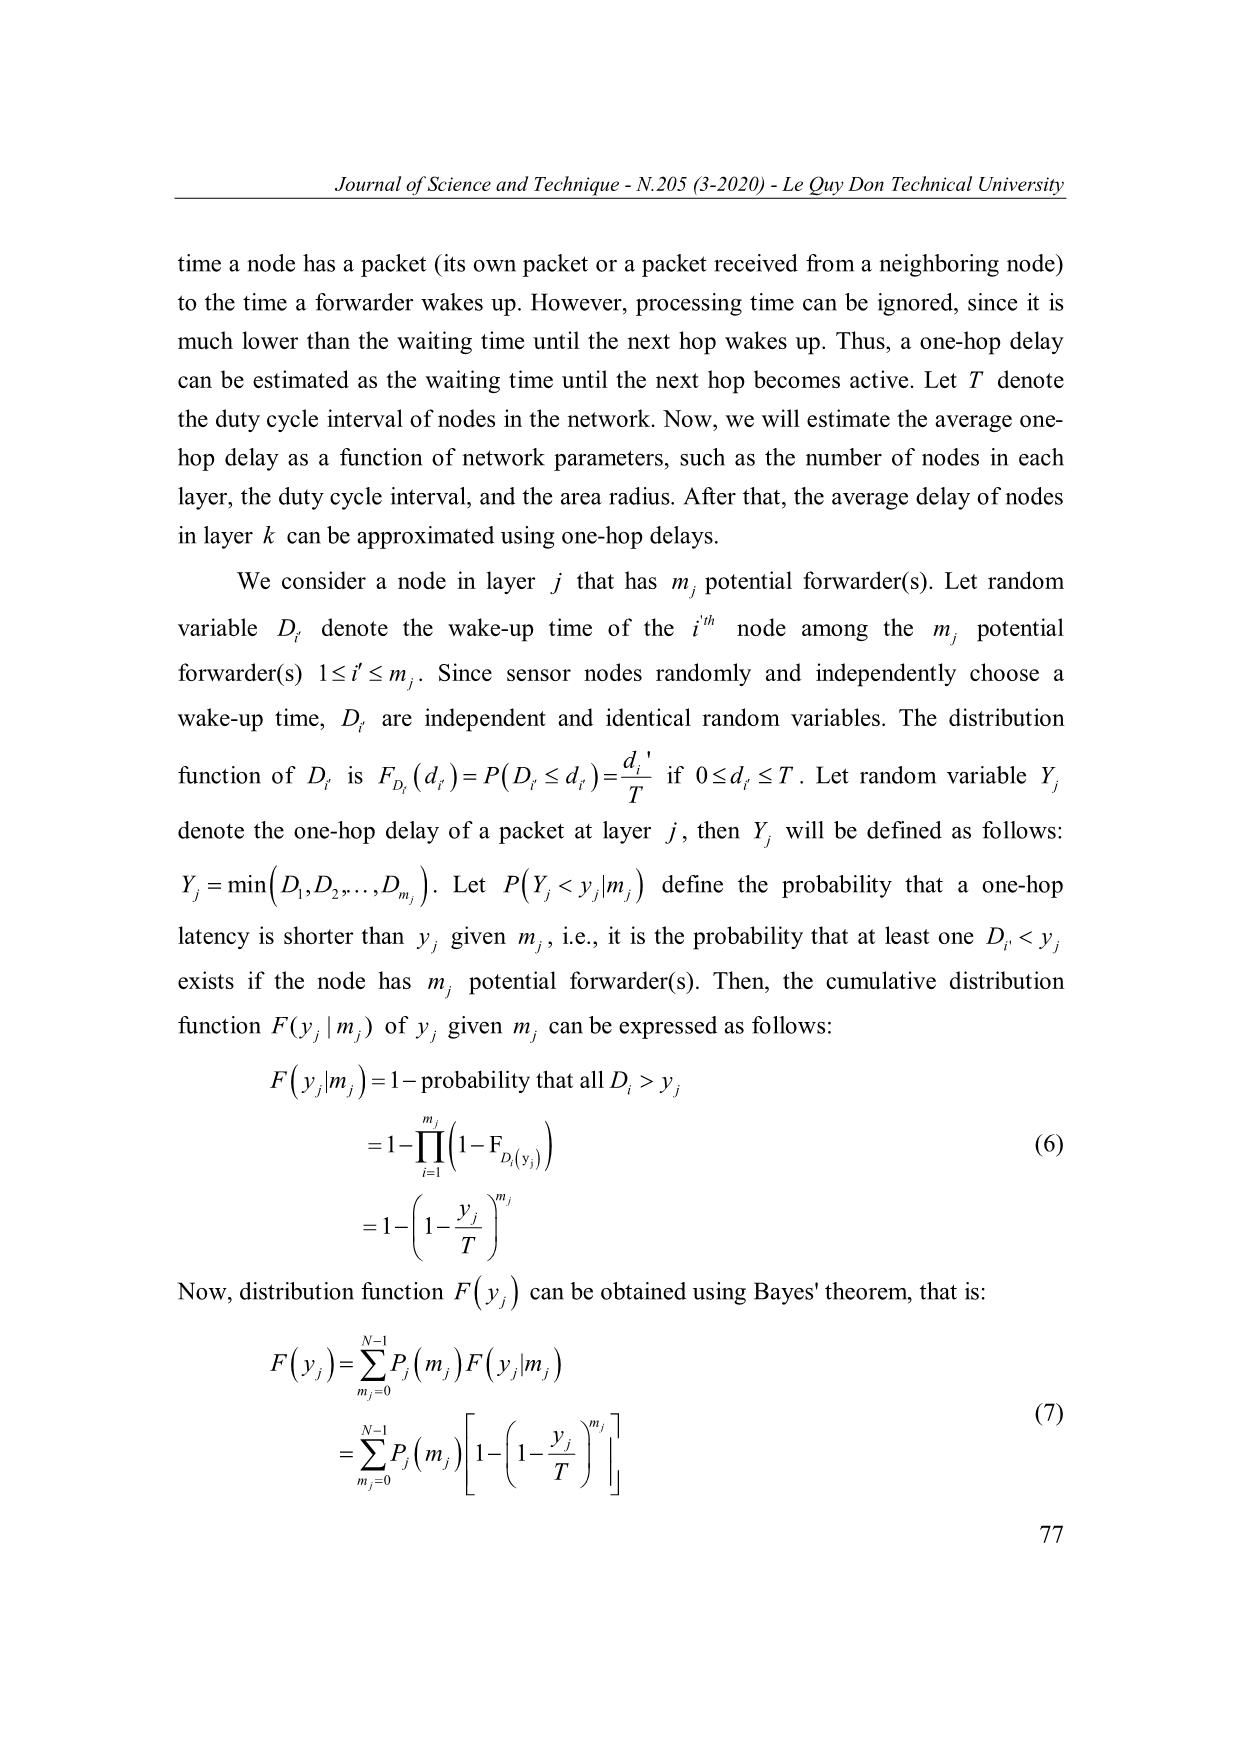
We consider a node in layer j that has m j potential forwarder(s). Let random
'th
variable Di denote the wake-up time of the i node among the mj potential
forwarder(s) 1 i m j . Since sensor nodes randomly and independently choose a
wake-up time, Di are independent and identical random variables. The distribution
di '
function of Di is FD d i P D i d i if 0 di T . Let random variable Yj
i T
denote the one-hop delay of a packet at layer j , then Yj will be defined as follows:
YDDD min , , , . Let P Y y| m define the probability that a one-hop
j 1 2 m j j j j
latency is shorter than y j given mj , i.e., it is the probability that at least one Di' y j
exists if the node has mj potential forwarder(s). Then, the cumulative distribution
function F( yj | m j ) of y j given mj can be expressed as follows:
F yj| m j 1 probability that all D i y j
m j
1 1 F (6)
Di yj
i 1
m j
y j
1 1
T
Now, distribution function F y j can be obtained using Bayes' theorem, that is:
N 1
F yj P j m j F y j | m j
m j 0
m (7)
N 1 j
y j
Pj m j 1 1
m 0 T
j
77
Journal of Science and Technique - N.205 (3-2020) - Le Quy Don Technical University
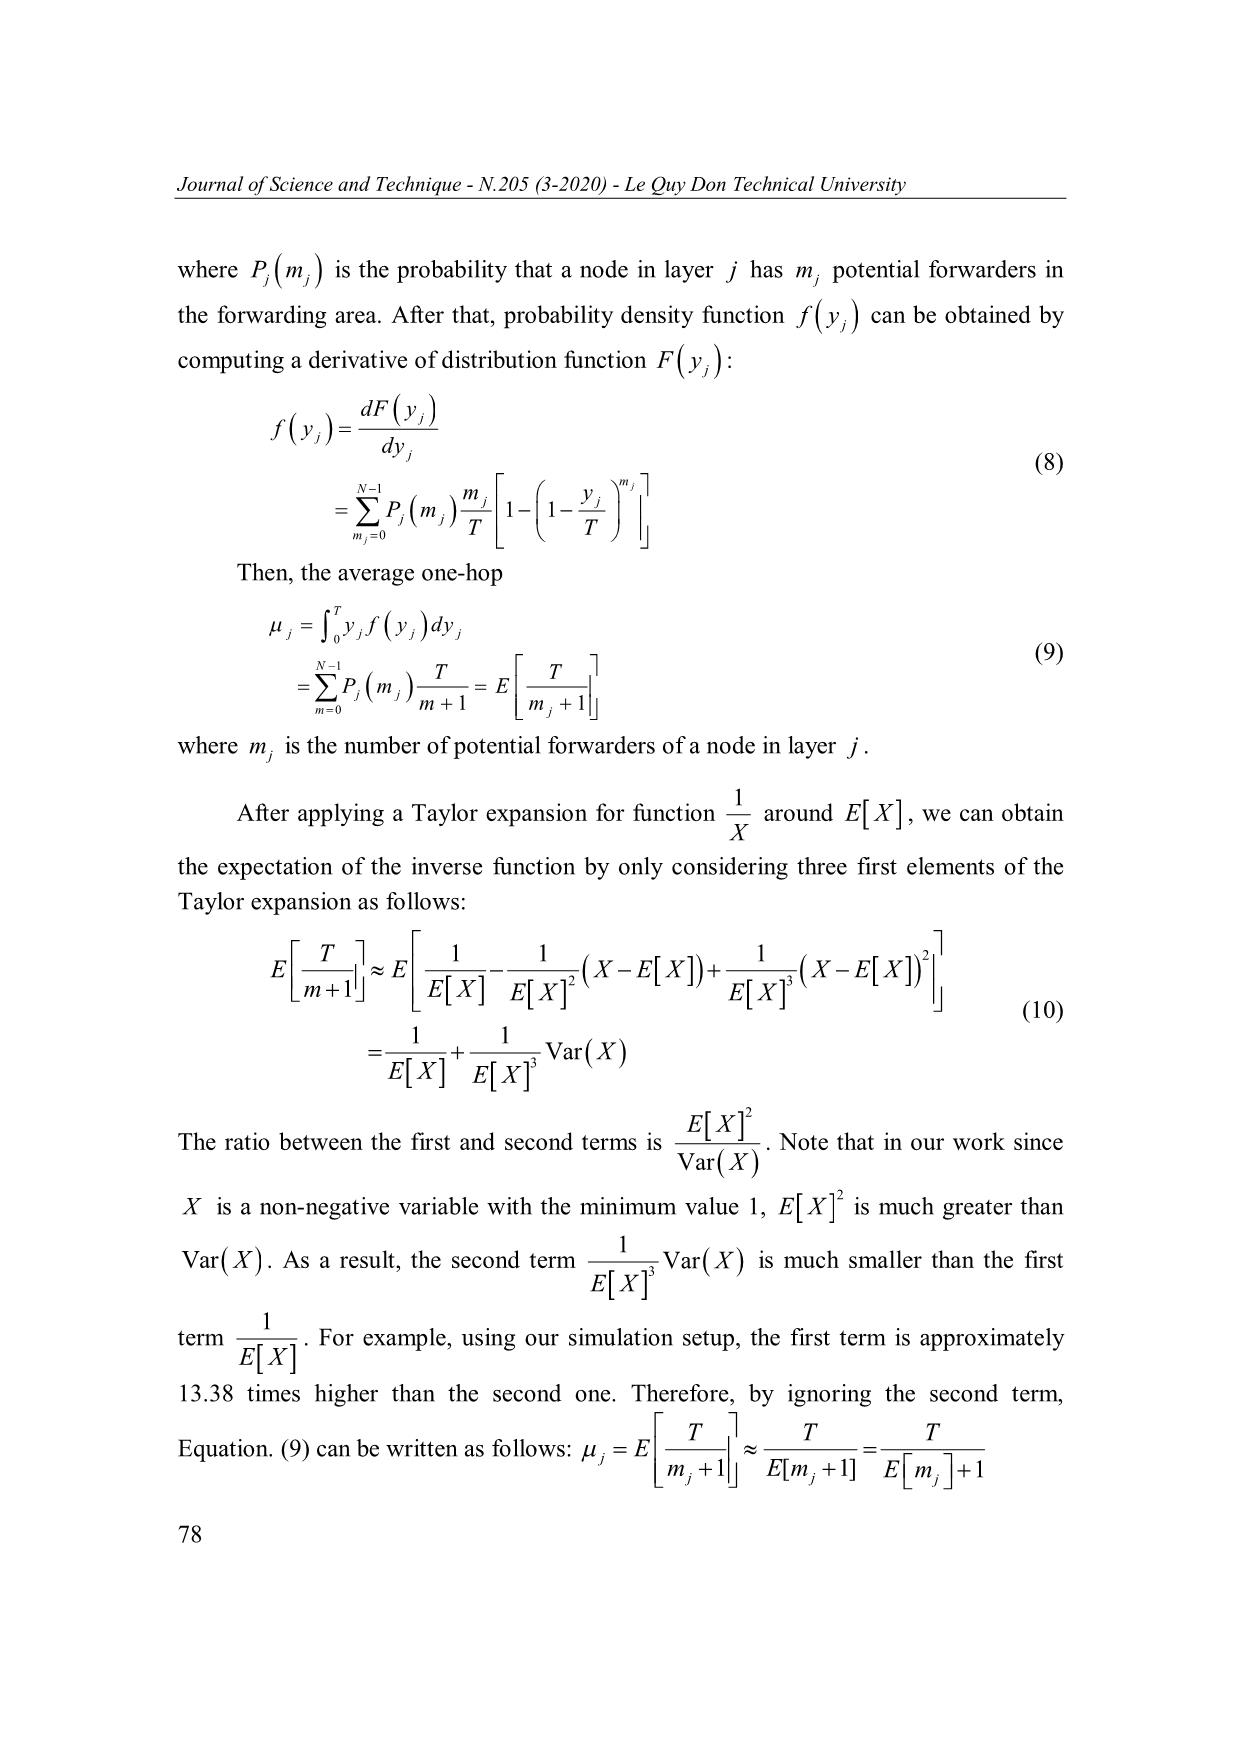
where Pj m j is the probability that a node in layer j has mj potential forwarders in
the forwarding area. After that, probability density function f y j can be obtained by
computing a derivative of distribution function F y j :
dF y j
f y j
dy
j (8)
m
N 1 m y j
j j
Pj m j 1 1
m 0 TT
j
Then, the average one-hop
T
y f y dy
j 0 j j j
(9)
N 1 TT
Pj m j E
m 0 m 1 m j 1
where mj is the number of potential forwarders of a node in layer j .
1
After applying a Taylor expansion for function around EX , we can obtain
X
the expectation of the inverse function by only considering three first elements of the
Taylor expansion as follows:
T 1 1 1 2
EEXEXXEX
2 3
m 1 E X EXEX
(10)
1 1
Var X
EX EX 3
EX 2
The ratio between the first and second terms is . Note that in our work since
Var X
X is a non-negative variable with the minimum value 1, EX 2 is much greater than
1
Var X . As a result, the second term 3 Var X is much smaller than the first
EX
1
term . For example, using our simulation setup, the first term is approximately
EX
13.38 times higher than the second one. Therefore, by ignoring the second term,
TTT
Equation. (9) can be written as follows: E
j m 1 E [ m 1]
j j E mj 1
78
Journal of Science and Technique - N.205 (3-2020) - Le Quy Don Technical University
1
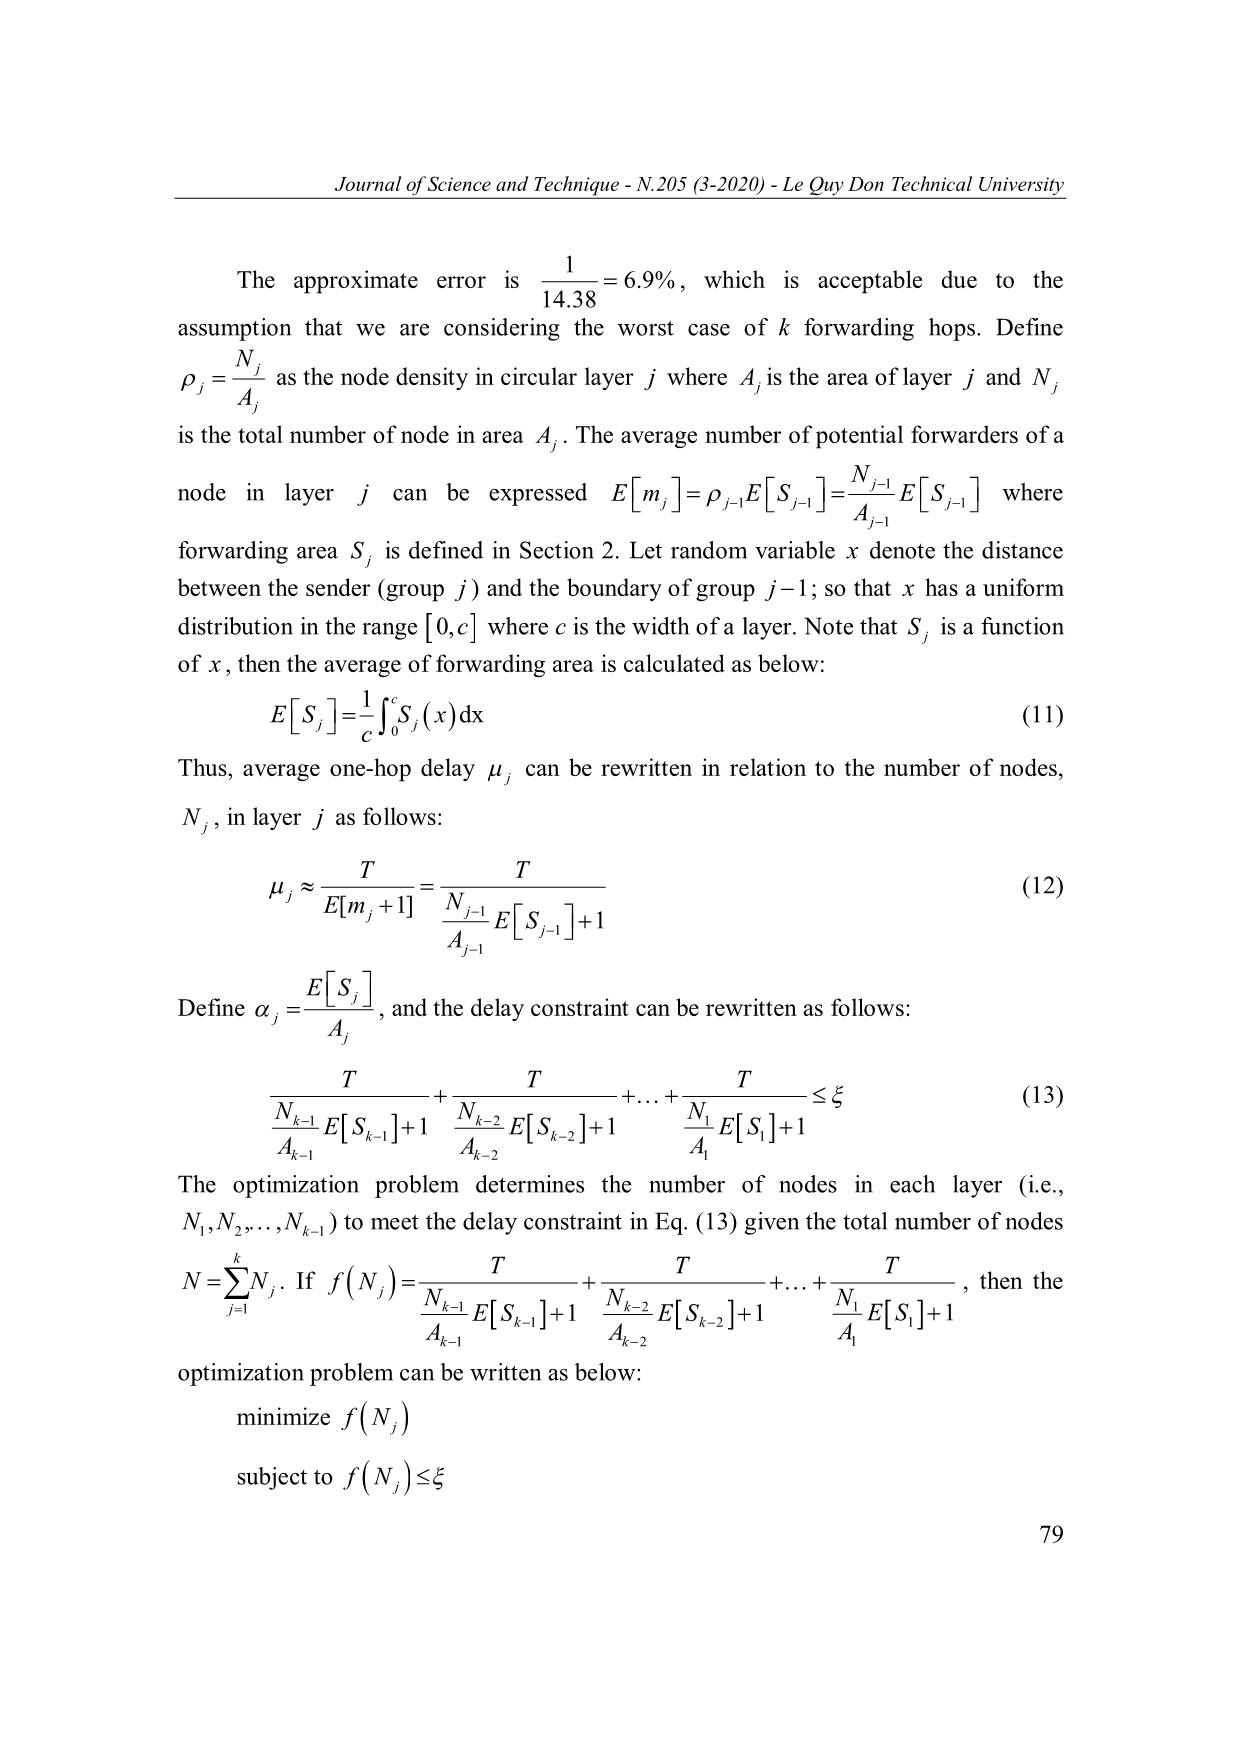
The approximate error is 6.9% , which is acceptable due to the
14.38
assumption that we are considering the worst case of k forwarding hops. Define
N j
j as the node density in circular layer j where Aj is the area of layer j and N j
Aj
is the total number of node in area Aj . The average number of potential forwarders of a
N
node in layer j can be expressed j 1 where
E mj j 1 E S j 1 E S j 1
Aj 1
forwarding area S j is defined in Section 2. Let random variable x denote the distance
between the sender (group j ) and the boundary of group j 1; so that x has a uniform
distribution in the range 0,c where c is the width of a layer. Note that S j is a function
of x , then the average of forwarding area is calculated as below:
1 c
E S S x dx (11)
j c 0 j
Thus, average one-hop delay j can be rewritten in relation to the number of nodes,
N j , in layer j as follows:
TT
(12)
j E[ m 1] N
j j 1
ES j 1 1
Aj 1
ES j
Define j , and the delay constraint can be rewritten as follows:
Aj
TTT
(13)
NNNk 1 k 2 1
ESES k 1 1 k 2 1 ES 1 1
AAk 1 k 2 A1
The optimization problem determines the number of nodes in each layer (i.e.,
NNN1, 2 , , k 1 ) to meet the delay constraint in Eq. (13) given the total number of nodes
k TTT
NN j . If f N j , then the
j 1 NNNk 1 k 2 1
ESES k 1 1 k 2 1 ES 1 1
AAk 1 k 2 A1
optimization problem can be written as below:
minimize f N j
subject to f N j
79
Journal of Science and Technique - N.205 (3-2020) - Le Quy Don Technical University
k
NNj
j 1
In order to determine the number of nodes in each layer, we consider a brute-force
algorithm which tries all possible cases of N j . Then, the proposed algorithm outputs
the case with the smallest average E2E packet delay.
4. Numerical Results
In this section, we compare EBND with other schemes that also aim at
maximizing network lifetime or balancing energy consumption. For example, Olariu's
scheme [5] adjusts the transmission range, and Wu's scheme [4] proposed a
deterministic non-uniform node deployment strategy. According to numerical results,
both schemes require a large number of nodes, which is costly.
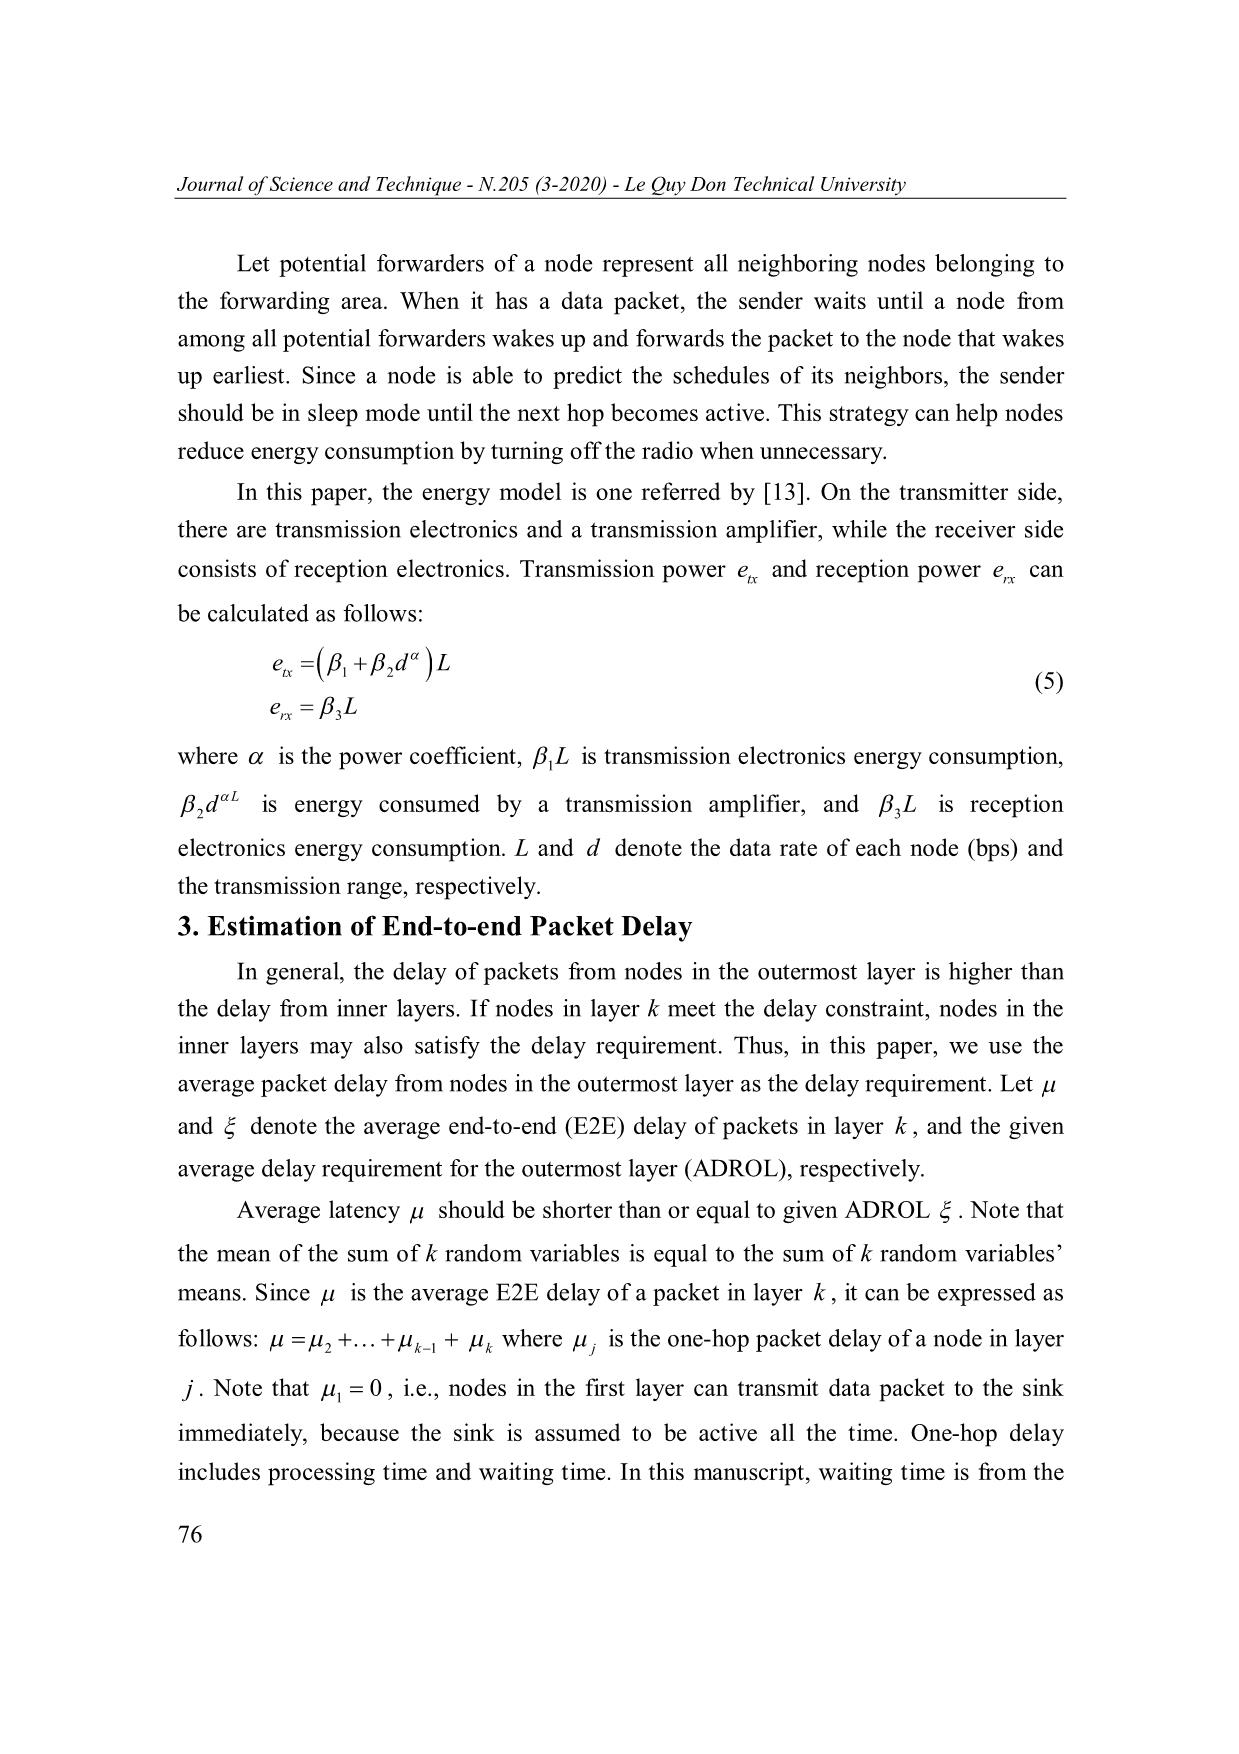
The communication energy parameters 1, 2 , 3 are referred to as follows [13]:
J
JJ
50 10 9 , 10 10 12bit , 50 10 9 . Let N and a denote the total
1bit 2 m2 3 bit
number of nodes in the network, and the number of packets generated by each node
during the simulation period, respectively; t p and tsim are defined as packet
transmission time, and simulation time, respectively; is defined as duty cycling rate;
and ptx, p rx and psleep are power consumption for transmission of one data packet,
reception of one data packet, and sleep mode, respectively. Let ntx and nrx denote the
total number of packet transmissions and receptions, respectively, when each node
generates only one packet. Then, ntx and nrx can be calculated based on the number of
k k
nodes, Ni , in layer i as follows: ntx iN i and nrx i 1 N i
i 1 i 1
The total energy consumption in the network can be estimated as follows:
Eatnpnp 1 tNp tNatnnP
p txtx rxrx sim sleep sim p tx rx idle
where at p n tx p tx n rx p rx is transmission and reception energy, 1 tsim Np sleep is
energy consumption in sleep mode, and tsim N at p n tx n rx P idle is energy
consumption in idle mode.
80
Journal of Science and Technique - N.205 (3-2020) - Le Quy Don Technical University
In this section, Matlab was used to validate the proposed algorithm and compare it
with other strategies. First, we present a network performance comparison of EBND and
Olariu's scheme. Then, a comparison with Wu's scheme is made.
4.1. Comparison of EBND and Olariu's Scheme
In Olariu's scheme [5], the transmission range of a node in layer i is the same as
the width of layer i . In order to achieve balanced energy consumption, the authors
derive the transmission range of nodes in each layer according to given network
parameters. However, the obtained transmission radius of nodes in inner layers is much
smaller than the maximum transmission radius, which reduces network connectivity. To
avoid the connectivity issue, Olariu's scheme requires a large number of nodes.
The number of nodes needed for network connectivity and total energy
consumption are selected as performance metrics. The area radius is set to 225 m, and
the maximum transmission range is 55 m. The number of layers is varied from 3 to 9.
Then, Olariu's scheme obtains the transmission ranges of nodes from the innermost
layer to the outermost, which are {8.19, 15.95, 20.95, 25.15, 29.22, 34.69, 40.50, 49.98}
meters.
Note that while selecting c value ( 0 c R ), there is a tradeoff between the hop
count and the number of forwarding nodes. More specifically, a small c value leads to
an increase in the hop count, which results in higher communication overhead. In
contrast, a high c value can reduce the hop count; however, the forwarding area S j
becomes smaller, which means fewer forwarding nodes can be found. Therefore, we
initially set c 0.5 R to balance between the hop count and the number of forwarding
nodes. The effects of c selection on network performance (e.g., packet latency, energy
consumption) should be considered intensively in the future work.
The difference between EBND and Olariu's is that instead of using a uniformly
random node deployment in the whole area, EBND determines number of nodes Ni in
each layer, then deploys Ni nodes in layer i randomly with a uniform distribution.
Moreover, in EBND, the maximum transmission range is used for all nodes, whereas
the transmission range of nodes increases from the innermost layer to the outermost in
Olariu's scheme.
81
Journal of Science and Technique - N.205 (3-2020) - Le Quy Don Technical University
Fig. 2. Comparison with Olariu's and Wu’s schemes:
(a) The total number of nodes; (b) Total energy consumption.
As shown in Fig. 2a, to satisfy the desired network connectivity, the Olariu's
scheme requires a much larger number of nodes than EBND. This is attributed to the
fact that the obtained transmission range set in Olariu's scheme is much lower than the
maximum transmission range. For example, nodes in the innermost layer can only
transmit a signal up to 8.19 m, while the maximum radio range is 55 m, i.e., the
2
8.19
connectivity range is reduced 44.89 times compared to nodes that use the
55
maximum transmission range. Total energy consumption of Olariu's scheme, as shown
in Fig. 1(b), is also much higher than that of EBND. Thus, Olariu's scheme is not
practical in a large network.
4.2. Comparison of EBND and Wu's Scheme
Wu et al. [4] proposed a non-uniform node distribution strategy in order to
achieve sub-balanced energy consumption between nodes. The area is divided into a
82
Journal of Science and Technique - N.205 (3-2020) - Le Quy Don Technical University
number of concentric layers and nodes have the same transmission range. They proved
that sub-balanced energy consumption can be achieved if the number of nodes from the
outermost layer increases with the geometric rule.
As shown in Fig. 2, with a small number of layers, the required number of nodes
in Fig. 2a and total energy consumption in Fig. 2b for EBND are slightly higher than in
Wu's scheme. This result is attributed to the fact that Wu's scheme uses a deterministic
deployment strategy and the number of nodes in layers increases from the outermost
layer to the innermost with a common ratio. Thus, when the number of layers increases,
the total number of nodes and total energy consumption increase exponentially.
5. Conclusions
This paper introduced a node deployment algorithm for delay-constrained
applications in duty-cycled WSNs. We determined number of nodes in each layer using a
brute-force search method given the total number of nodes. We conducted a simulation
using Matlab and experimental results show that EBND required fewer sensor nodes and
less energy consumption than other two node deployment strategies considered.
Acknowledgment
This research is funded by the Technology Science Program of the Ministry of
Defense in Vietnam, code: KC.BM (name of the project: “Design and Manufacturing a
Dynamite and Explosive Objects Detection Machine”) and the Le Quy Don Technical
University.
References
1. Luigi, L. Antonio and M. Giacomo (2010). The Internet of Things: A survey. Computer
Networks, 54(15), pp. 2787-2805.
2. M. El-hajj, A. Fadlallah, M. Chamoun and A. Serhrouchni (2019). A Survey of Internet of
Things (IoT) Authentication Schemes. Sensors, 19(5).
3. A. Fayez, H. Mohammad and A. Abdelrahman (2015). A Survey on MAC Protocols for
Duty-cycled Wireless Sensor Networks. Procedia Computer Science, 73, pp. 482-489.
4. G. C. I. S. a. S. D. X. Wu (2011). Avoiding energy holes in wireless sensor networks with
nonuniform node distribution. IEEE Transactions on Parallel and Distributed Systems, 19,
pp. 1297-1311.
5. O. Stephan and S. Ivan (2006). Design guidelines for maximizing lifetime and avoiding
energy holes in sensor networks with uniform distribution and uniform reporting. in IEEE
INFOCOM.
6. A. Fariba and N. Jafari (2017). Deployment Strategies in the Wireless Sensor Networks:
Systematic Literature Review, Classification, and Current Trends. Wireless Personal
Communications, 95(2), pp. 819-846.
83
Journal of Science and Technique - N.205 (3-2020) - Le Quy Don Technical University
7. P. Vipin, Y. Anju, K. Vinay and Y. P. Yadav (2018). Magnetic Field Line-Based Node
Deployment Strategy for Wireless Sensor Networks. in Optical and Wireless Technologies,
Spinger, pp. 667-673.
8. K. S. Umadevi, V. Shah and U. Desai (2018). Node Deployment Using Virtual Force with
Particle Swarm Optimization in WSN. Advanced Science Letters.
9. X. Liu (2006). Coverage with Connectivity in Wireless Sensor Networks. in 3rd
International Conference on Broadband Communications, Networks and Systems.
10. A. Liu, X. Jin, G. Cui and Z. Chen (2013). Deployment Guidelines for Achieving Maximum
Lifetime and Avoiding Energy Holes in Sensor Network. Information Sciences, 230,
pp. 197-226.
11. F. Barsi, A. A. Bertossi, F. B. Sorbelli, R. Ciotti, S. Olariu and M. C. Pinotti (2009).
Asynchronous Corona Training Protocols in Wireless Sensor and Actor Networks. IEEE
Transactions on Parallel and Distributed Systems, 20, pp. 1216-1230.
12. T. Dao, S. Yoon and J. Kim (2016). A deadline-aware scheduling and forwarding scheme in
wireless sensor networks. Sensors, p. 59.
13. W. Heinzelman, A. Chandrakasan and H. Balakrishnan (2002). An application-specific
protocol architecture for wireless microsensor networks. IEEE Transactions on Wireless
Communications, 1(4), pp. 660-670.
TÍNH TOÁN MẬT ĐỘ NÚT MẠNG ĐỂ ĐÁP ỨNG ĐỘ TRỄ TRUNG BÌNH
TRONG MẠNG CẢM BIẾN KHÔNG DÂY LÀM VIỆC THEO CHU KÌ
Tóm tắt: Các ứng dụng trong Internet kết nối vạn vật (IoT) yêu cầu dữ liệu thu thập
phải được truyền tới người quản trị trong một khoảng thời gian trễ giới hạn. Để tiết kiệm
nặng lượng hay kéo dài thời gian làm việc của mạng, kỹ thuật duty cycle được sử dụng, ở đó
các cảm biến bật và tắt mạch thu phát theo chu kì. Trong mạng làm việc theo chu kì, độ trễ
gói tin bị ảnh hưởng lớn bởi việc phân bổ nút mạng, do đó chúng tôi xác định mật độ nút
mạng trong một mạng cảm biến không dây nhằm bảo đảm độ trễ đầu cuối trung bình với các
tham số cho trước sử dụng lý thuyết xác suất thống kê. Kết quả mô phỏng cho thấy phương
pháp phân bổ nút mạng đề xuất tiêu hao ít năng lượng hơn trong khi yêu cầu số lượng nút
cảm biến ít hơn các phương pháp hiện có.
Từ khóa: Tiêu hao năng lượng; kỹ thuật định tuyến; yêu cầu về độ trễ; mạng cảm biến
không dây.
Received: 20/12/2019; Revised: 03/4/2020; Accepted for publication: 06/4/2020
84 File đính kèm:
 determining_node_density_to_guarantee_average_latency_in_dut.pdf

