Determination of in situ detection efficiency for IM-NAA of non-standard geometrical samples
The k0-based internal mono-standard (IM) method was first proposed for the concentration
analysis of samples of non-standard geometry in the 2000s. The method has demonstrated several
advantages such as the elimination of gamma-ray self-attenuation and geometrical effects. On the
other hand, the accuracy of the method principally depends on the in situ relative detection efficiency,
which requires to be obtained in each measurement. Therefore, the relative detection efficiency is
always under consideration for the improvement of the analysis results. The present paper describes a
simple and automatic procedure for the determination of the relative efficiency using one or more
activation products emitting gamma rays over a considered range of the spectrum. The procedure can
be applied for INAA and PGNAA analysis.
Trang 1
Trang 2
Trang 3
Trang 4
Trang 5
Trang 6
Trang 7
Tóm tắt nội dung tài liệu: Determination of in situ detection efficiency for IM-NAA of non-standard geometrical samples
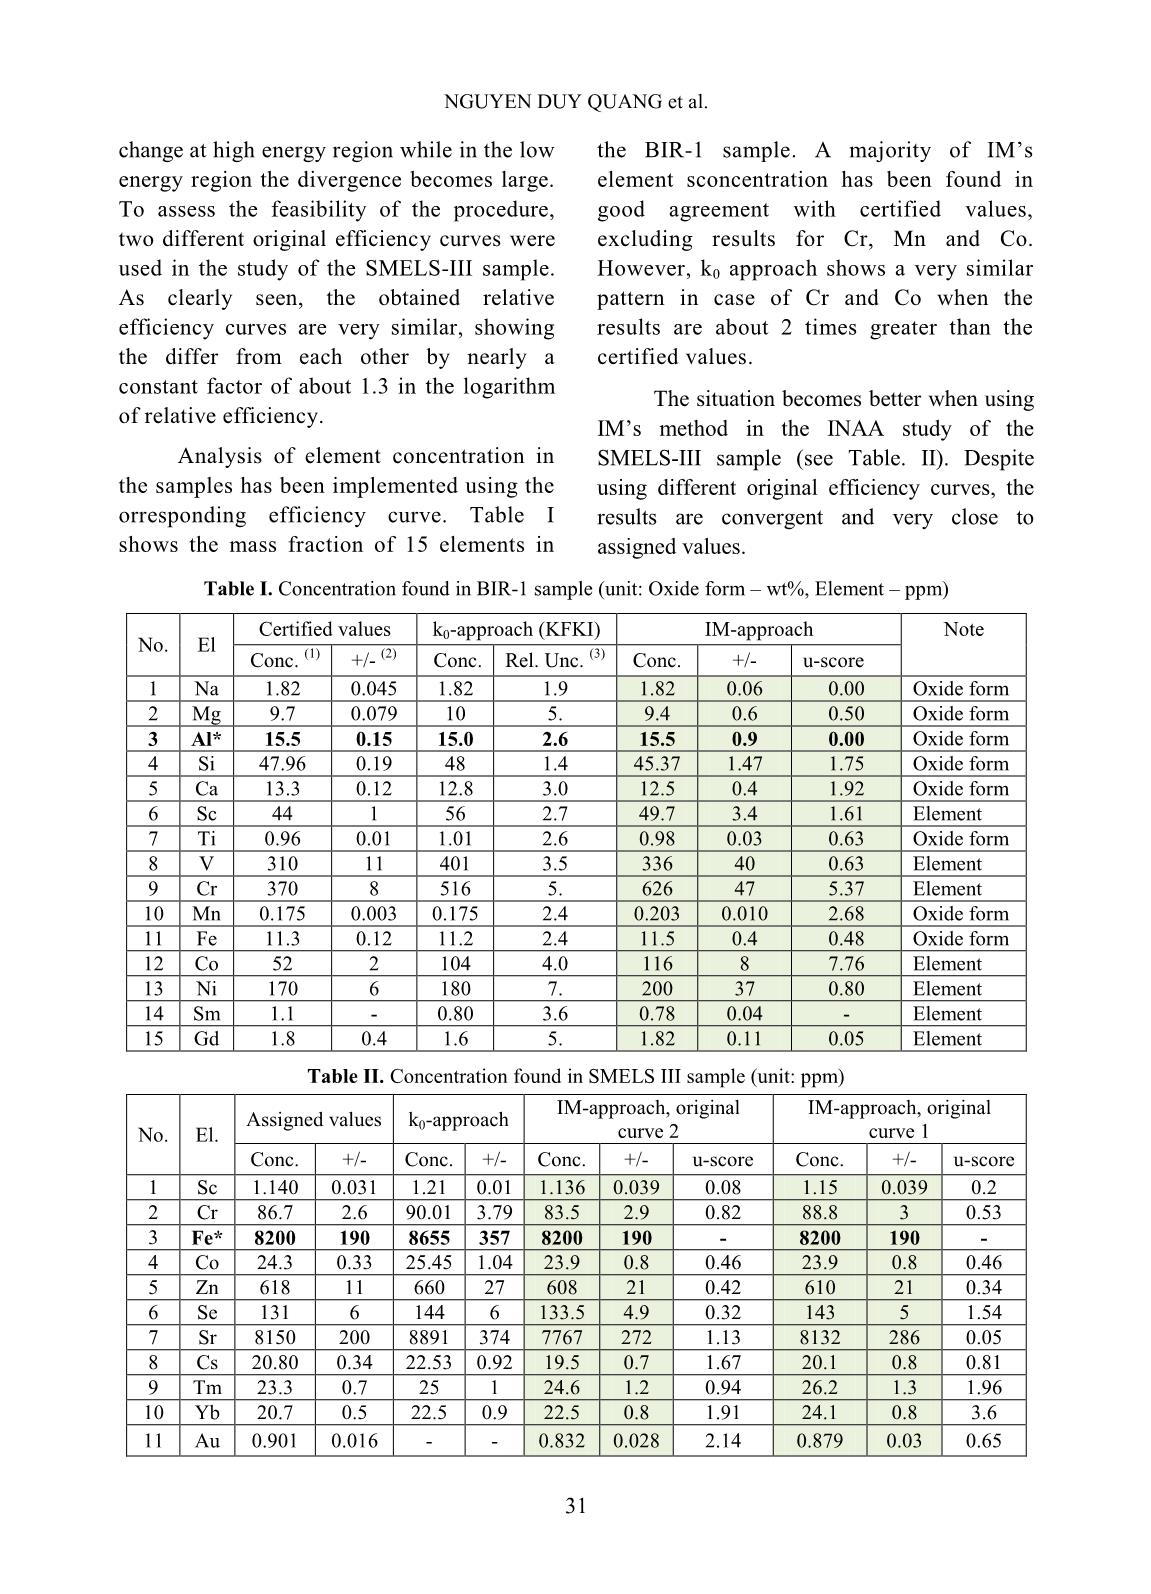
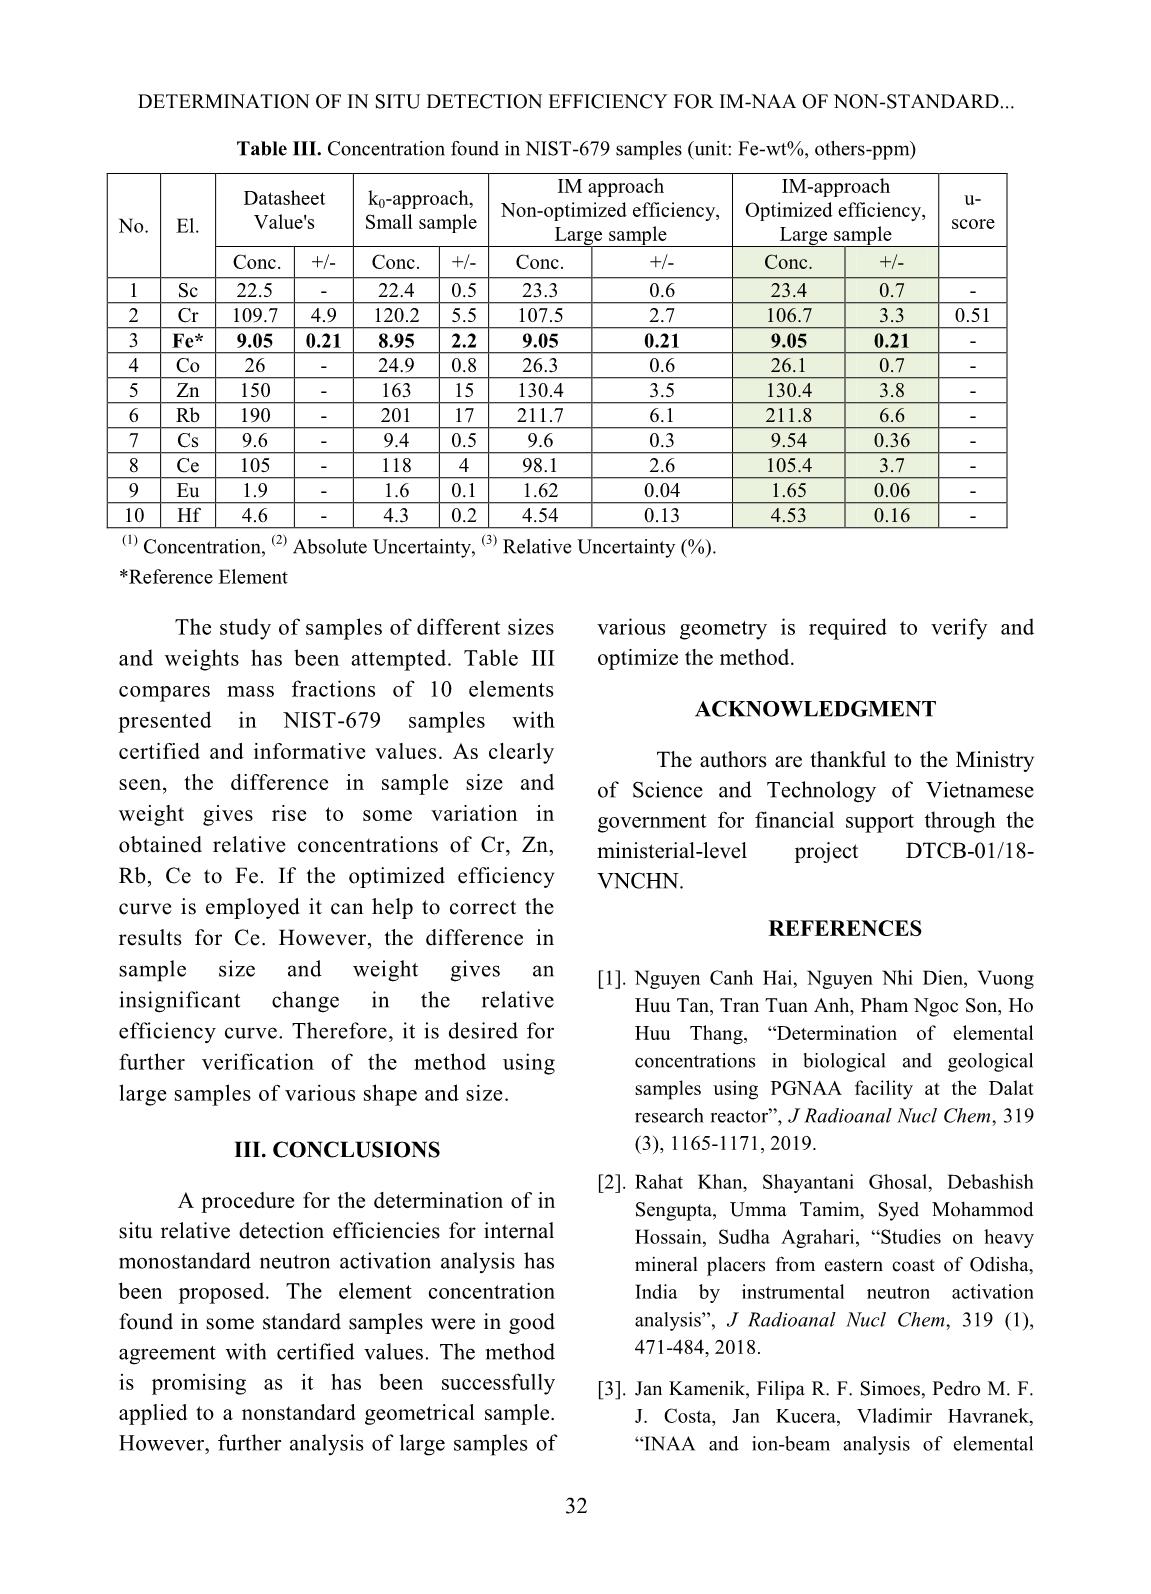
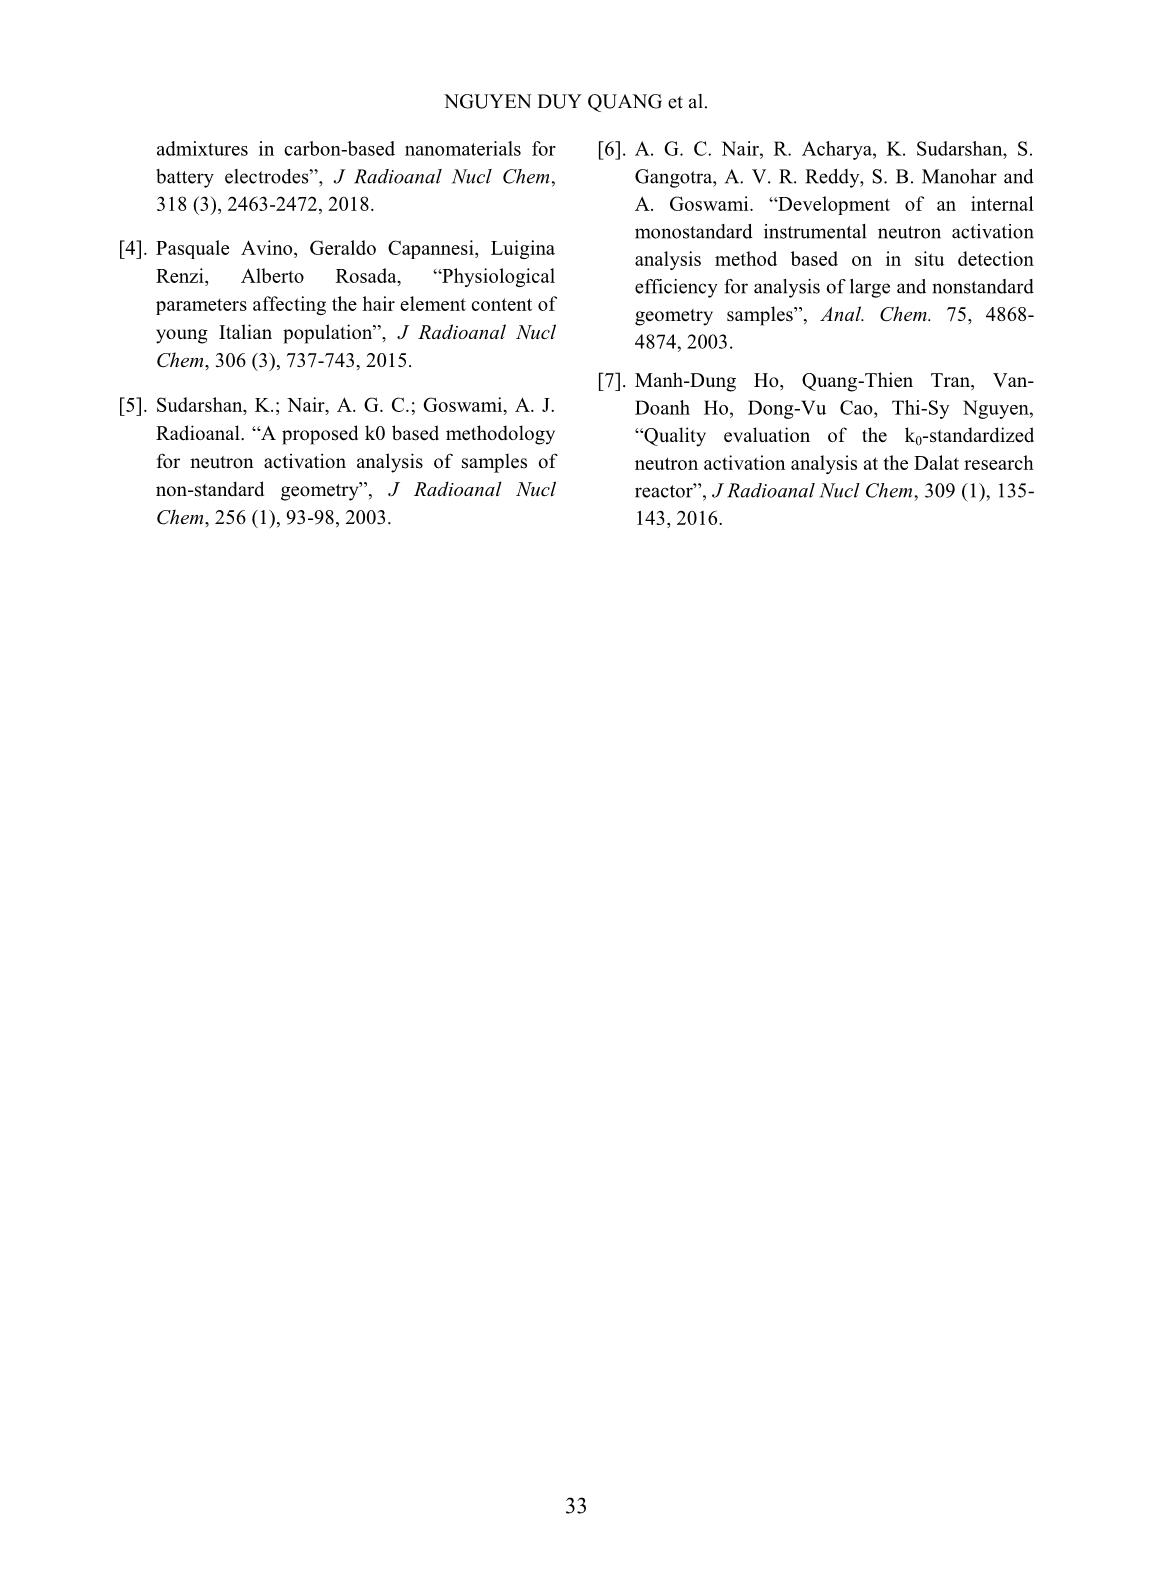
ncy plays a key role in the analysis as it is valuable to the correction of sample geometry effects [6]. In this study, a computer code for the determination of the in situ relative efficiency has been developed. Using Prompt Gamma NAA (PGNAA) and Instrumental NAA (INAA) nuclear data, the software requires only a peak area report file for calculation of relative efficiency and perform further analysis. Results from measurements of standard reference materials have been found to be in good agreement with certified values. II. CONTENT A. Subjects and methods In INAA using k0 approach, consider two arbitrary elements x and y presented in an activated sample which emits two series of DETERMINATION OF IN SITU DETECTION EFFICIENCY FOR IM-NAA OF NON-STANDARD... 28 characteristic gamma rays Ex,i and Ey,j (i, j = 1, 2,...), respectively. The mass ratio of element x to y can be expressed as follow [5]: , , , , , , 0,0 0 0, ( ( ( ))) ( ( ( ))) x i y j y j y j x i x i E E Eyx y x E E E P kSDC f Qm m SDC f Q P k (1) Where S is the saturation factor, D is the decay factor, C is the measurement factor, f is the ratio of the thermal to epithermal neutron fluxes, Q0( ) is the ratio of the resonance integral-to-thermal neutron cross-section corrected for the non-ideal epithermal neutron flux distribution (α), P is the peak area and ε is the full energy peak detection efficiency. In case of high f, the value of 0 0( ( ))) / ( ( )))y xf Q f Q in eq. (1) tends to unity and therefore, eq. (1) can be simplified as: , , , , , , 0, 0, ( ) ( ) x i y j y j y j x i x i E E Eyx y x E E E P kSDCm m SDC P k (2) The situation is very simple in case of PGNAA where the correction factors S, D and C can be eliminated. Though, it should be noted that the k0 databases for two different techniques are different. Having it in mind, the mass ratio in both INAA and PGNAA can be rewritten as: ,, , , y jx i y j x i EEx y E E cm m c (3) Where c is the coefficient calculated using k0 database and experimental data , , ,0 0, ( ) ( ( ))) x i x i x i E E x x E P c SDC f Q k (4) and in some cases can be simplified as , , ,0, ( ) x i x i x i E E x E P c SDC k (5) As clearly seen in eq. (3), the relative concentration of element x to y can be determined by the ratio of full peak detection efficiencies. This leads to the need for using relative detection efficiency which can be determined straightforwardly from eq. 3 using a fitting procedure. The relation of detection efficiencies is as follow: , , , , x i y j x i y j E x E E E y c m c m (6) Hence, , , , , ln( ) ln ln ln( ) x i y j x i y j Ex E E y E cm m c (7) The efficiencies at different gamma energies of each element are derived from eq. (6) ,1 , ,1 , ln( ) ln ln( ), 2,3,... x x i x x i E E E E c i c (8) ,1 , ,1 , ln( ) ln ln( ), 2,3,... y y j y y j E E E E c j c (9) Thus, relative efficiency curves in logarithmic scale constructed individually from each element are expected to be differed by constant factors, say t. Because of using relative efficiency, an arbitrary positive value can be firstly assigned to one detection efficiency of each element, e.g. ,1 Arb 10% kE for any k-th element where “Arb” indicates the first choice of detection efficiency. The relative detection efficiencies are then corrected by t-factors: , , ln(Rel ) ln(Arb ) k i k iE E k t (10) In general, the expression for the relative efficiency curve is 0 ln(Rel ( )) (ln ) n i i i E a E (11) NGUYEN DUY QUANG et al. 29 Where ai is the coefficient and n is the order of the polynomial that can be chosen depending on the energy range of interest. After the relative efficiency calibration curve (11) is constructed, the relative concentrations can be calculated from eq. (3) and converted to absolute concentration using a well-know mass fraction of an element presented in the sample. If the concentration of m elements are required to be analysed there will be m+n+1 parameters needed to be optimized in fitting procedure, including ai, i=0,1,..n and tk, k=1,2,...m. The iteration loop for determination of all mentioned parameters is presented in Fig. 1. The loop starts with a reference efficiency curve which is then used for the correction of experimental relative detection efficiency at different energies of all elements, i.e. calculation of all characteristic factors t in eq. 10 (see Fig. 2). In the next step, least-square fitting is performed to construct a new efficiency curve. The Goodness Of Fit (GOF) in the fitting step is used for stop condition. The loop is forced to stop whenever the GOF starts to increase. On the other hand, it will stop if the number of the loop is large enough and the GOF is almost saturated. A typical curve corresponding to the detector used for spectrum acquisition may be chosen as the original reference efficiency curve. It has been found that the employment of different original reference efficiency curves gives a very small divergence on final analysis results. Fig.1. Iteration for optimization of fitting parameters Fig. 2. Illustration of relative efficiency correction for iron by tFe-factor. (a) before correction, (b) after correction DETERMINATION OF IN SITU DETECTION EFFICIENCY FOR IM-NAA OF NON-STANDARD... 30 For evaluation of the method performance uscore test was implemented. uscore factor was calculated as follow: 2 2 x y x y score m m m m u (12) In this study, the limiting value for uscore has been set to 2.58 for a level of probability at 99% to determine if a result passes the evaluation. The uscore values less than 1.96 mean that the result probably does not differ significantly from the certified value while uscore less than 1.64 that means the result does not differ significantly from the certified value. B. Results and discussion In experiments, standard reference materials, BIR-1 and SMELS-III, were used for quality verification of the element concentration for PGNAA and INAA, respectively. BIR-1 sample had been irradiated and analyzed by KFKI lab using k0 approach. The acquired spectrum was re- used to construct a relative efficiency curve for internal monostandard analysis. In case of INAA, the SMELS III sample was sealed in a polyethylene bag and irradiated for 09 hours at the Rotary Rack channel of Dalat research reactor. The ratio f between thermal and epithermal neutron flux is 37.3 and epithermal neutron spectrum factor α is 0.073 [7]. The measurement was carried out for about ~18 hours after ~5 days of decay. To assess the feasibility of the method, analysis of large samples has been attempted. Two NIST-679 samples of different sizes and weights were prepared and irradiated. The small one (103.25mg) was analyzed by k0 approach while the large (1.365g) were studied by IM-method using both optimized and non-optimized efficiency curves. Gamma spectrum was acquired by an HPGe detector. The detector solution is 1.90 keV for 1332.5 keV ( 60 Co). Fig. 3. Construction of in situ relative efficiencies. (A) BIR-1 sample, original curve 1, (B1) SMELS-III sample, original curve 1, (B2) SMELS-III sample, original curve 2. In situ relative efficiency for each sample has been constructed using the mentioned fitting procedure. Fig. 3 indicates the improvement of efficiency curves before and after fitting steps. As for the BIR-1 sample, the efficiency curve demonstrates a small NGUYEN DUY QUANG et al. 31 change at high energy region while in the low energy region the divergence becomes large. To assess the feasibility of the procedure, two different original efficiency curves were used in the study of the SMELS-III sample. As clearly seen, the obtained relative efficiency curves are very similar, showing the differ from each other by nearly a constant factor of about 1.3 in the logarithm of relative efficiency. Analysis of element concentration in the samples has been implemented using the orresponding efficiency curve. Table I shows the mass fraction of 15 elements in the BIR-1 sample. A majority of IM’s element sconcentration has been found in good agreement with certified values, excluding results for Cr, Mn and Co. However, k0 approach shows a very similar pattern in case of Cr and Co when the results are about 2 times greater than the certified values. The situation becomes better when using IM’s method in the INAA study of the SMELS-III sample (see Table. II). Despite using different original efficiency curves, the results are convergent and very close to assigned values. Table I. Concentration found in BIR-1 sample (unit: Oxide form – wt%, Element – ppm) No. El Certified values k0-approach (KFKI) IM-approach Note Conc. (1) +/- (2) Conc. Rel. Unc. (3) Conc. +/- u-score 1 Na 1.82 0.045 1.82 1.9 1.82 0.06 0.00 Oxide form 2 Mg 9.7 0.079 10 5. 9.4 0.6 0.50 Oxide form 3 Al* 15.5 0.15 15.0 2.6 15.5 0.9 0.00 Oxide form 4 Si 47.96 0.19 48 1.4 45.37 1.47 1.75 Oxide form 5 Ca 13.3 0.12 12.8 3.0 12.5 0.4 1.92 Oxide form 6 Sc 44 1 56 2.7 49.7 3.4 1.61 Element 7 Ti 0.96 0.01 1.01 2.6 0.98 0.03 0.63 Oxide form 8 V 310 11 401 3.5 336 40 0.63 Element 9 Cr 370 8 516 5. 626 47 5.37 Element 10 Mn 0.175 0.003 0.175 2.4 0.203 0.010 2.68 Oxide form 11 Fe 11.3 0.12 11.2 2.4 11.5 0.4 0.48 Oxide form 12 Co 52 2 104 4.0 116 8 7.76 Element 13 Ni 170 6 180 7. 200 37 0.80 Element 14 Sm 1.1 - 0.80 3.6 0.78 0.04 - Element 15 Gd 1.8 0.4 1.6 5. 1.82 0.11 0.05 Element Table II. Concentration found in SMELS III sample (unit: ppm) No. El. Assigned values k0-approach IM-approach, original curve 2 IM-approach, original curve 1 Conc. +/- Conc. +/- Conc. +/- u-score Conc. +/- u-score 1 Sc 1.140 0.031 1.21 0.01 1.136 0.039 0.08 1.15 0.039 0.2 2 Cr 86.7 2.6 90.01 3.79 83.5 2.9 0.82 88.8 3 0.53 3 Fe* 8200 190 8655 357 8200 190 - 8200 190 - 4 Co 24.3 0.33 25.45 1.04 23.9 0.8 0.46 23.9 0.8 0.46 5 Zn 618 11 660 27 608 21 0.42 610 21 0.34 6 Se 131 6 144 6 133.5 4.9 0.32 143 5 1.54 7 Sr 8150 200 8891 374 7767 272 1.13 8132 286 0.05 8 Cs 20.80 0.34 22.53 0.92 19.5 0.7 1.67 20.1 0.8 0.81 9 Tm 23.3 0.7 25 1 24.6 1.2 0.94 26.2 1.3 1.96 10 Yb 20.7 0.5 22.5 0.9 22.5 0.8 1.91 24.1 0.8 3.6 11 Au 0.901 0.016 - - 0.832 0.028 2.14 0.879 0.03 0.65 DETERMINATION OF IN SITU DETECTION EFFICIENCY FOR IM-NAA OF NON-STANDARD... 32 Table III. Concentration found in NIST-679 samples (unit: Fe-wt%, others-ppm) No. El. Datasheet Value's k0-approach, Small sample IM approach Non-optimized efficiency, Large sample IM-approach Optimized efficiency, Large sample u- score Conc. +/- Conc. +/- Conc. +/- Conc. +/- 1 Sc 22.5 - 22.4 0.5 23.3 0.6 23.4 0.7 - 2 Cr 109.7 4.9 120.2 5.5 107.5 2.7 106.7 3.3 0.51 3 Fe* 9.05 0.21 8.95 2.2 9.05 0.21 9.05 0.21 - 4 Co 26 - 24.9 0.8 26.3 0.6 26.1 0.7 - 5 Zn 150 - 163 15 130.4 3.5 130.4 3.8 - 6 Rb 190 - 201 17 211.7 6.1 211.8 6.6 - 7 Cs 9.6 - 9.4 0.5 9.6 0.3 9.54 0.36 - 8 Ce 105 - 118 4 98.1 2.6 105.4 3.7 - 9 Eu 1.9 - 1.6 0.1 1.62 0.04 1.65 0.06 - 10 Hf 4.6 - 4.3 0.2 4.54 0.13 4.53 0.16 - (1) Concentration, (2) Absolute Uncertainty, (3) Relative Uncertainty (%). *Reference Element The study of samples of different sizes and weights has been attempted. Table III compares mass fractions of 10 elements presented in NIST-679 samples with certified and informative values. As clearly seen, the difference in sample size and weight gives rise to some variation in obtained relative concentrations of Cr, Zn, Rb, Ce to Fe. If the optimized efficiency curve is employed it can help to correct the results for Ce. However, the difference in sample size and weight gives an insignificant change in the relative efficiency curve. Therefore, it is desired for further verification of the method using large samples of various shape and size. III. CONCLUSIONS A procedure for the determination of in situ relative detection efficiencies for internal monostandard neutron activation analysis has been proposed. The element concentration found in some standard samples were in good agreement with certified values. The method is promising as it has been successfully applied to a nonstandard geometrical sample. However, further analysis of large samples of various geometry is required to verify and optimize the method. ACKNOWLEDGMENT The authors are thankful to the Ministry of Science and Technology of Vietnamese government for financial support through the ministerial-level project DTCB-01/18- VNCHN. REFERENCES [1]. Nguyen Canh Hai, Nguyen Nhi Dien, Vuong Huu Tan, Tran Tuan Anh, Pham Ngoc Son, Ho Huu Thang, “Determination of elemental concentrations in biological and geological samples using PGNAA facility at the Dalat research reactor”, J Radioanal Nucl Chem, 319 (3), 1165-1171, 2019. [2]. Rahat Khan, Shayantani Ghosal, Debashish Sengupta, Umma Tamim, Syed Mohammod Hossain, Sudha Agrahari, “Studies on heavy mineral placers from eastern coast of Odisha, India by instrumental neutron activation analysis”, J Radioanal Nucl Chem, 319 (1), 471-484, 2018. [3]. Jan Kamenik, Filipa R. F. Simoes, Pedro M. F. J. Costa, Jan Kucera, Vladimir Havranek, “INAA and ion-beam analysis of elemental NGUYEN DUY QUANG et al. 33 admixtures in carbon-based nanomaterials for battery electrodes”, J Radioanal Nucl Chem, 318 (3), 2463-2472, 2018. [4]. Pasquale Avino, Geraldo Capannesi, Luigina Renzi, Alberto Rosada, “Physiological parameters affecting the hair element content of young Italian population”, J Radioanal Nucl Chem, 306 (3), 737-743, 2015. [5]. Sudarshan, K.; Nair, A. G. C.; Goswami, A. J. Radioanal. “A proposed k0 based methodology for neutron activation analysis of samples of non-standard geometry”, J Radioanal Nucl Chem, 256 (1), 93-98, 2003. [6]. A. G. C. Nair, R. Acharya, K. Sudarshan, S. Gangotra, A. V. R. Reddy, S. B. Manohar and A. Goswami. “Development of an internal monostandard instrumental neutron activation analysis method based on in situ detection efficiency for analysis of large and nonstandard geometry samples”, Anal. Chem. 75, 4868- 4874, 2003. [7]. Manh-Dung Ho, Quang-Thien Tran, Van- Doanh Ho, Dong-Vu Cao, Thi-Sy Nguyen, “Quality evaluation of the k0-standardized neutron activation analysis at the Dalat research reactor”, J Radioanal Nucl Chem, 309 (1), 135- 143, 2016.
File đính kèm:
 determination_of_in_situ_detection_efficiency_for_im_naa_of.pdf

