Design of a FPGA-based controller for power and period measurement in the start range of Dalat Nuclear Research Reactor
This paper introduces a new controller module based on a high-speed field-programmable
gate array (FPGA) and digital signal processing (DSP) using moving average (MA) filters for
calculation of the reactor power and period at the start range of the Dalat nuclear research reactor
(DNRR). The reactor power is proportional to the neutron flux in the reactor core, and the reactor
period is the time that the reactor power changes by a factor of 2.718. In the control and protection
system (CPS) of the DNRR, the reactor power and period have been monitored by the 8-bit
microprocessor controller named BPM-107R. There are two main functions of the BPM-107R
controller including 1) measurement and determination of reactor power and period and 2) generation
of warning and emergency protection signals by reactor power or/and by reactor period. Those
discrete signals will access to the logical processing unit of the CPS to prohibit the upward movement
of control rods or to shut down the reactor. The CPS has three BPM-107R controllers corresponding
to three independent neutron flux measurement equipment (NFME) channels working by logic voting
“2 out-of 3”. Each NFME channel was designed for detection of neutron flux density in the full range
from 1×100 to 1.2×10¹⁰ n/cm2×s, which is divided into two sub-ranges named start range (SR) and
working range (WR). The designed FPGA-based controller module was tested using simulated signals
as well as signals from the CPS in comparison with the original controller BPM-107R. The
experimental results show that the characteristics and functions of the two controllers are equivalent.
Trang 1
Trang 2
Trang 3
Trang 4
Trang 5
Trang 6
Trang 7
Trang 8
Tóm tắt nội dung tài liệu: Design of a FPGA-based controller for power and period measurement in the start range of Dalat Nuclear Research Reactor
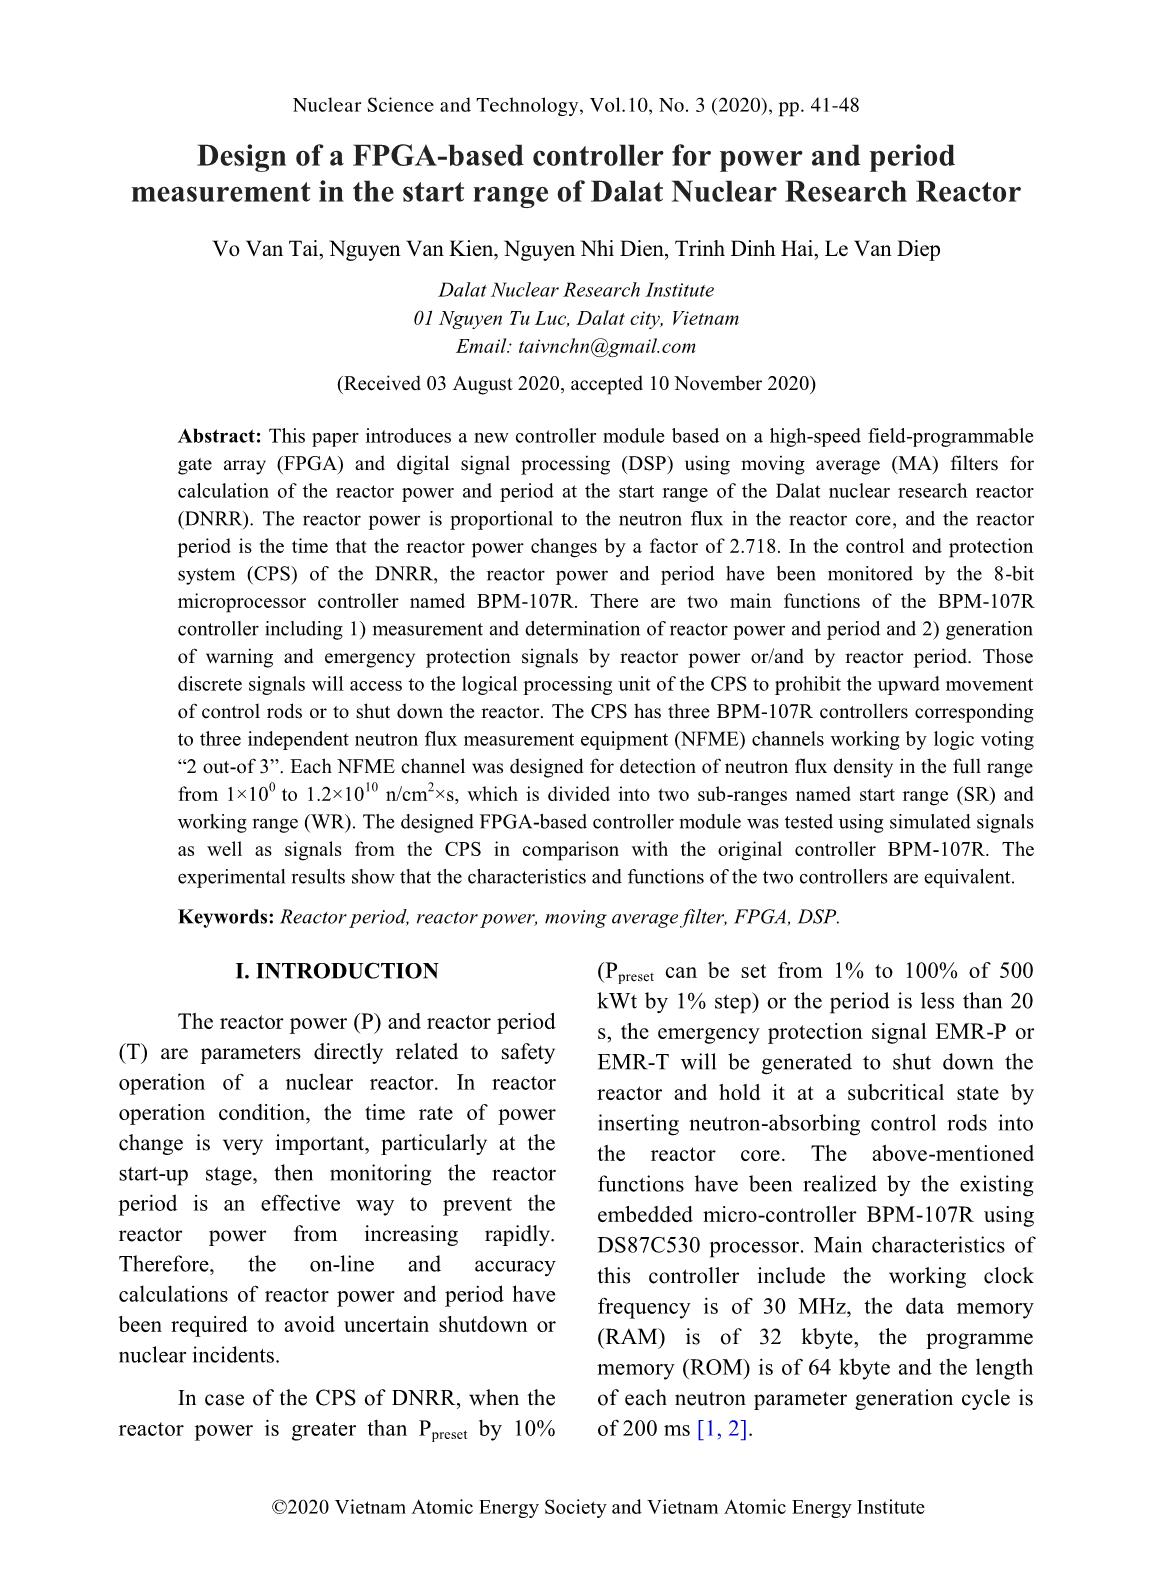
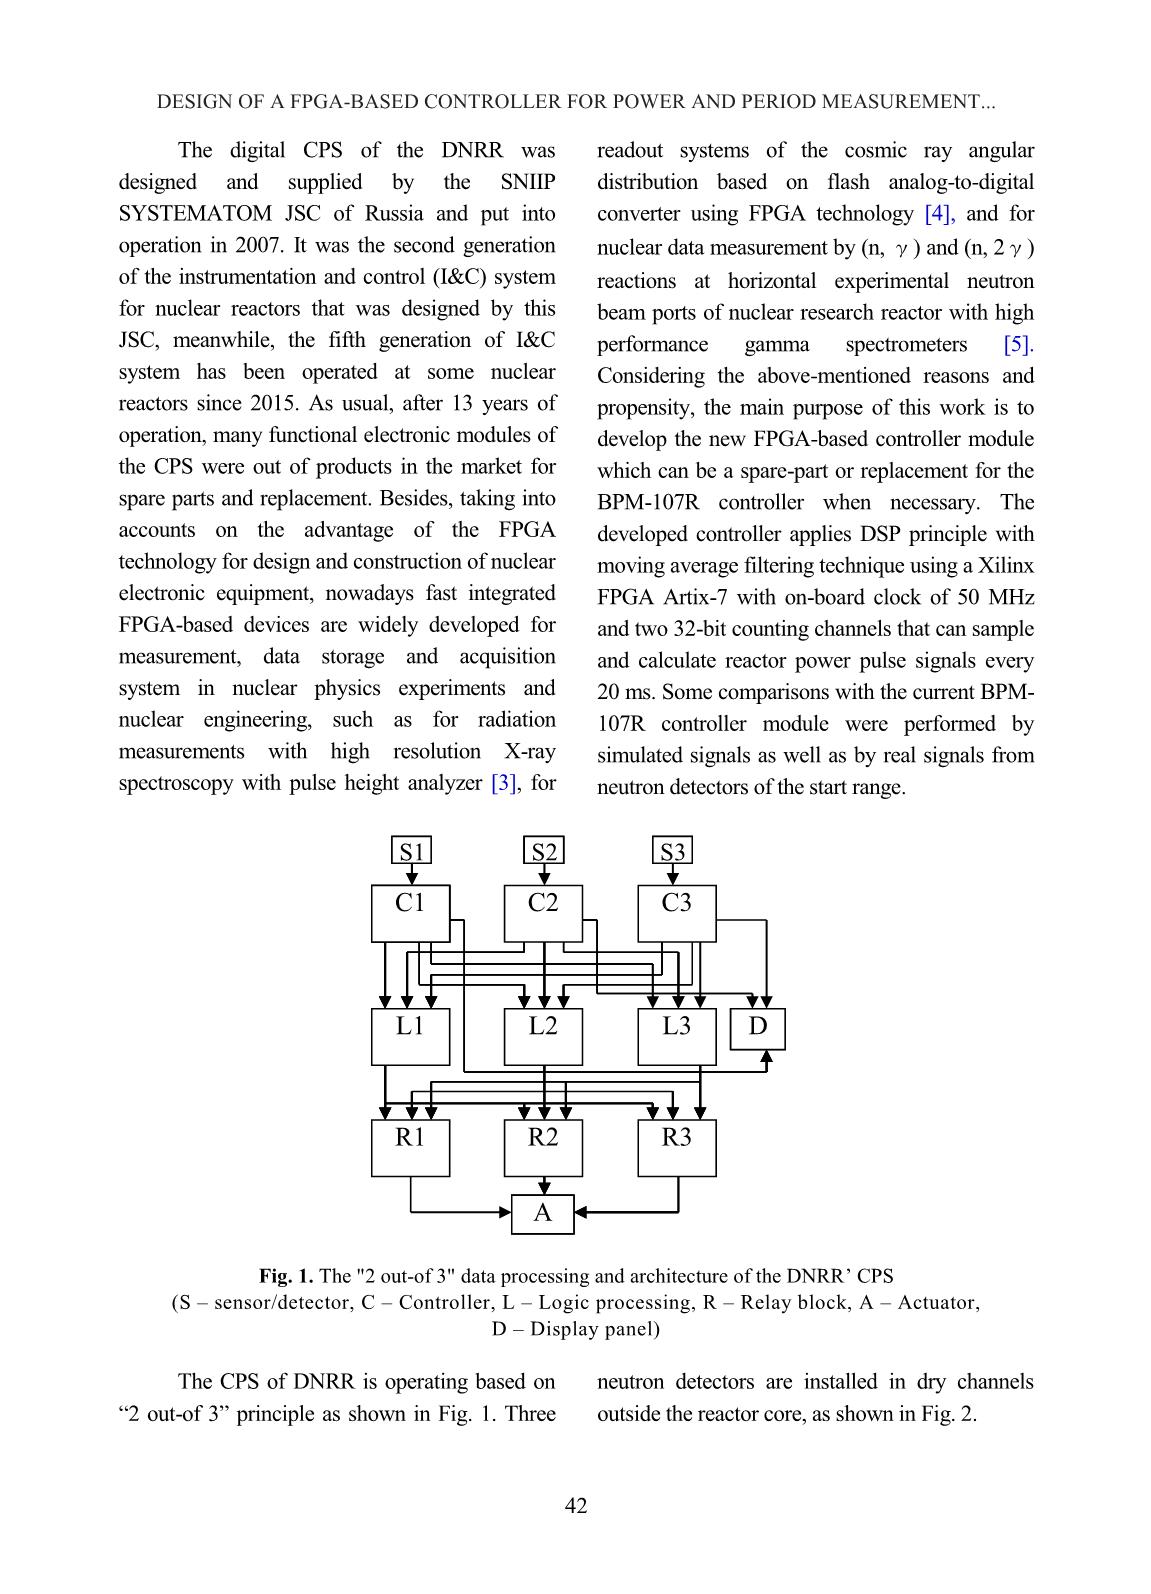
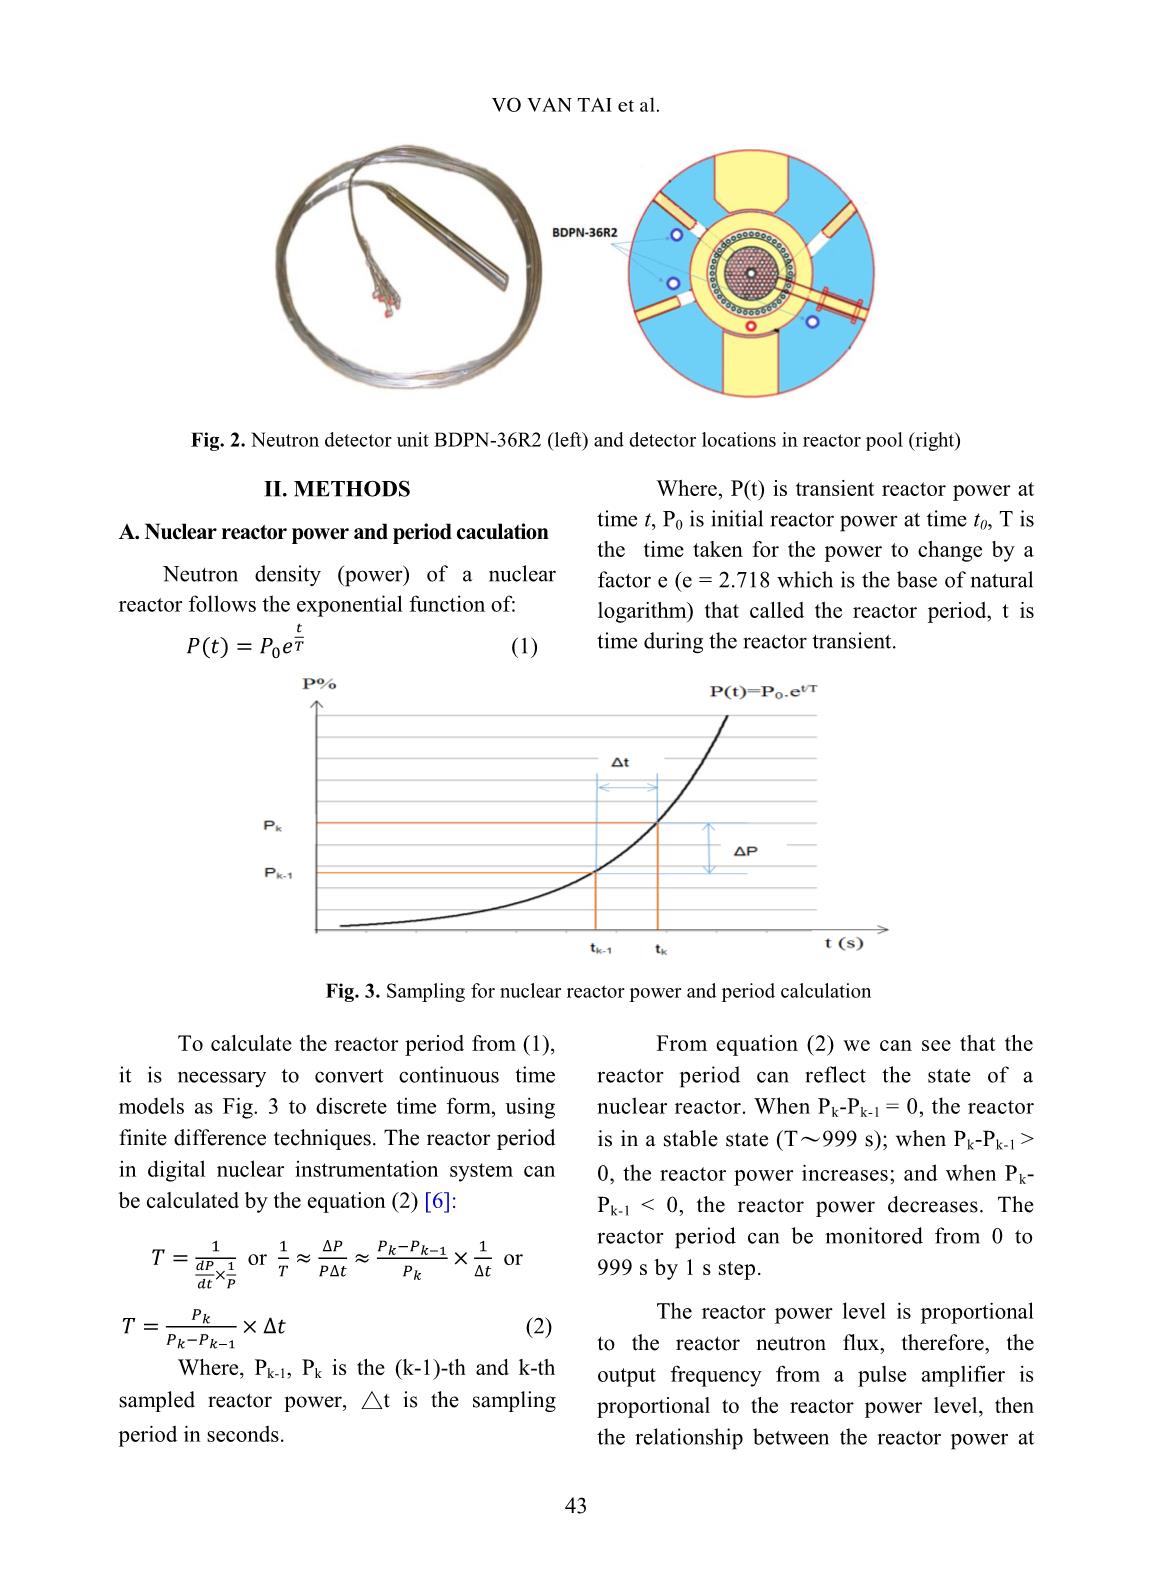
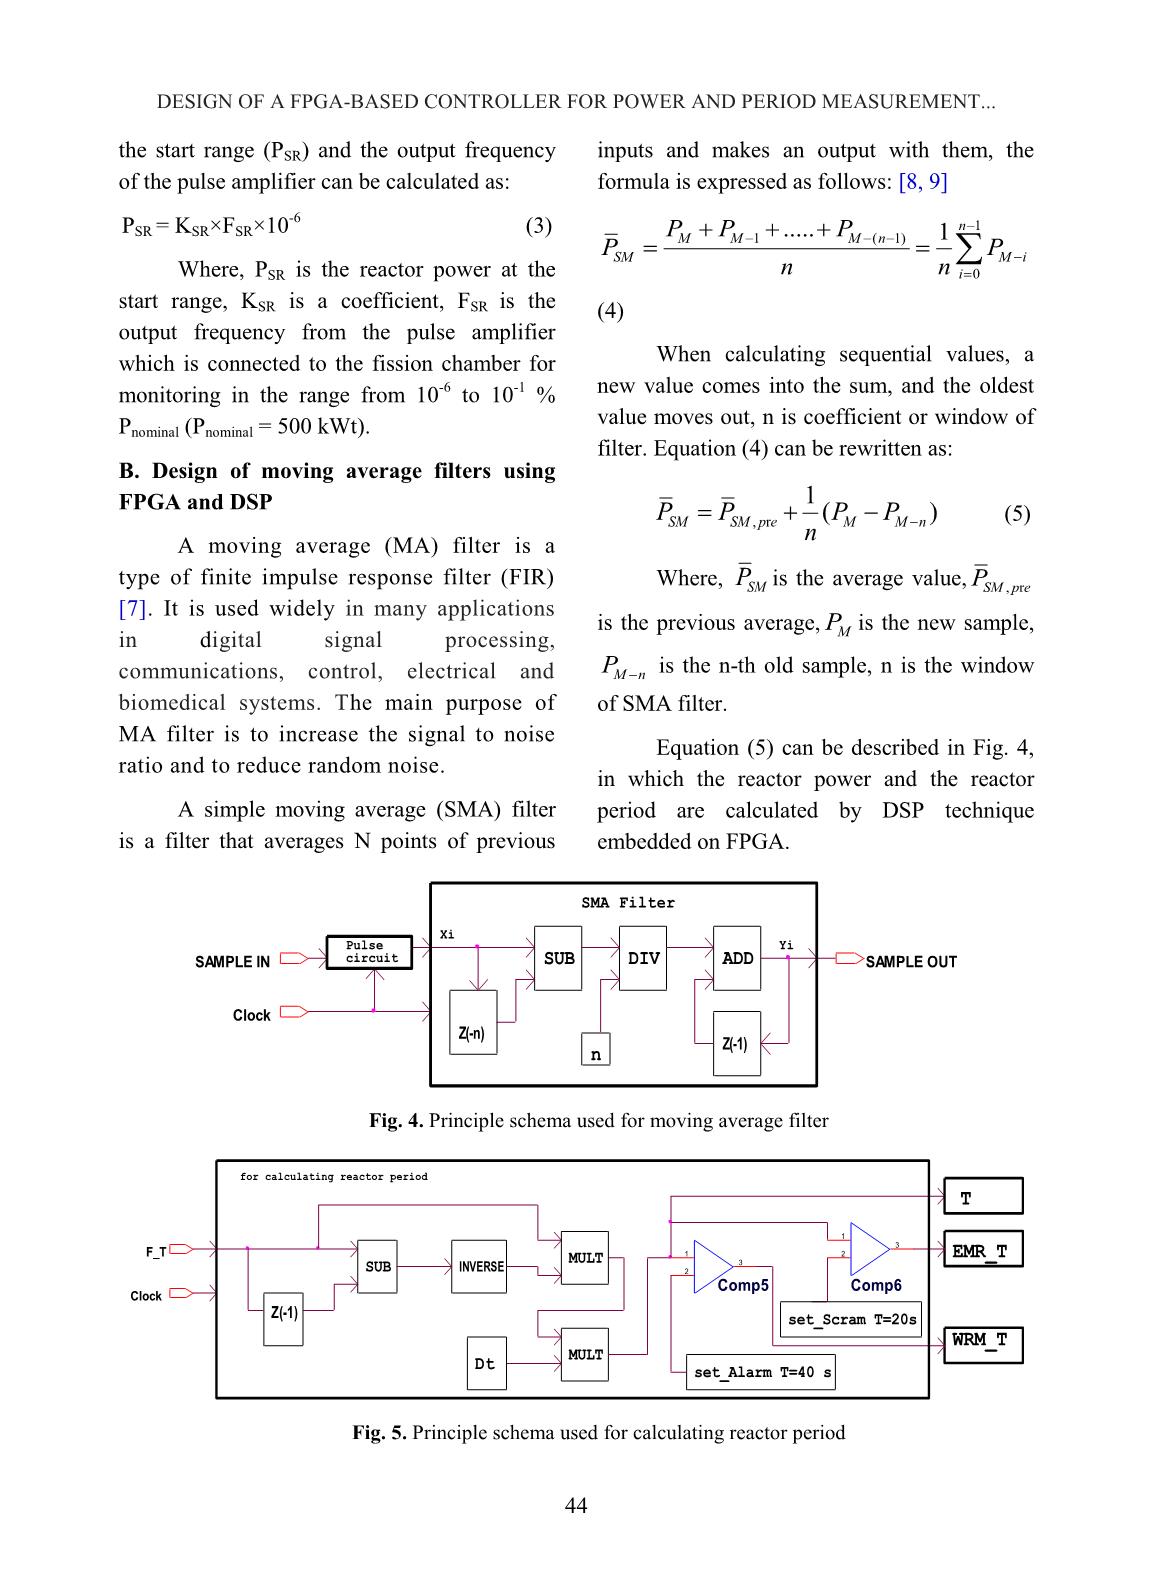
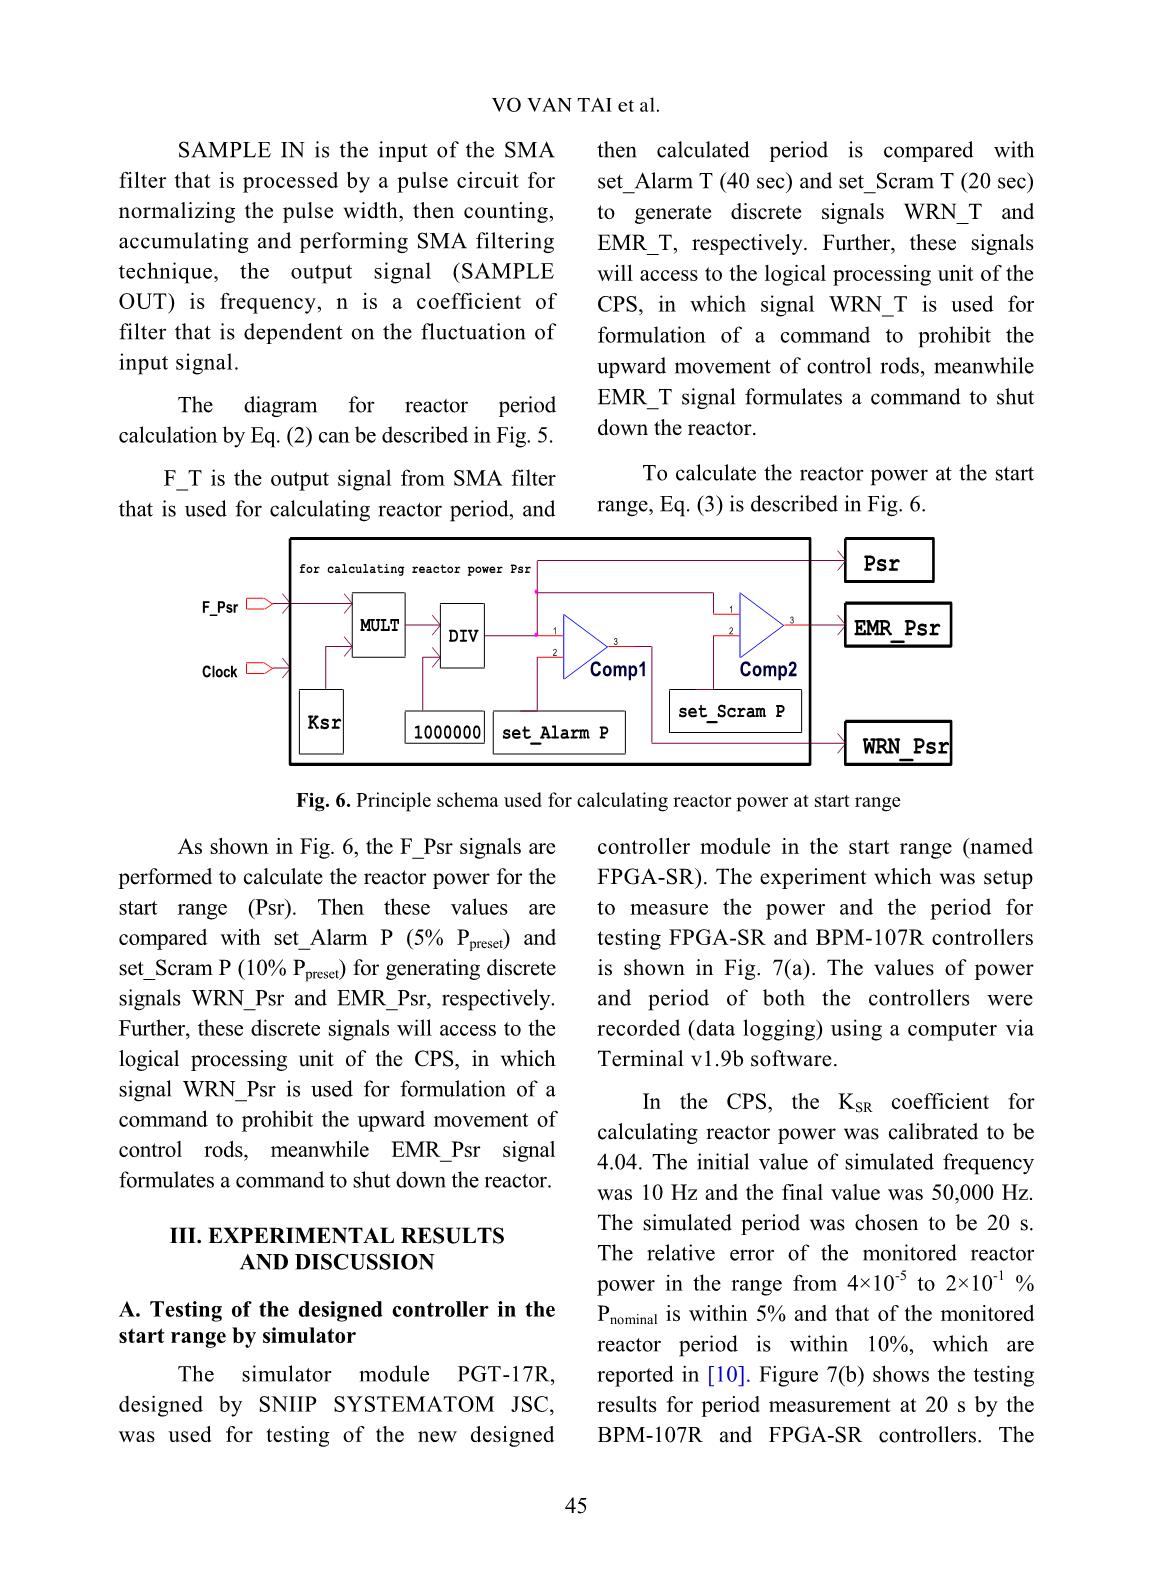
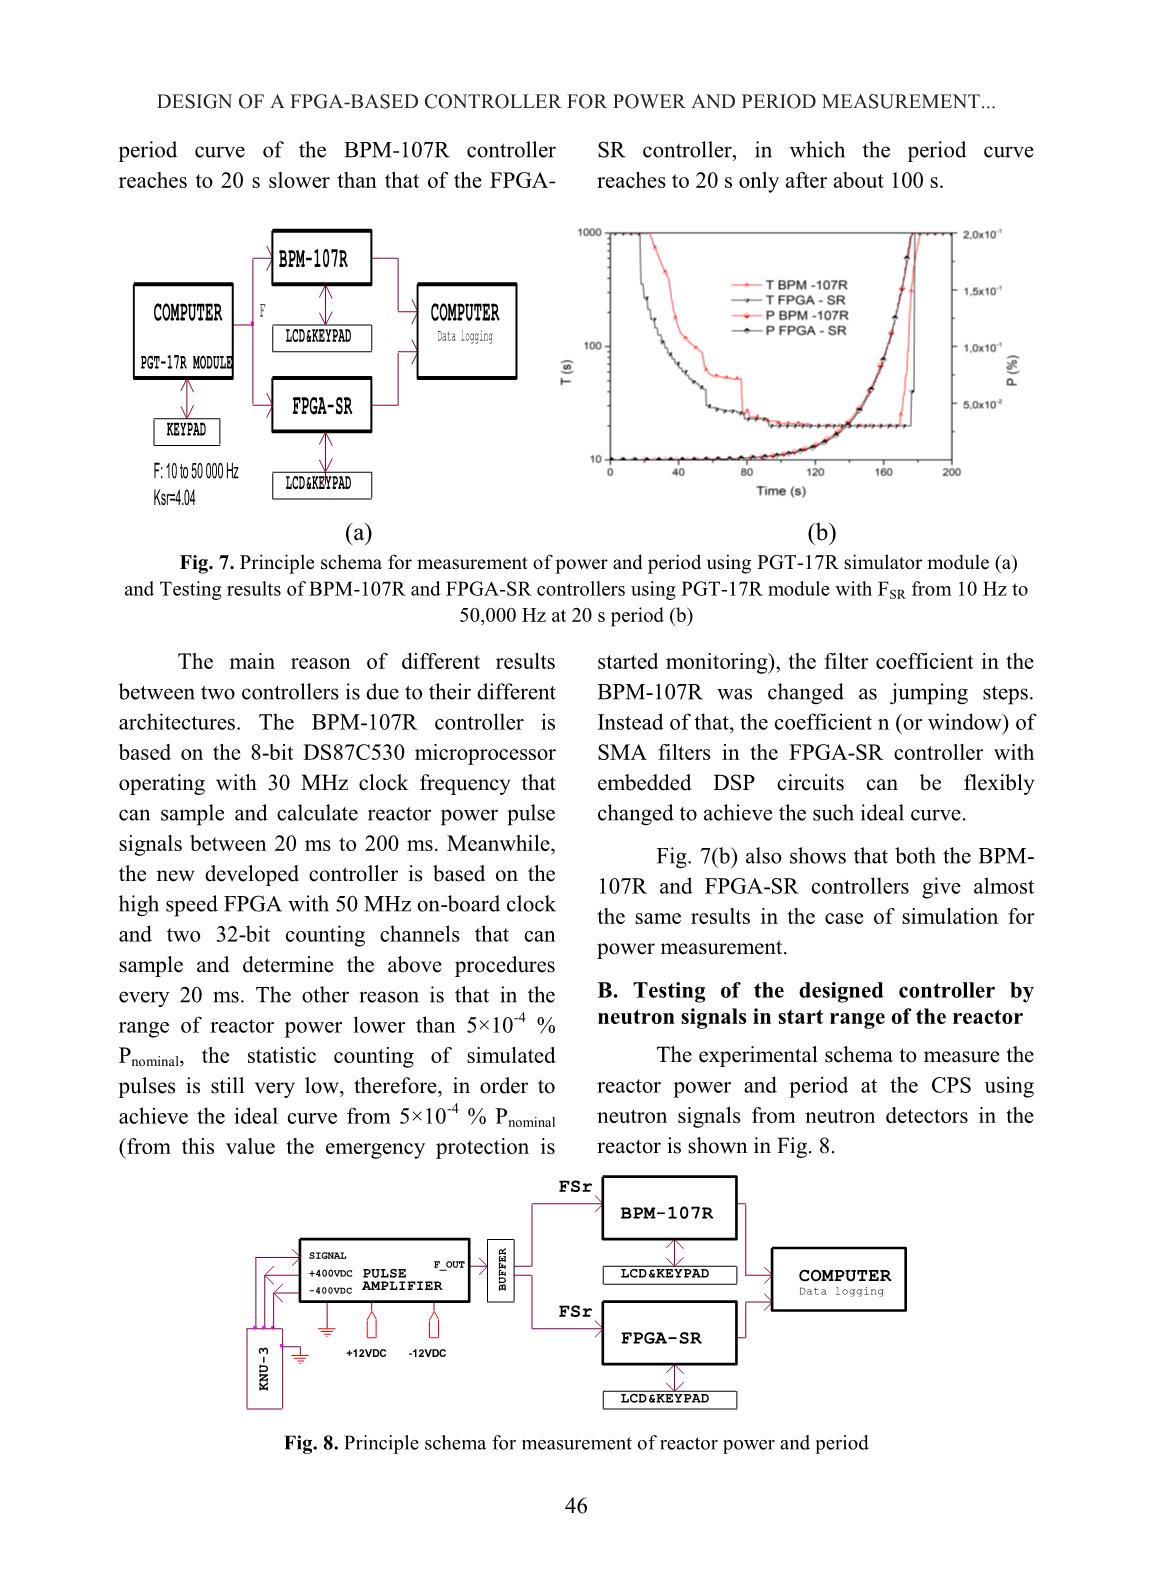
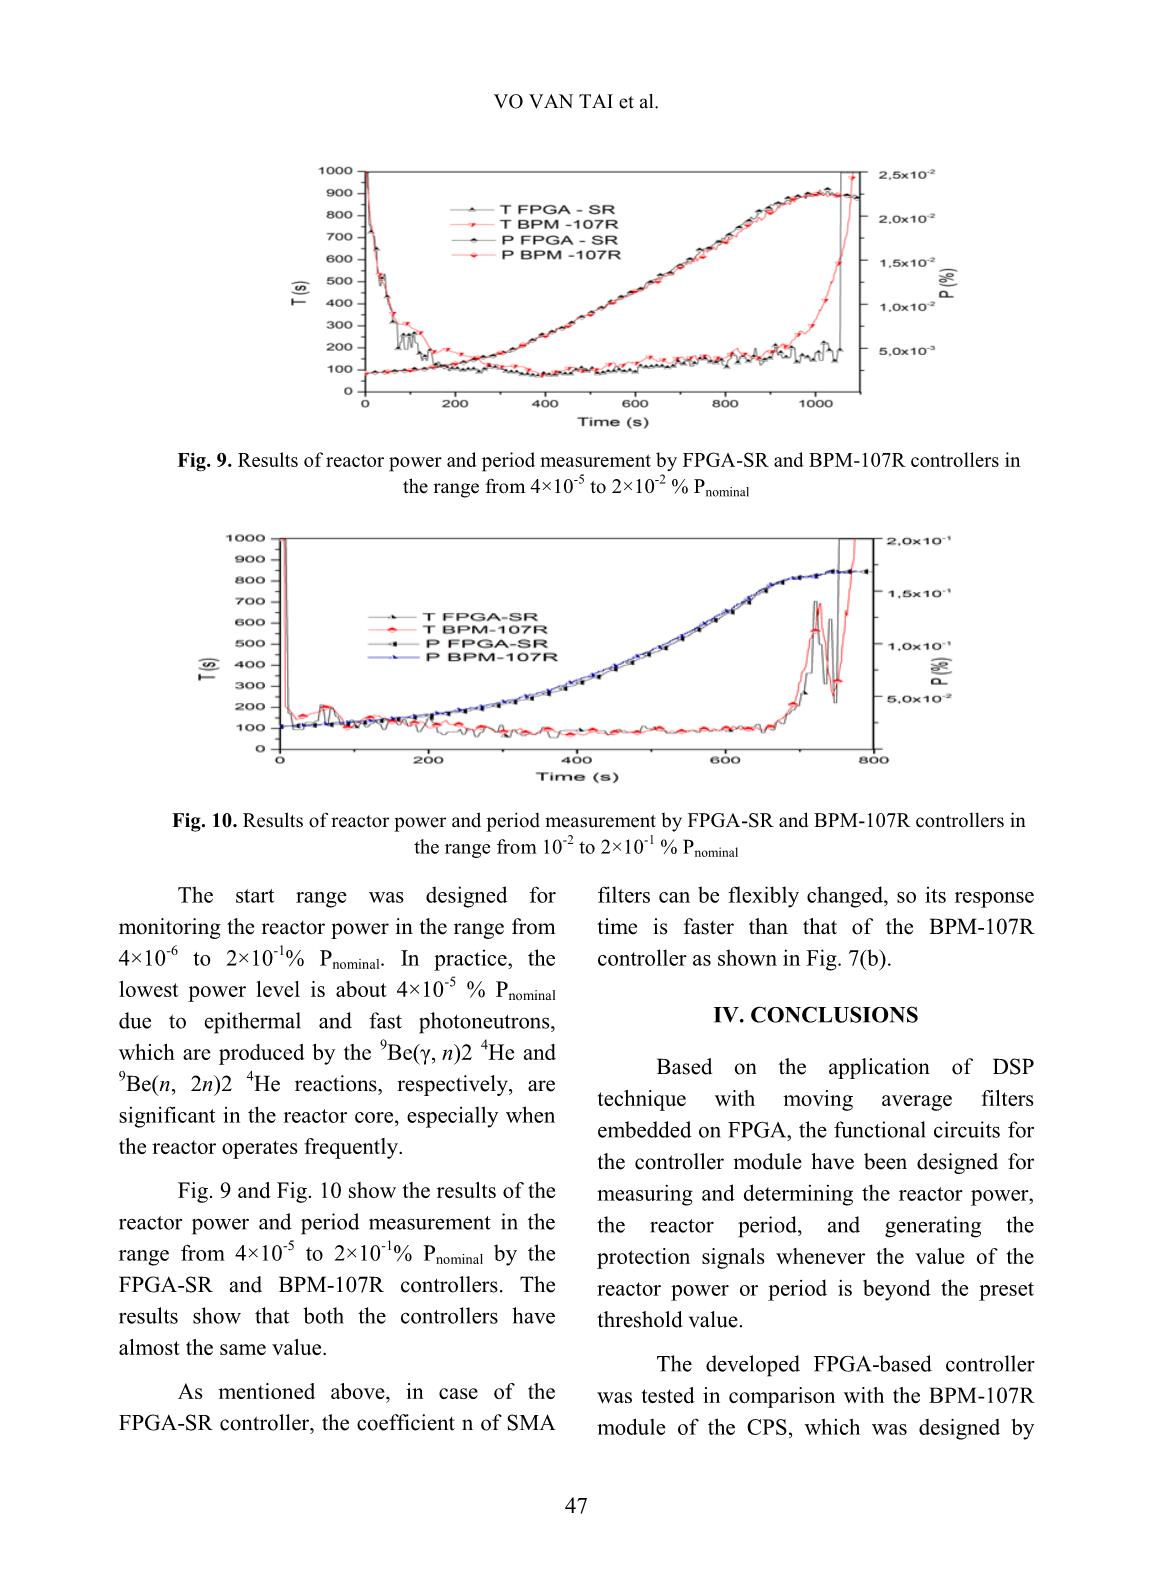
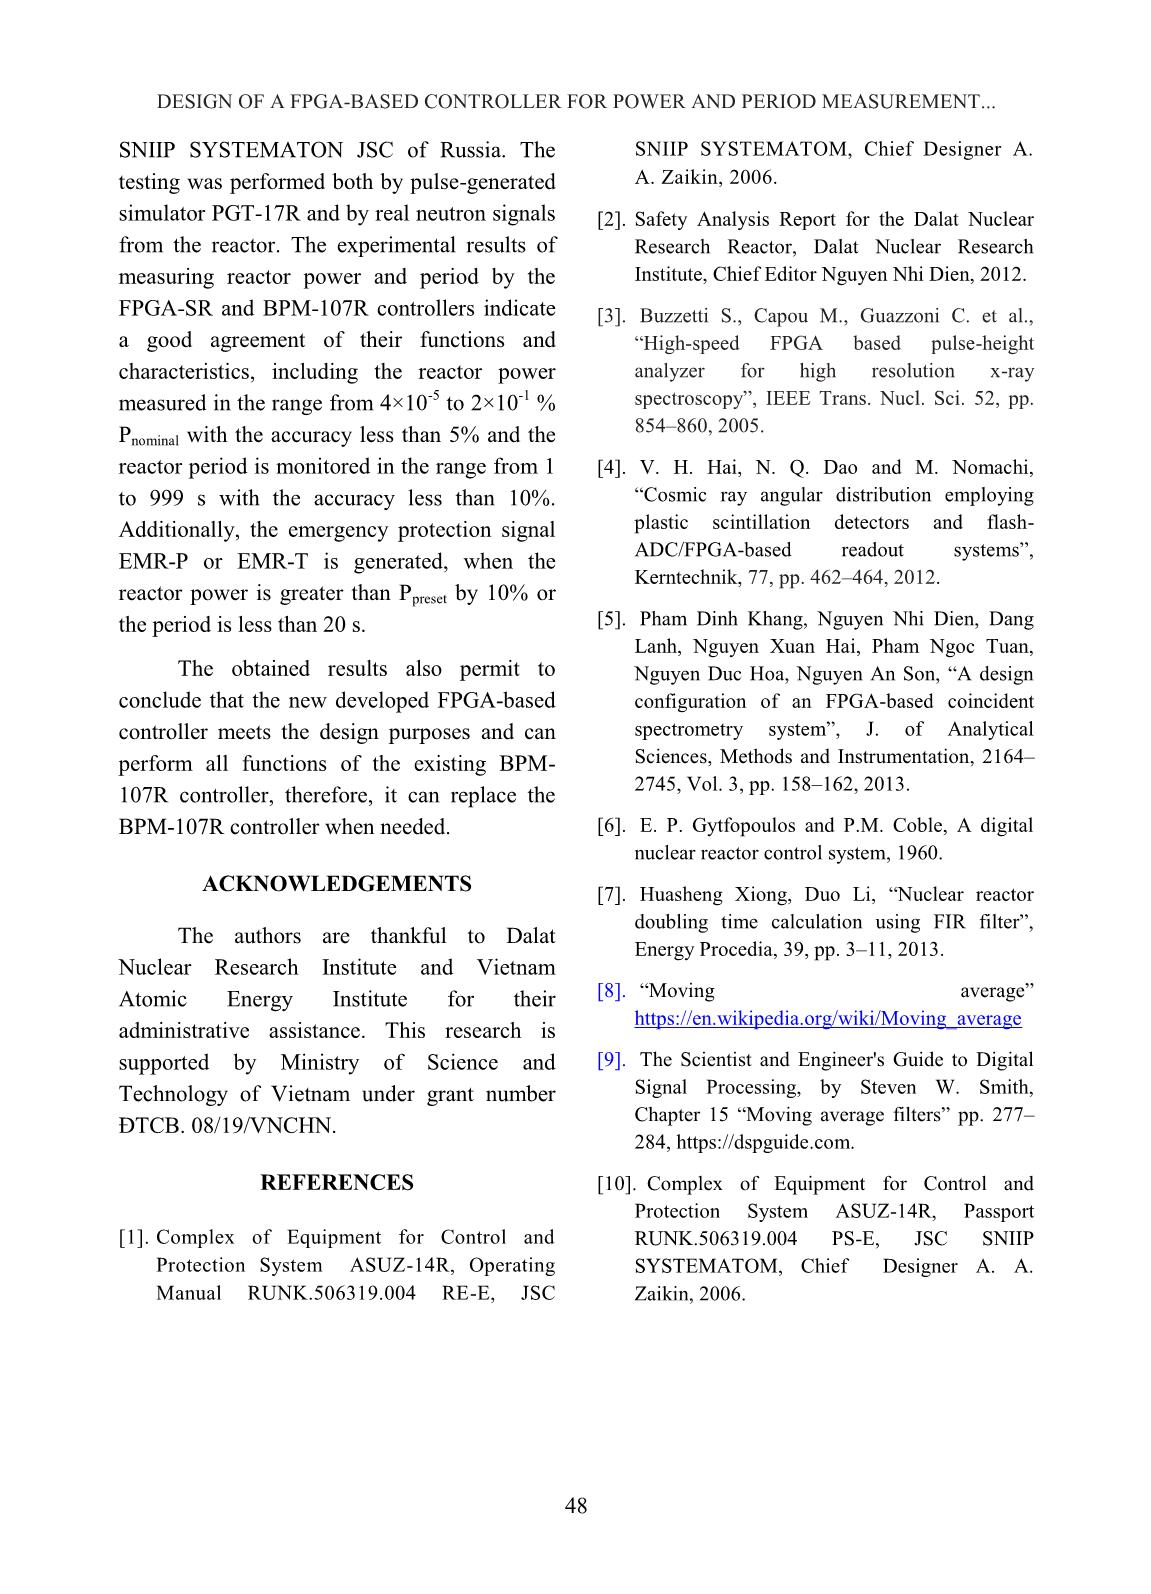
sing FPGA technology [4], and for nuclear data measurement by (n, γ) and (n, 2γ) reactions at horizontal experimental neutron beam ports of nuclear research reactor with high performance gamma spectrometers [5]. Considering the above-mentioned reasons and propensity, the main purpose of this work is to develop the new FPGA-based controller module which can be a spare-part or replacement for the BPM-107R controller when necessary. The developed controller applies DSP principle with moving average filtering technique using a Xilinx FPGA Artix-7 with on-board clock of 50 MHz and two 32-bit counting channels that can sample and calculate reactor power pulse signals every 20 ms. Some comparisons with the current BPM- 107R controller module were performed by simulated signals as well as by real signals from neutron detectors of the start range. Fig. 1. The "2 out-of 3" data processing and architecture of the DNRR’ CPS (S – sensor/detector, C – Controller, L – Logic processing, R – Relay block, A – Actuator, D – Display panel) The CPS of DNRR is operating based on “2 out-of 3” principle as shown in Fig. 1. Three neutron detectors are installed in dry channels outside the reactor core, as shown in Fig. 2. S S C 1 D S L1 L2 L3 C2 C3 R1 R2 R3 A A S2 C1 D S1 S3 VO VAN TAI et al. 43 Fig. 2. Neutron detector unit BDPN-36R2 (left) and detector locations in reactor pool (right) II. METHODS A. Nuclear reactor power and period caculation Neutron density (power) of a nuclear reactor follows the exponential function of: (1) Where, P(t) is transient reactor power at time t, P0 is initial reactor power at time t0, T is the time taken for the power to change by a factor e (e = 2.718 which is the base of natural logarithm) that called the reactor period, t is time during the reactor transient. Fig. 3. Sampling for nuclear reactor power and period calculation To calculate the reactor period from (1), it is necessary to convert continuous time models as Fig. 3 to discrete time form, using finite difference techniques. The reactor period in digital nuclear instrumentation system can be calculated by the equation (2) [6]: or or (2) Where, Pk-1, Pk is the (k-1)-th and k-th sampled reactor power, △t is the sampling period in seconds. From equation (2) we can see that the reactor period can reflect the state of a nuclear reactor. When Pk-Pk-1 = 0, the reactor is in a stable state (T〜999 s); when Pk-Pk-1 > 0, the reactor power increases; and when Pk- Pk-1 < 0, the reactor power decreases. The reactor period can be monitored from 0 to 999 s by 1 s step. The reactor power level is proportional to the reactor neutron flux, therefore, the output frequency from a pulse amplifier is proportional to the reactor power level, then the relationship between the reactor power at DESIGN OF A FPGA-BASED CONTROLLER FOR POWER AND PERIOD MEASUREMENT... 44 the start range (PSR) and the output frequency of the pulse amplifier can be calculated as: PSR = KSR×FSR×10 -6 (3) Where, PSR is the reactor power at the start range, KSR is a coefficient, FSR is the output frequency from the pulse amplifier which is connected to the fission chamber for monitoring in the range from 10 -6 to 10 -1 % Pnominal (Pnominal = 500 kWt). B. Design of moving average filters using FPGA and DSP A moving average (MA) filter is a type of finite impulse response filter (FIR) [7]. It is used widely in many applications in digital signal processing, communications, control, electrical and biomedical systems. The main purpose of MA filter is to increase the signal to noise ratio and to reduce random noise. A simple moving average (SMA) filter is a filter that averages N points of previous inputs and makes an output with them, the formula is expressed as follows: [8, 9] 1 1 ( 1) 0 ..... 1 nM M M n SM M i i P P P P P n n (4) When calculating sequential values, a new value comes into the sum, and the oldest value moves out, n is coefficient or window of filter. Equation (4) can be rewritten as: , r 1 ( )SM SM p e M M nP P P P n (5) Where, SMP is the average value, , rSM p eP is the previous average, MP is the new sample, M nP is the n-th old sample, n is the window of SMA filter. Equation (5) can be described in Fig. 4, in which the reactor power and the reactor period are calculated by DSP technique embedded on FPGA. Fig. 4. Principle schema used for moving average filter Fig. 5. Principle schema used for calculating reactor period SAMPLE IN Pulse circuit SAMPLE OUT Clock Xi Z(-n) Yi n DIVSUB Z(-1) ADD SMA Filter INVERSE WRM_T EMR_T set_Scram T=20s F_T set_Alarm T=40 s T Comp5 1 3 2 Clock Comp6 1 3 2 Dt Z(-1) MULT MULT for calculating reactor period SUB VO VAN TAI et al. 45 SAMPLE IN is the input of the SMA filter that is processed by a pulse circuit for normalizing the pulse width, then counting, accumulating and performing SMA filtering technique, the output signal (SAMPLE OUT) is frequency, n is a coefficient of filter that is dependent on the fluctuation of input signal. The diagram for reactor period calculation by Eq. (2) can be described in Fig. 5. F_T is the output signal from SMA filter that is used for calculating reactor period, and then calculated period is compared with set_Alarm T (40 sec) and set_Scram T (20 sec) to generate discrete signals WRN_T and EMR_T, respectively. Further, these signals will access to the logical processing unit of the CPS, in which signal WRN_T is used for formulation of a command to prohibit the upward movement of control rods, meanwhile EMR_T signal formulates a command to shut down the reactor. To calculate the reactor power at the start range, Eq. (3) is described in Fig. 6. Fig. 6. Principle schema used for calculating reactor power at start range As shown in Fig. 6, the F_Psr signals are performed to calculate the reactor power for the start range (Psr). Then these values are compared with set_Alarm P (5% Ppreset) and set_Scram P (10% Ppreset) for generating discrete signals WRN_Psr and EMR_Psr, respectively. Further, these discrete signals will access to the logical processing unit of the CPS, in which signal WRN_Psr is used for formulation of a command to prohibit the upward movement of control rods, meanwhile EMR_Psr signal formulates a command to shut down the reactor. III. EXPERIMENTAL RESULTS AND DISCUSSION A. Testing of the designed controller in the start range by simulator The simulator module PGT-17R, designed by SNIIP SYSTEMATOM JSC, was used for testing of the new designed controller module in the start range (named FPGA-SR). The experiment which was setup to measure the power and the period for testing FPGA-SR and BPM-107R controllers is shown in Fig. 7(a). The values of power and period of both the controllers were recorded (data logging) using a computer via Terminal v1.9b software. In the CPS, the KSR coefficient for calculating reactor power was calibrated to be 4.04. The initial value of simulated frequency was 10 Hz and the final value was 50,000 Hz. The simulated period was chosen to be 20 s. The relative error of the monitored reactor power in the range from 4×10 -5 to 2×10 -1 % Pnominal is within 5% and that of the monitored reactor period is within 10%, which are reported in [10]. Figure 7(b) shows the testing results for period measurement at 20 s by the BPM-107R and FPGA-SR controllers. The set_Scram P Ksr F_Psr MULT EMR_Psr for calculating reactor power Psr Clock WRN_Psr Comp2 1 3 2 Psr Comp1 1 3 2 1000000 set_Alarm P DIV DESIGN OF A FPGA-BASED CONTROLLER FOR POWER AND PERIOD MEASUREMENT... 46 period curve of the BPM-107R controller reaches to 20 s slower than that of the FPGA- SR controller, in which the period curve reaches to 20 s only after about 100 s. (a) (b) Fig. 7. Principle schema for measurement of power and period using PGT-17R simulator module (a) and Testing results of BPM-107R and FPGA-SR controllers using PGT-17R module with FSR from 10 Hz to 50,000 Hz at 20 s period (b) The main reason of different results between two controllers is due to their different architectures. The BPM-107R controller is based on the 8-bit DS87C530 microprocessor operating with 30 MHz clock frequency that can sample and calculate reactor power pulse signals between 20 ms to 200 ms. Meanwhile, the new developed controller is based on the high speed FPGA with 50 MHz on-board clock and two 32-bit counting channels that can sample and determine the above procedures every 20 ms. The other reason is that in the range of reactor power lower than 5×10 -4 % Pnominal, the statistic counting of simulated pulses is still very low, therefore, in order to achieve the ideal curve from 5×10 -4 % Pnominal (from this value the emergency protection is started monitoring), the filter coefficient in the BPM-107R was changed as jumping steps. Instead of that, the coefficient n (or window) of SMA filters in the FPGA-SR controller with embedded DSP circuits can be flexibly changed to achieve the such ideal curve. Fig. 7(b) also shows that both the BPM- 107R and FPGA-SR controllers give almost the same results in the case of simulation for power measurement. B. Testing of the designed controller by neutron signals in start range of the reactor The experimental schema to measure the reactor power and period at the CPS using neutron signals from neutron detectors in the reactor is shown in Fig. 8. Fig. 8. Principle schema for measurement of reactor power and period F F: 10 to 50 000 Hz KEYPAD Data logging PGT-17R MODULE Ksr=4.04 LCD&KEYPAD COMPUTER FPGA-SR BPM-107R COMPUTER LCD&KEYPAD FSr -400VDC +12VDC B U F F E R COMPUTER -12VDC LCD&KEYPAD SIGNAL K N U - 3 +400VDC BPM-107R F_OUT PULSE AMPLIFIER Data logging FPGA-SR LCD&KEYPAD FSr VO VAN TAI et al. 47 Fig. 9. Results of reactor power and period measurement by FPGA-SR and BPM-107R controllers in the range from 4×10 -5 to 2×10 -2 % Pnominal Fig. 10. Results of reactor power and period measurement by FPGA-SR and BPM-107R controllers in the range from 10 -2 to 2×10 -1 % Pnominal The start range was designed for monitoring the reactor power in the range from 4×10 -6 to 2×10 -1 % Pnominal. In practice, the lowest power level is about 4×10 -5 % Pnominal due to epithermal and fast photoneutrons, which are produced by the 9Be(γ, n)2 4He and 9 Be(n, 2n)2 4 He reactions, respectively, are significant in the reactor core, especially when the reactor operates frequently. Fig. 9 and Fig. 10 show the results of the reactor power and period measurement in the range from 4×10 -5 to 2×10 -1 % Pnominal by the FPGA-SR and BPM-107R controllers. The results show that both the controllers have almost the same value. As mentioned above, in case of the FPGA-SR controller, the coefficient n of SMA filters can be flexibly changed, so its response time is faster than that of the BPM-107R controller as shown in Fig. 7(b). IV. CONCLUSIONS Based on the application of DSP technique with moving average filters embedded on FPGA, the functional circuits for the controller module have been designed for measuring and determining the reactor power, the reactor period, and generating the protection signals whenever the value of the reactor power or period is beyond the preset threshold value. The developed FPGA-based controller was tested in comparison with the BPM-107R module of the CPS, which was designed by DESIGN OF A FPGA-BASED CONTROLLER FOR POWER AND PERIOD MEASUREMENT... 48 SNIIP SYSTEMATON JSC of Russia. The testing was performed both by pulse-generated simulator PGT-17R and by real neutron signals from the reactor. The experimental results of measuring reactor power and period by the FPGA-SR and BPM-107R controllers indicate a good agreement of their functions and characteristics, including the reactor power measured in the range from 4×10 -5 to 2×10 -1 % Pnominal with the accuracy less than 5% and the reactor period is monitored in the range from 1 to 999 s with the accuracy less than 10%. Additionally, the emergency protection signal EMR-P or EMR-T is generated, when the reactor power is greater than Ppreset by 10% or the period is less than 20 s. The obtained results also permit to conclude that the new developed FPGA-based controller meets the design purposes and can perform all functions of the existing BPM- 107R controller, therefore, it can replace the BPM-107R controller when needed. ACKNOWLEDGEMENTS The authors are thankful to Dalat Nuclear Research Institute and Vietnam Atomic Energy Institute for their administrative assistance. This research is supported by Ministry of Science and Technology of Vietnam under grant number ĐTCB. 08/19/VNCHN. REFERENCES [1]. Complex of Equipment for Control and Protection System ASUZ-14R, Operating Manual RUNK.506319.004 RE-E, JSC SNIIP SYSTEMATOM, Chief Designer А. А. Zaikin, 2006. [2]. Safety Analysis Report for the Dalat Nuclear Research Reactor, Dalat Nuclear Research Institute, Chief Editor Nguyen Nhi Dien, 2012. [3]. Buzzetti S., Capou M., Guazzoni C. et al., “High-speed FPGA based pulse-height analyzer for high resolution x-ray spectroscopy”, IEEE Trans. Nucl. Sci. 52, pp. 854–860, 2005. [4]. V. H. Hai, N. Q. Dao and M. Nomachi, “Cosmic ray angular distribution employing plastic scintillation detectors and flash- ADC/FPGA-based readout systems”, Kerntechnik, 77, pp. 462–464, 2012. [5]. Pham Dinh Khang, Nguyen Nhi Dien, Dang Lanh, Nguyen Xuan Hai, Pham Ngoc Tuan, Nguyen Duc Hoa, Nguyen An Son, “A design configuration of an FPGA-based coincident spectrometry system”, J. of Analytical Sciences, Methods and Instrumentation, 2164– 2745, Vol. 3, pp. 158–162, 2013. [6]. E. P. Gytfopoulos and P.M. Coble, A digital nuclear reactor control system, 1960. [7]. Huasheng Xiong, Duo Li, “Nuclear reactor doubling time calculation using FIR filter”, Energy Procedia, 39, pp. 3–11, 2013. [8]. “Moving average” https://en.wikipedia.org/wiki/Moving_average [9]. The Scientist and Engineer's Guide to Digital Signal Processing, by Steven W. Smith, Chapter 15 “Moving average filters” pp. 277– 284, https://dspguide.com. [10]. Complex of Equipment for Control and Protection System ASUZ-14R, Passport RUNK.506319.004 PS-E, JSC SNIIP SYSTEMATOM, Chief Designer А. А. Zaikin, 2006.
File đính kèm:
 design_of_a_fpga_based_controller_for_power_and_period_measu.pdf

