Vietnamese tea exporting and forecasting to 2030
This study aimed to determine the factors influencing Vietnamese tea
export quantities, namely, the internal factors of national tea
production, productivity, and cultivated areas, and the external
factors of export price and world tea export quantity (excluding
Vietnam). We employed a time-series linear model to estimate the
magnitude as well as the sign of the aforementioned factors on
Vietnam’s tea export quantity and two Box-Cox transformations
called a simple back-transformed forecast and a bias-adjustment to
forecast the growth rate of the Vietnamese tea export quantity until
2030. The results suggested that except for the total domestic tea
production, all the proposed factors significantly affected the
Vietnamese tea export quantity. The tea export quantity of other
nations around the world had a significantly negative impact on
Vietnamese tea that led to Vietnam’s tea exports dropping by 34 tons
on average since the other countries exported 1,000 tons of tea. The
forecasted outcome suggested an upward trend of Vietnamese tea
exports up to 2030. In order to sustainably develop Vietnam’s tea
industry, we recommend that the government should take supportive
actions such as investing in in-depth tea processing to improve
Vietnam’s tea export quality, focusing on post-harvest activities,
investing in organic or high-value tea rather than conventional tea,
continuing to accumulate land to support the growth of cultivated
tea areas, and maintaining high productivity by using hybrid seeds.
Trang 1
Trang 2
Trang 3
Trang 4
Trang 5
Trang 6
Trang 7
Trang 8
Trang 9
Trang 10
Tải về để xem bản đầy đủ
Tóm tắt nội dung tài liệu: Vietnamese tea exporting and forecasting to 2030
 of
2013-2016, during the preceding period from
2005 to 2012 it increased by 120.2 thousand tons,
and increased by 77.92 thousand tons during the
period from 2017 to 2018. Similarly, the value
of the exported tea increased more significantly
than the quantity of the exported tea. To be more
precise, as shown in Table 4, the value grew by
24.1 million dollars in the period of 1990 to
1997, rose by 68.6 million dollars in the next
period from 1998-2004, and by 161.5 million
dollars in the period of 2005 to 2012. Overall,
the value of the exported tea increased on
average by 105.51 million dollars during the
period from 1990 till 2018.
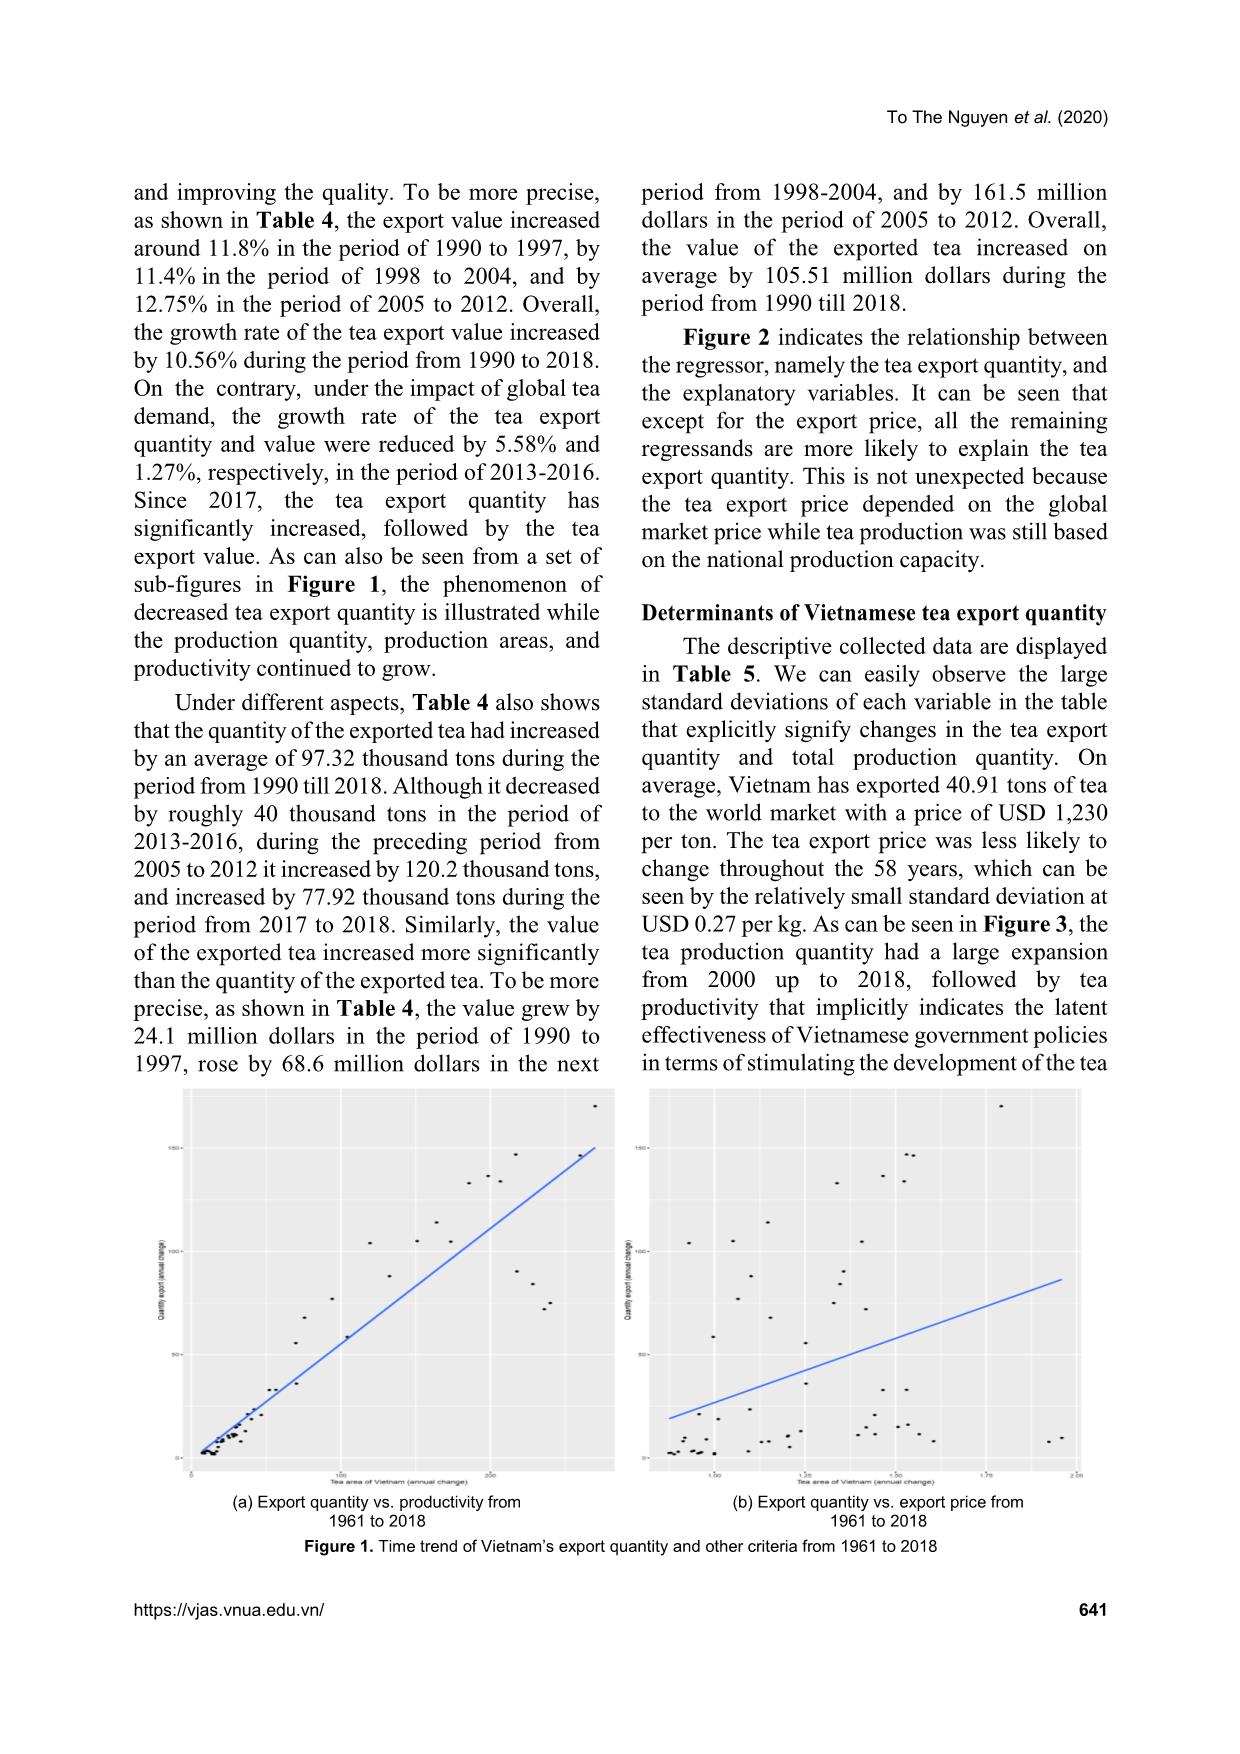
Figure 2 indicates the relationship between
the regressor, namely the tea export quantity, and
the explanatory variables. It can be seen that
except for the export price, all the remaining
regressands are more likely to explain the tea
export quantity. This is not unexpected because
the tea export price depended on the global
market price while tea production was still based
on the national production capacity.
Determinants of Vietnamese tea export quantity
The descriptive collected data are displayed
in Table 5. We can easily observe the large
standard deviations of each variable in the table
that explicitly signify changes in the tea export
quantity and total production quantity. On
average, Vietnam has exported 40.91 tons of tea
to the world market with a price of USD 1,230
per ton. The tea export price was less likely to
change throughout the 58 years, which can be
seen by the relatively small standard deviation at
USD 0.27 per kg. As can be seen in Figure 3, the
tea production quantity had a large expansion
from 2000 up to 2018, followed by tea
productivity that implicitly indicates the latent
effectiveness of Vietnamese government policies
in terms of stimulating the development of the tea
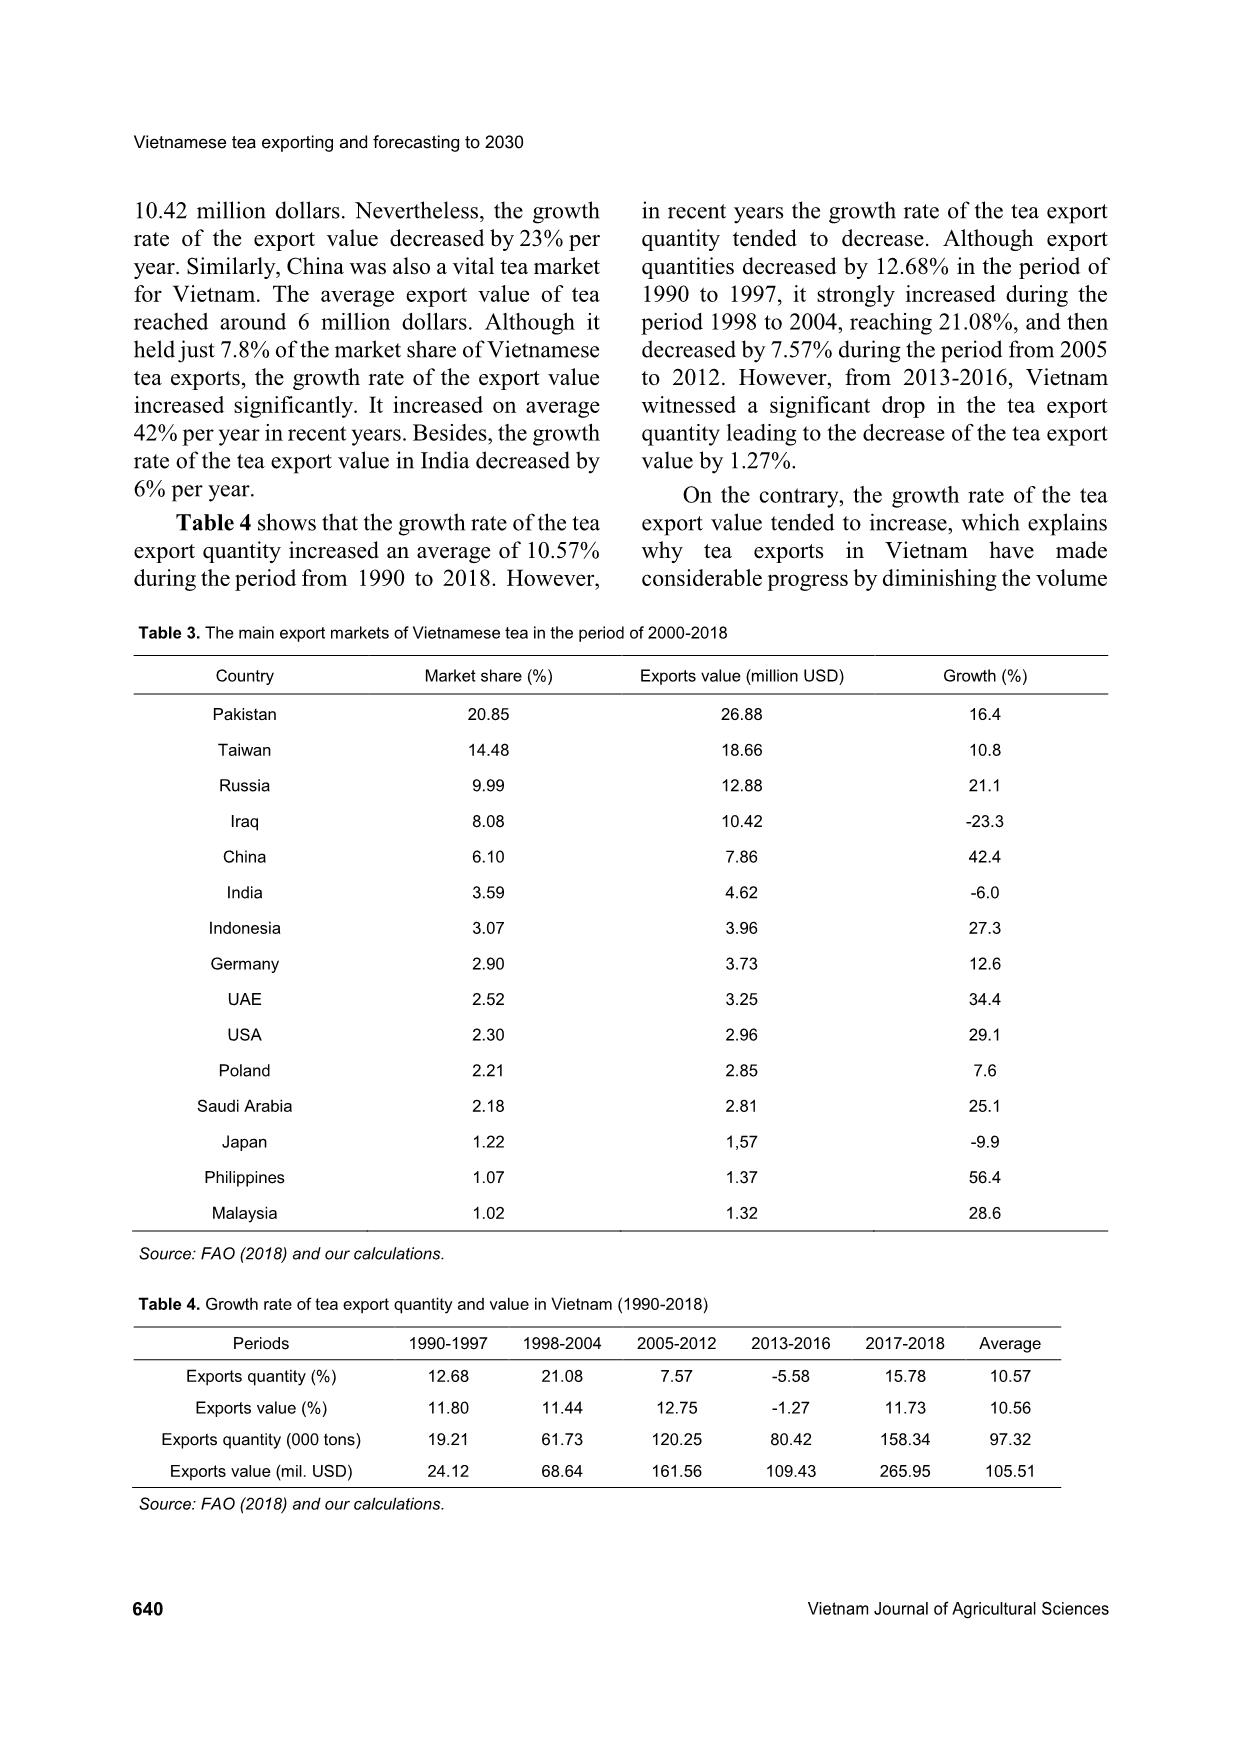
(a) Export quantity vs. productivity from
1961 to 2018
 (b) Export quantity vs. export price from
1961 to 2018
Figure 1. Time trend of Vietnam’s export quantity and other criteria from 1961 to 2018
Vietnamese tea exporting and forecasting to 2030
642 Vietnam Journal of Agricultural Sciences
 1960 1980 2000 2020
Year
(c) Export quantity vs. productivity from
1961 to 2018
 1960 1980 2000 2020
Year
 (d) Export quantity vs. export price from
 1961 to 2018
Figure 2. Vietnam export quantity and other criteria from 1961 to 2018
 Table 5. Descriptive statistics for the characteristics of Vietnamese tea (n = 58)
Variable Unit Mean Std.Dev.
Tea export quantity 103 tons 40.91 48.36
Total production area 103 ha 59.91 34.14
Total production quantity 103 tons 74.50 80.52
Tea productivity tons ha-1 9.45 5.47
Tea export price USD kg-1 1.23 0.27
World production 103 tons 2820.19 1481.47
0
100
200
1960 1980 2000 2020
Year
 change
series
QuanV
Export.QuanV
0
50
100
150
1960 1980 2000 2020
Year
 change
series
Export.QuanV
AreaV
(a) Export quantity vs. production quantity
from 1961 to 2018
(b) Export quantity vs. production area from
1961 to 2018
0
50
100
150
change
series
ProdV
Export.QuanV
0
50
100
150
 change
series
Export.QuanV
Export.price
To The Nguyen et al. (2020)
https://vjas.vnua.edu.vn/ 643
industry in Vietnam since 2000 via each 5-year
planning stage.
All the general information of the regression
promised a good model. Specifically, except for
the total tea production, which had a negative and
insignificant impact, the production area, export
price, and tea productivity had positive
significant effects on the tea export quantity of
Vietnam. On average, when the cultivated tea
area increased by 1,000ha, the tea export quantity
grew by 1,307 tons (Table 6). This signifies the
suitability of land accumulation legislated by the
government to increase the quantity of tea
produced in the coming years. Similarly, when
the tea productivity increased by 1 ton per ha, the
tea export quantity grew by 12.096 tons, on
average, when the other variables were held
constant. This indicates the importance of
enhancing tea productivity to the produced
quantity as well as the total export quantity in
which the opportunity of acquiring a larger
market share of Vietnamese tea might become
possible. The total produced quantity had a
negative but insignificant impact on the tea
export quantity; however, this points out that the
majority of tea produced in Vietnam had been
used domestically rather than exported. This also
latently indicated that the global demand for
Vietnamese tea had fallen leading to unexported
tea being consumed nationally. In addition, the
latent explanation for this issue might come from
the rumor of “dirty tea” from Vietnam that
directly led to the difficulty in exporting
Vietnamese tea in the period 2013-2016.
Regarding the external factors, the tea export
price and total global tea production had inverse
impacts on the Vietnamese tea export quantity.
The export price was significantly positive, while
the world quantity was significantly negative.
Our results represent the true story of every
single commercial agricultural product entering
the global market. When the price went up and
the global demand did not change or increased,
we tended to export more. On the other hand,
other countries that export tea are Vietnam’s
competitors in the global market and as a result,
when the tea quantity of other tea exporters
increased by 1,000 tons, our tea export quantity
dropped by 34 tons (Table 6). To be competitive
at the global scale, we need appropriate solutions
to acquire a larger market share for stably
developing the tea exports of Vietnam.
Forecasting Vietnam’s tea export quantity to
2030
In Table 7, we observe the prediction results
of Vietnam’s tea export quantity up to 2030. The
predictions inform us that in 2019, the expected
total tea export quantity should have reached
180.986 thousand tons, meanwhile, the total
export value in 2030 might increase 231% as
compared to that in 2019. However, the predicted
increment pace using a conventional back-
transformation was lower than using the bias-
adjustment method from a Box-Cox
transformation. The bias-adjustment forecasted
that the growth rate of the tea export quantity
could reach 291% in a period of 12 years. The
prediction is robust evidence for Vietnamese tea
producers and policymakers to construct
appropriate strategies for improving tea exports
as well as acquiring of a larger market share for
Vietnam in the global tea market.
Furthermore, we attempted to predict the
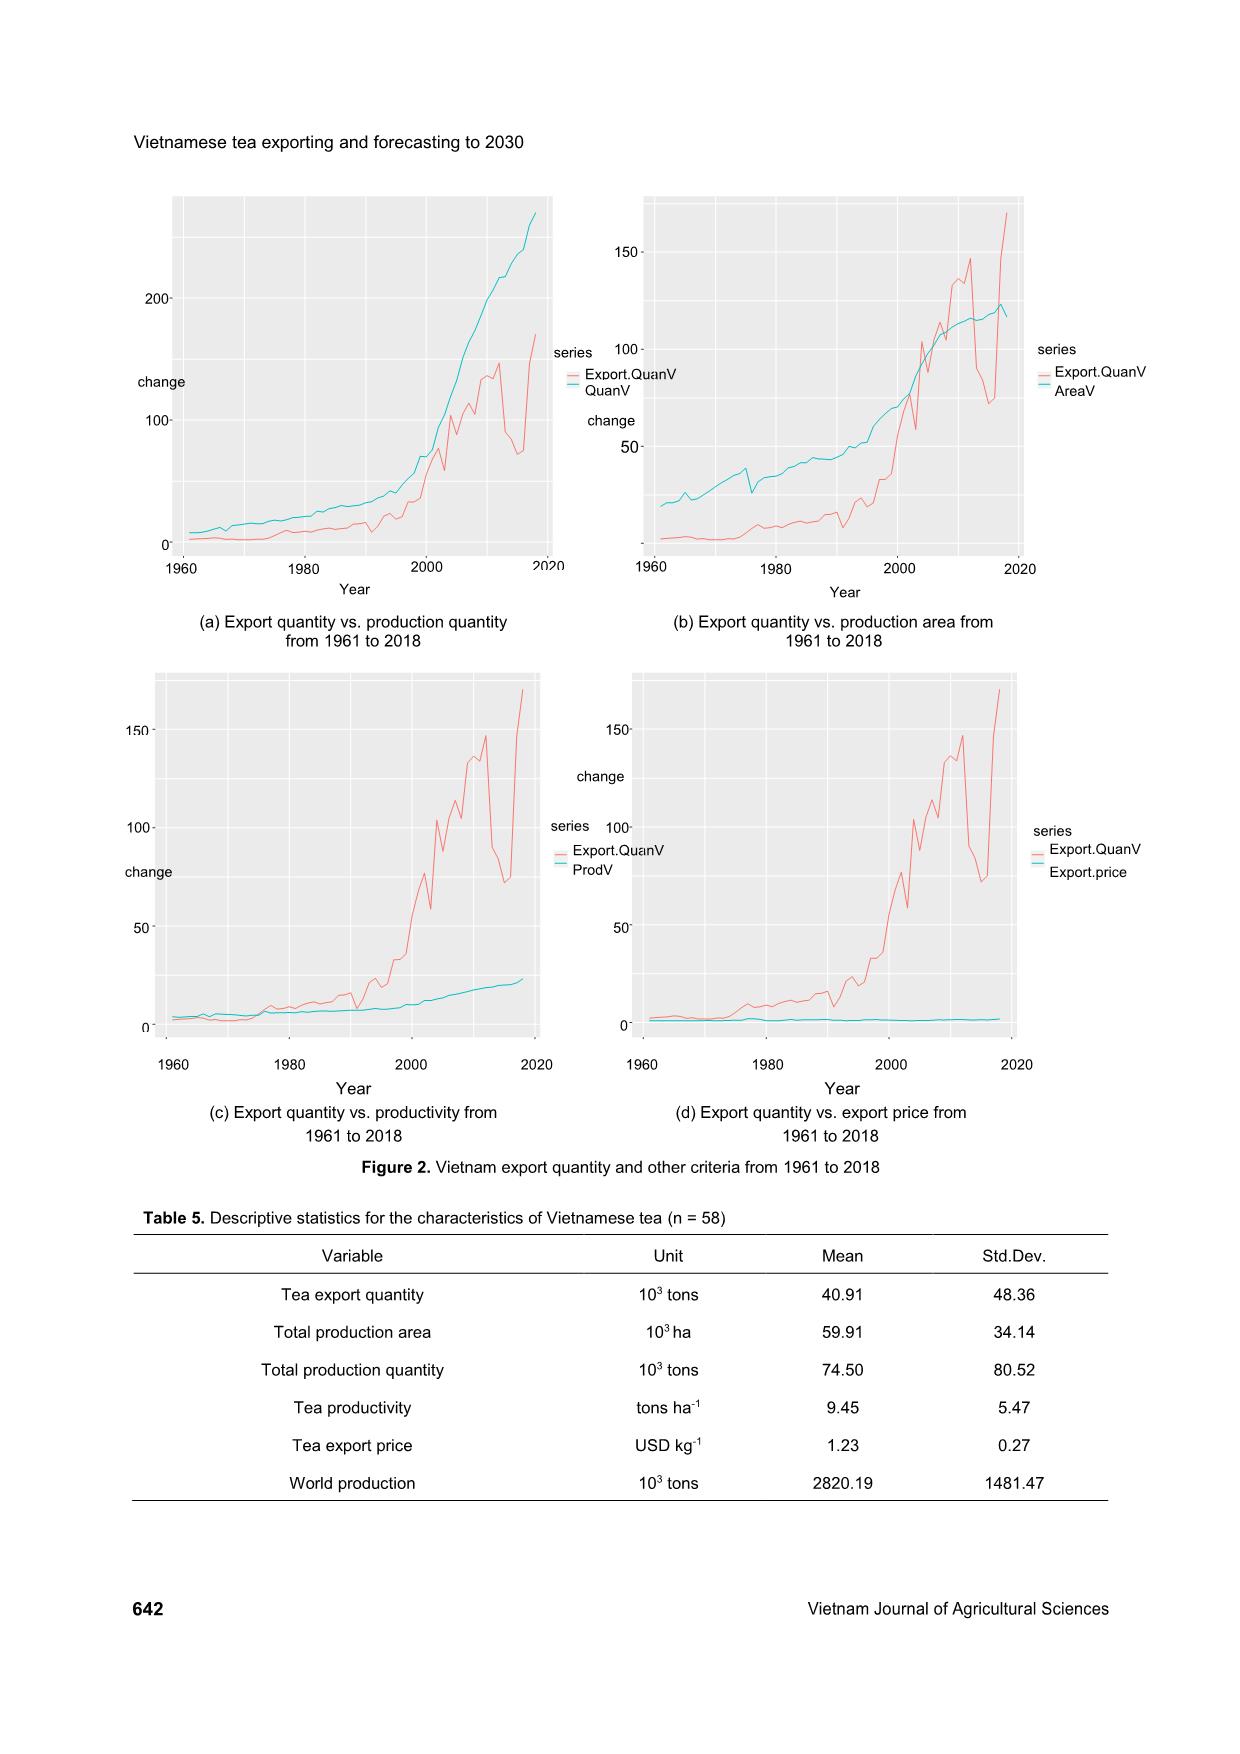
 Table 6. Summary of the time-series linear model
Variable Coefficient Std.Error t-value
Intercept -54.397∗∗∗ 16.118 (-3.375)
Total quantity -0.206 0.171 (-0.911)
Production area 1.307∗∗∗ 0.012 (4.773)
Export price 11.715∗ 0.017 (1.816)
Productivity 12.096∗∗ 0.002 (2.761)
World quantity -0.034∗∗∗ 0.299 (-4.525)
 Notes: z-statistics are in the parentheses; ∗, ∗∗ and ∗∗∗ indicate significance at the 10%, 5%, and 1% levels, respectively.
Vietnamese tea exporting and forecasting to 2030
644 Vietnam Journal of Agricultural Sciences
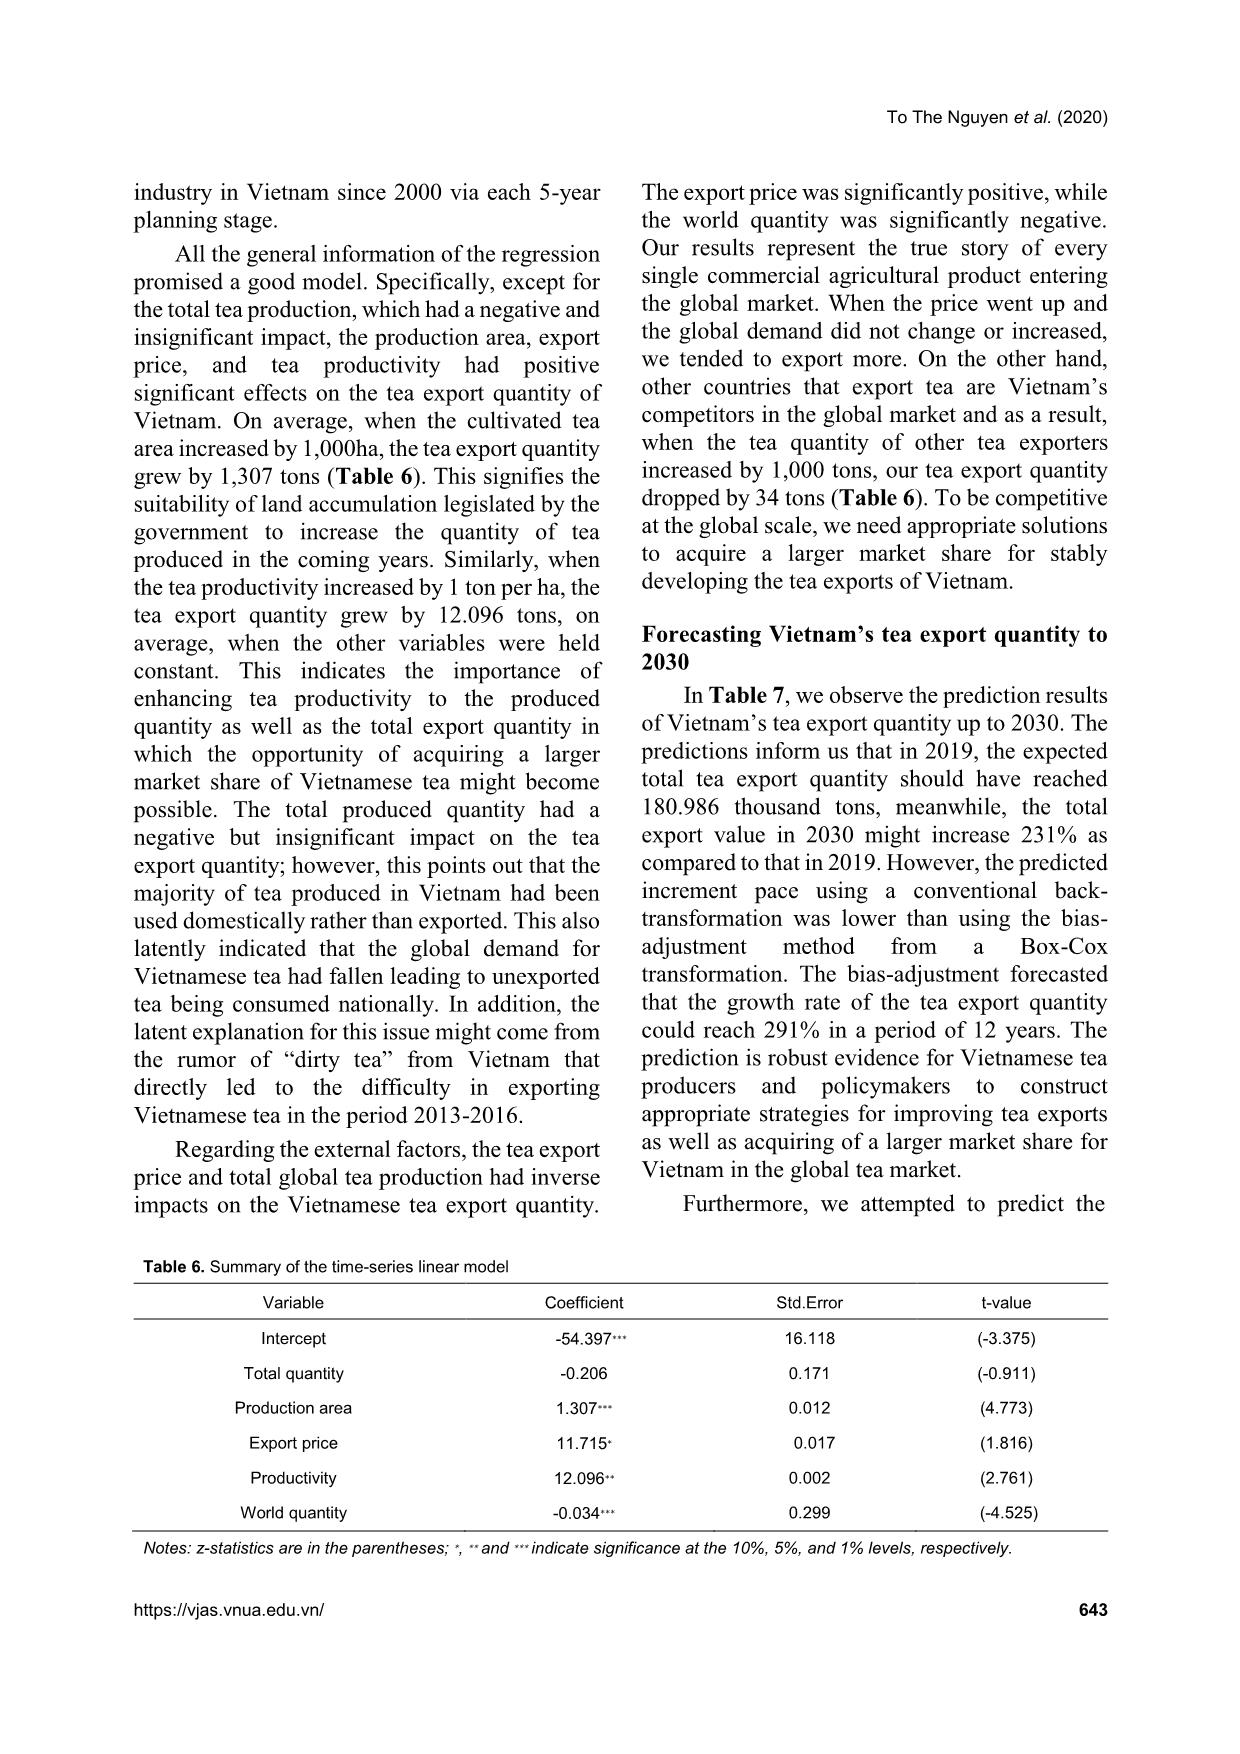
 Table 7. Forecasting using Box-Cox transformation
Year Back-transformation Bias-adjustment Low 95 High 95
2019 180.986 187.081 108.826 300.993
2020 195.366 207.141 98.925 385.824
2021 210.887 229.209 93.161 477.385
2022 227.643 253.478 89.479 579.143
2023 245.730 280.158 87.071 693.489
2024 265.253 309.478 85.533 822.603
2025 286.328 341.691 84.632 968.704
2026 309.077 377.071 84.229 1134.162
2027 333.634 415.917 84.227 1321.562
2028 360.142 458.559 84.565 1533.757
2029 388.756 505.353 85.196 1773.913
2030 419.643 556.691 86.089 2045.548
export quantity of Vietnam in the next 10 years
by using Box-Cox transformations called simple
back-transformed forecasts (median) and bias-
adjustments (mean). When we used the mean,
rather than the median, our analysis estimated the
point forecasts based on a bias-adjustment.
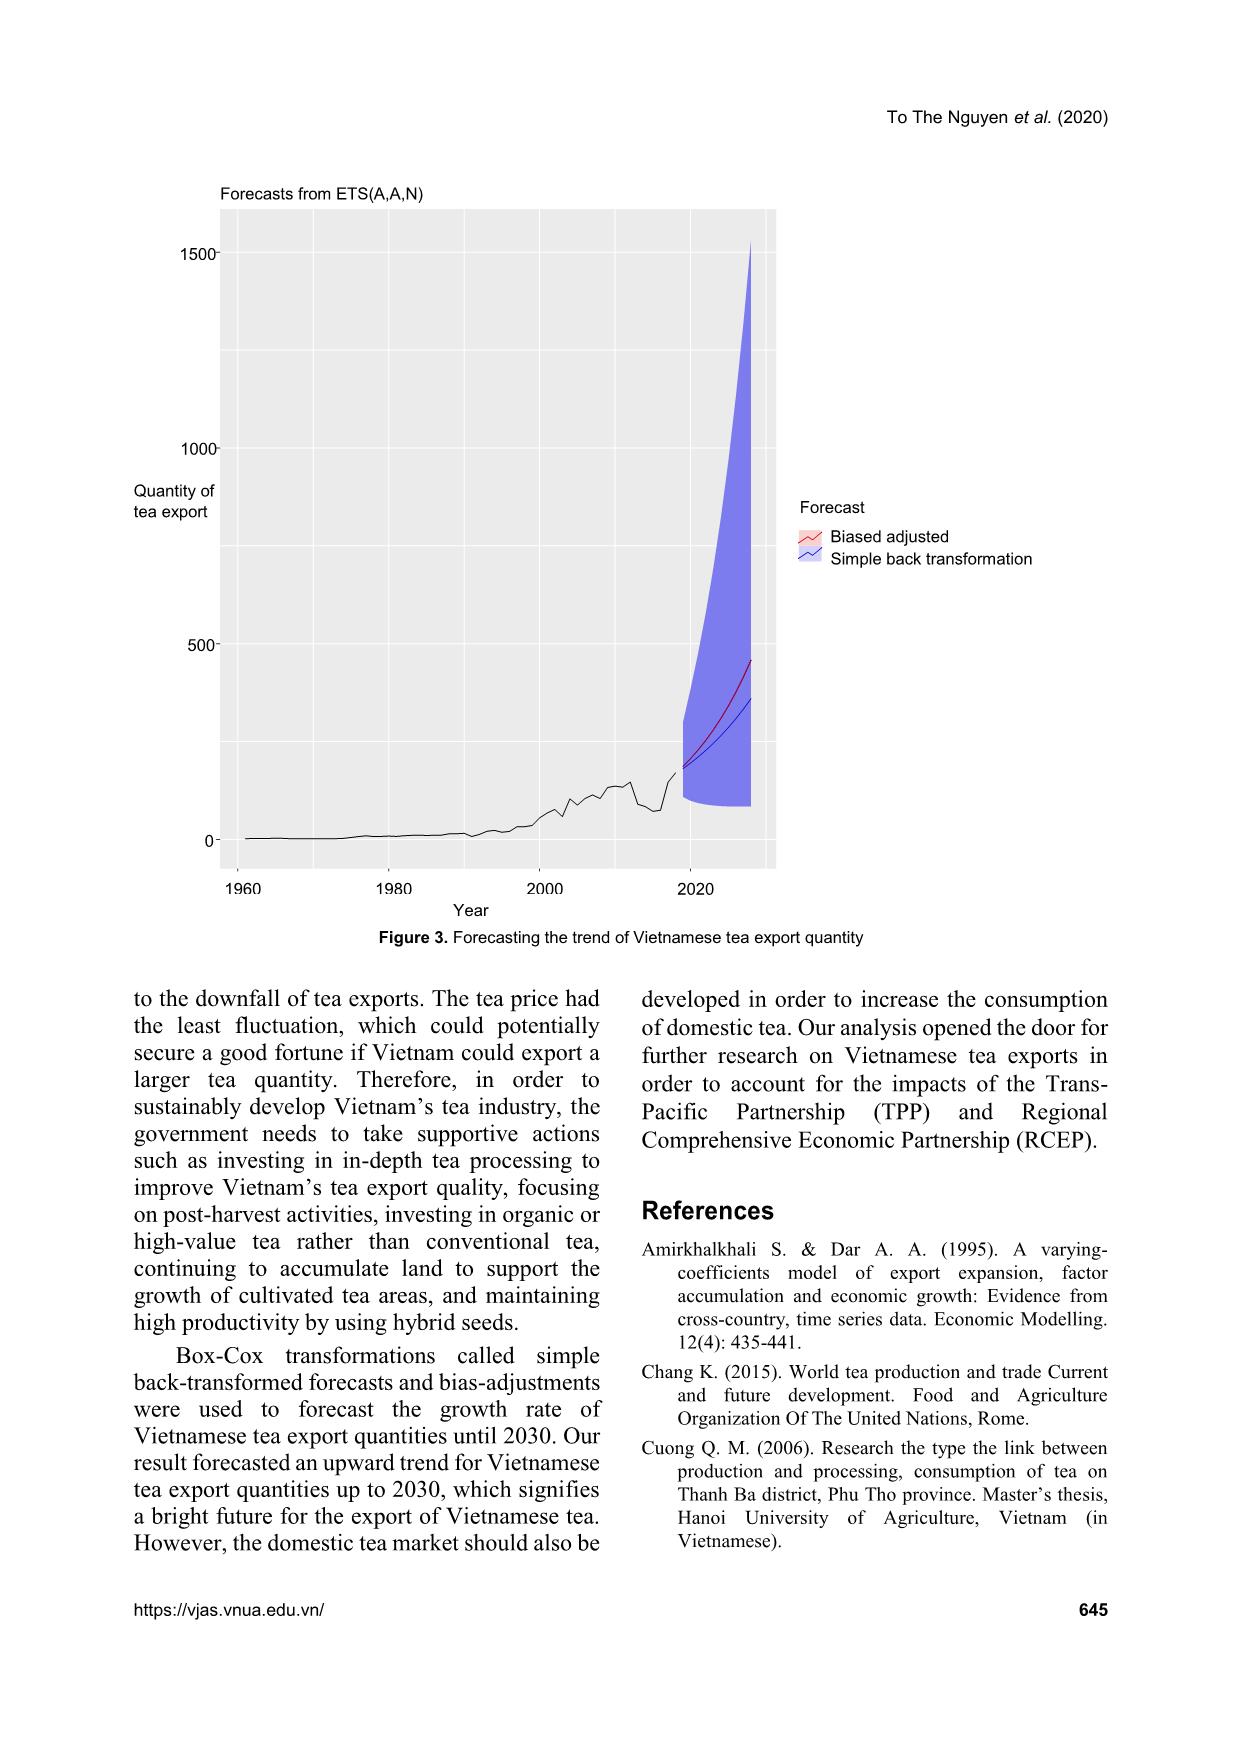
Figure 3 illustrates the forecasted changes of tea
exports up to 2030 using the two methods. It can
easily be seen that the tea export quantity
potentially grows at a significantly high rate. The
bias-adjustment method gave us a higher
increment pace of tea export quantity compared
to the conventional back-transformed forecast.
Therefore, in order to sustainably develop
Vietnam’s tea industry, the government needs to
take supportive actions such as investing in in-
depth tea processing to improve Vietnam’s tea
export quality, focusing on post-harvest
activities, investing in organic or high-value tea
rather than conventional tea, continuing to
accumulate land to support the growth of
cultivated tea areas, and maintaining high
productivity by using hybrid seeds.
The two major competitors of Vietnamese
tea exports, India and Sri Lanka, have also been
predicted to have an upward trend of total tea
production. Ghosh (2017) studied the potential
trend of India’s tea exports using 79 months of
data and produced results similar to ours.
Similarly, Kumarasinghe et al. (2018) argued
that Sri Lanka also possessed a bright future of
either producing or exporting tea in larger
quantities. In addition, Chang (2015) predicted
an increment of global tea export quantity up to
2030. In this context, the Vietnamese tea sector
should rely on these published data to carefully
plan for developing tea production effectively
and sustainably.
Conclusions
The study provided an overview of the
Vietnamese tea export situation across 58 years
from 1961 to 2018. Generally, the tea exports of
Vietnam have had an upward trend, however,
Vietnam witnessed a significant fall of the tea
export quantity during 2013-2016, although the
tea export price slightly increased. We employed
a time-series linear model to estimate the
relationship between the tea export quantity and
its determinants. Except for the total domestic
quantity, the production area, export price, and
productivity had positively significant impacts
on the tea export quantity, while the world tea
production had a negatively significant effect.
Our results suggested that in areas where tea
was planted, tea productivity increased the tea
export quantity, meanwhile, due to the rise of
other countries exporting tea of a higher quality
than Vietnamese tea, the tea export quantity led
To The Nguyen et al. (2020)
https://vjas.vnua.edu.vn/ 645
Figure 3. Forecasting the trend of Vietnamese tea export quantity
to the downfall of tea exports. The tea price had
the least fluctuation, which could potentially
secure a good fortune if Vietnam could export a
larger tea quantity. Therefore, in order to
sustainably develop Vietnam’s tea industry, the
government needs to take supportive actions
such as investing in in-depth tea processing to
improve Vietnam’s tea export quality, focusing
on post-harvest activities, investing in organic or
high-value tea rather than conventional tea,
continuing to accumulate land to support the
growth of cultivated tea areas, and maintaining
high productivity by using hybrid seeds.
Box-Cox transformations called simple
back-transformed forecasts and bias-adjustments
were used to forecast the growth rate of
Vietnamese tea export quantities until 2030. Our
result forecasted an upward trend for Vietnamese
tea export quantities up to 2030, which signifies
a bright future for the export of Vietnamese tea.
However, the domestic tea market should also be
developed in order to increase the consumption
of domestic tea. Our analysis opened the door for
further research on Vietnamese tea exports in
order to account for the impacts of the Trans-
Pacific Partnership (TPP) and Regional
Comprehensive Economic Partnership (RCEP).
References
Amirkhalkhali S. & Dar A. A. (1995). A varying-
coefficients model of export expansion, factor
accumulation and economic growth: Evidence from
cross-country, time series data. Economic Modelling.
12(4): 435-441.
Chang K. (2015). World tea production and trade Current
and future development. Food and Agriculture
Organization Of The United Nations, Rome.
Cuong Q. M. (2006). Research the type the link between
production and processing, consumption of tea on
Thanh Ba district, Phu Tho province. Master’s thesis,
Hanoi University of Agriculture, Vietnam (in
Vietnamese).
0
500
1000
1500
1960 1980 2000 2020
Year
Quantity of
tea export Forecast
Biased adjusted
Simple back transformation
Forecasts from ETS(A,A,N)
Vietnamese tea exporting and forecasting to 2030
646 Vietnam Journal of Agricultural Sciences
FAO (2019). FAOSTAT. Retrieved on May 5, 2019 at
Ghosh S. (2017). Forecasting Exports of Tea from India:
Application of Arima Model. Journal of Commerce
and Trade. 12(2): 116-129.
GSO (2019). Statistical summary book of Vietnam 2018.
General Statistics Office (in Vietnamese).
Kingu J. (2016): Determinants of Export Performance of
Tea in Tanzania: Parametric and Non-Parametric
Analysis. Amity Business Review. 11(7): 173-183.
Kumarasinghe H. P. A. S. S. & Peiris B. L. (2018).
Forecasting annual tea production in Sri Lanka.
Tropical Agricultural Research. 29(2): 184-193.
Miano G. W. (2010). Determinants of tea export supply in
Kenya (1970-2007). Ph.D. thesis, University of
Nairobi, Kenya.
Petrakis P. E., Kostis P. C. & Valsamis D. G. (2015).
Innovation and competitiveness: Culture as a long-
term strategic instrument during the European Great
Recession. Journal of Business Research. 68(7):
1436-1438.
Saigenji Y. & Zeller M. (2009). Effect of contract farming
on productivity and income of small holders: The case
of tea production in north-western Vietnam.
International Association of Agricultural Economists
Conference, Beijing, China - September 2009.
Serletis A. (1992): Export growth and Canadian economic
development. Journal of Development Economics.
38(1): 133-145.
Tran T. C., Samman E. & Rich K. (2004). The participation
of the poor in agricultural value chains: A case study
of tea. Asian Development Bank, Hanoi, Vietnam -
October 2004.
Tuan A. N. & Nguyen T. T. (2019). Efficiency and adoption
of organic tea production: Evidence from Vi Xuyen
district, Ha Giang province, Vietnam. Asia-Pacific
Journal of Regional Science. 3(1): 201-217.
Uk Polo V. (1994). Export composition and growth of
selected low-income African countries: Evidence from
time-series data. Applied Economics. 26(5): 445-449.
Vitas (2012). The 2011 Vietnam Handbook of Tea. Vietnam
Tea Association, Hanoi, Vietnam (in Vietnamese).
File đính kèm:
 vietnamese_tea_exporting_and_forecasting_to_2030.pdf

