Varietal evaluation and genetic variability in rice (Oryza sativa L.) genotypes of the Mid-Hill region of Nepal
The objectives of this study were to identify promising rice genotypes
and evaluate the genetic variance and effectiveness of selection of the
rice varieties for several yield attributing traits. A varietal trial of
fifteen rice genotypes was laid out in a randomized complete block
design (RCBD) with three replications in a farmer’s field in
Sundarbazar, Lamjung, Nepal during the rainy season of 2018.
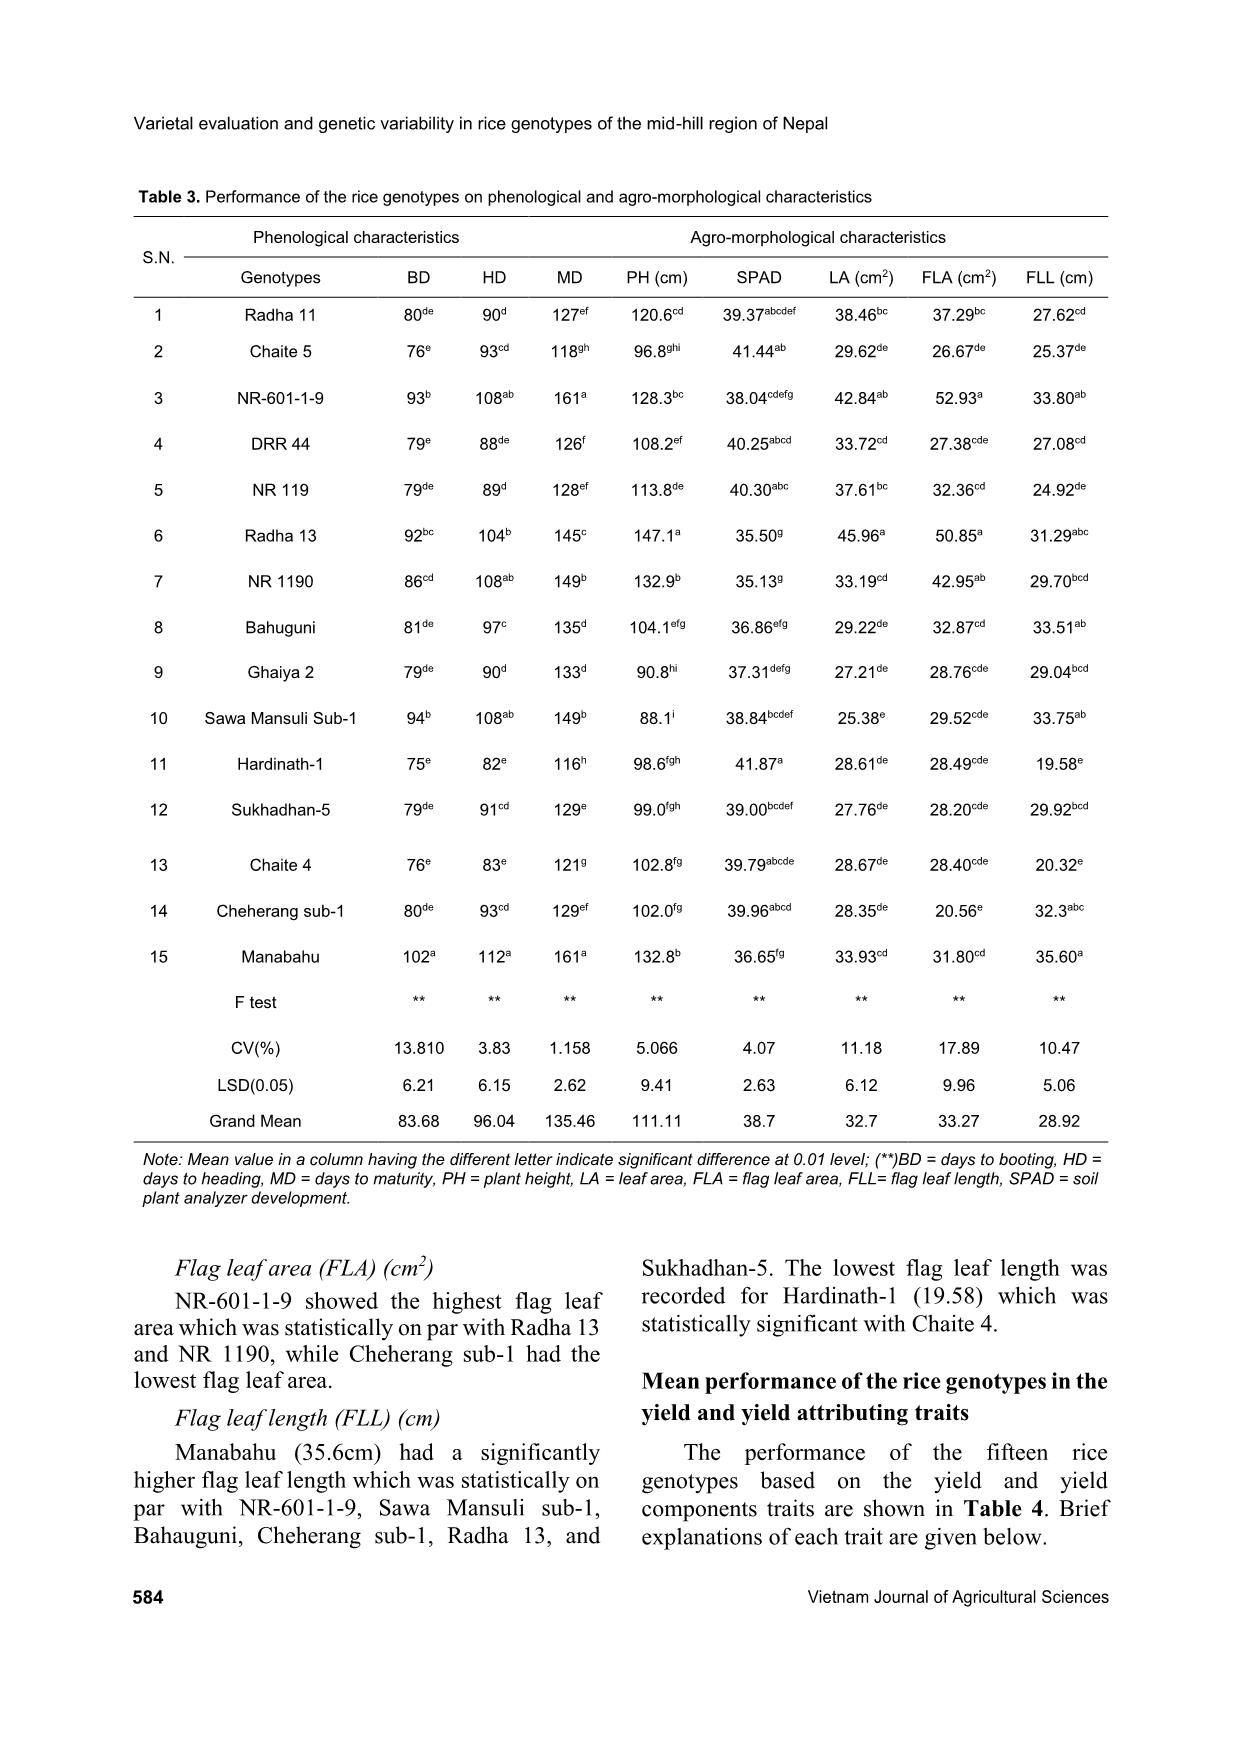
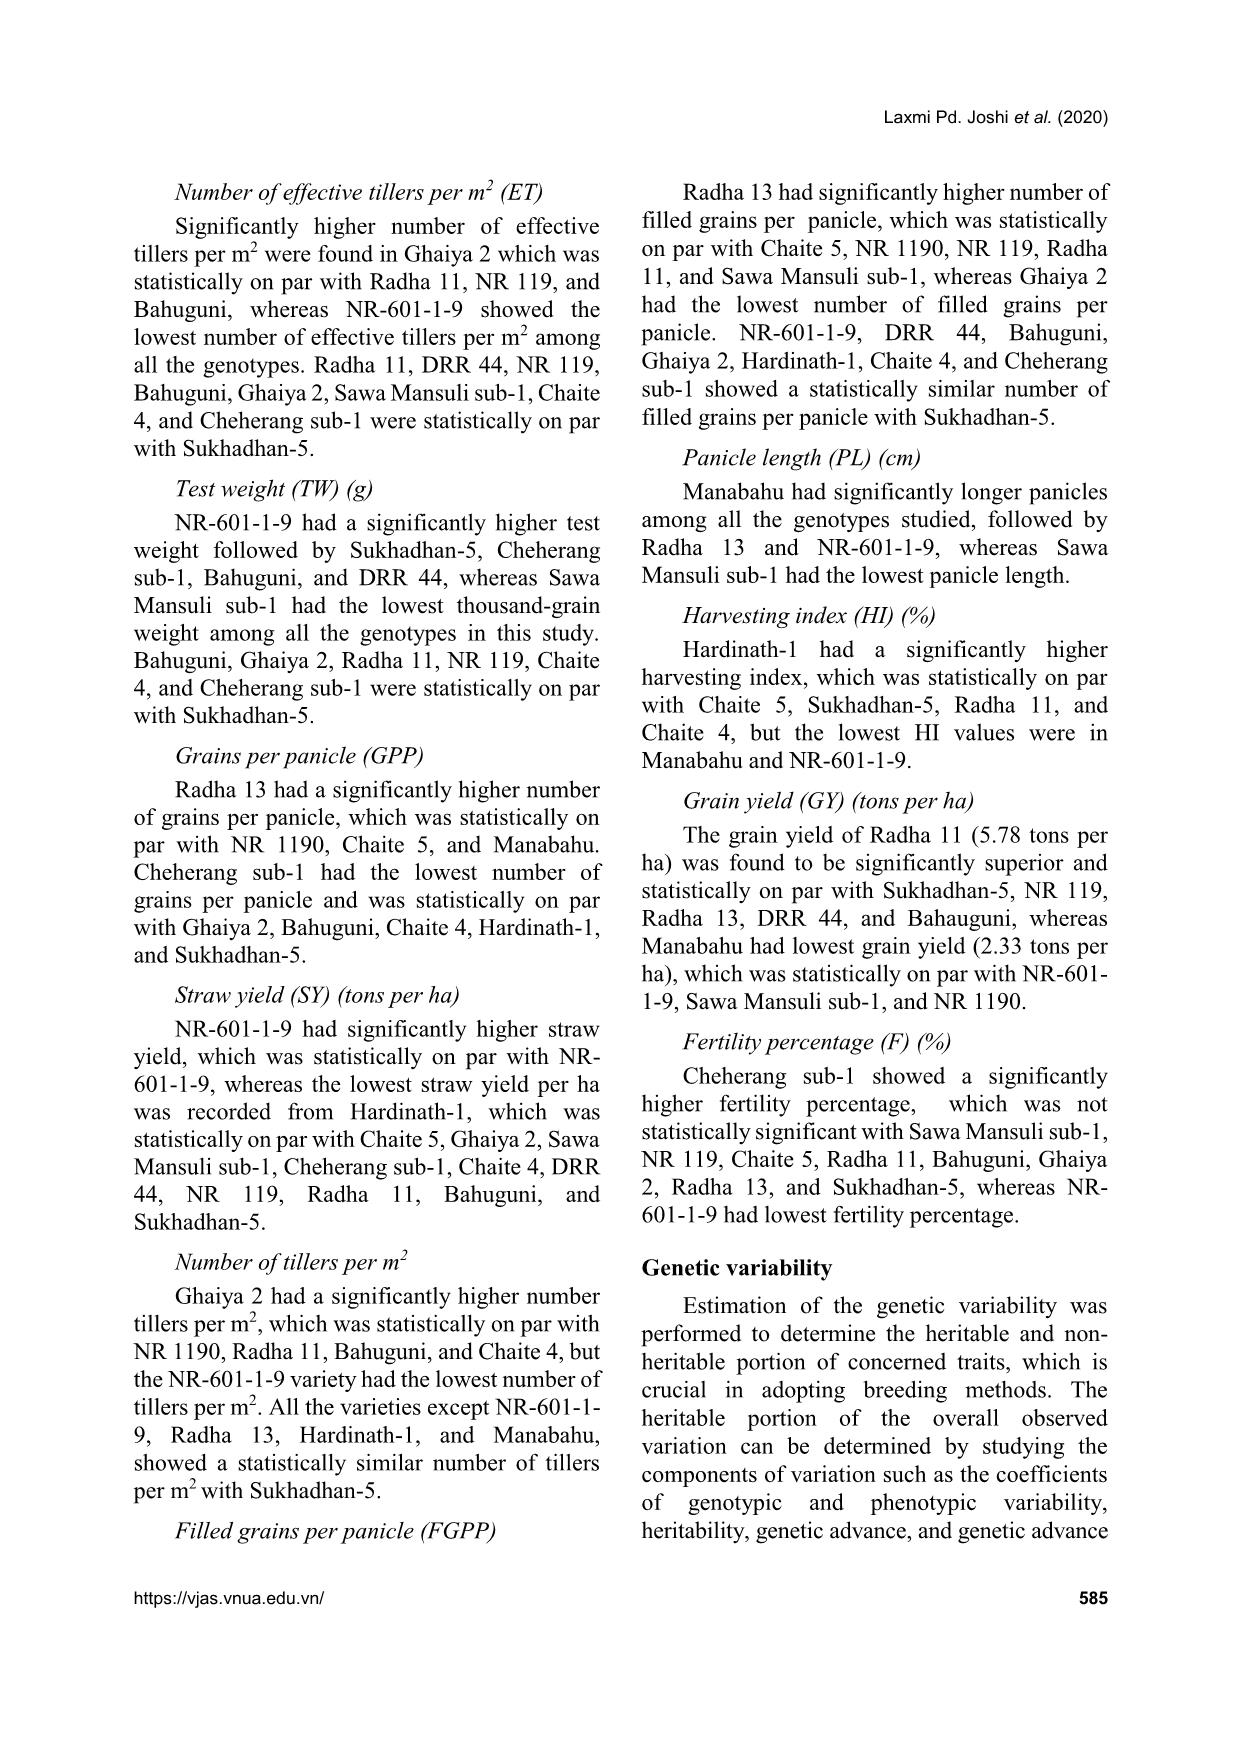
Analysis of variance indicated that all the genotypes showed
significant variation for all the traits considered. The phenotypic
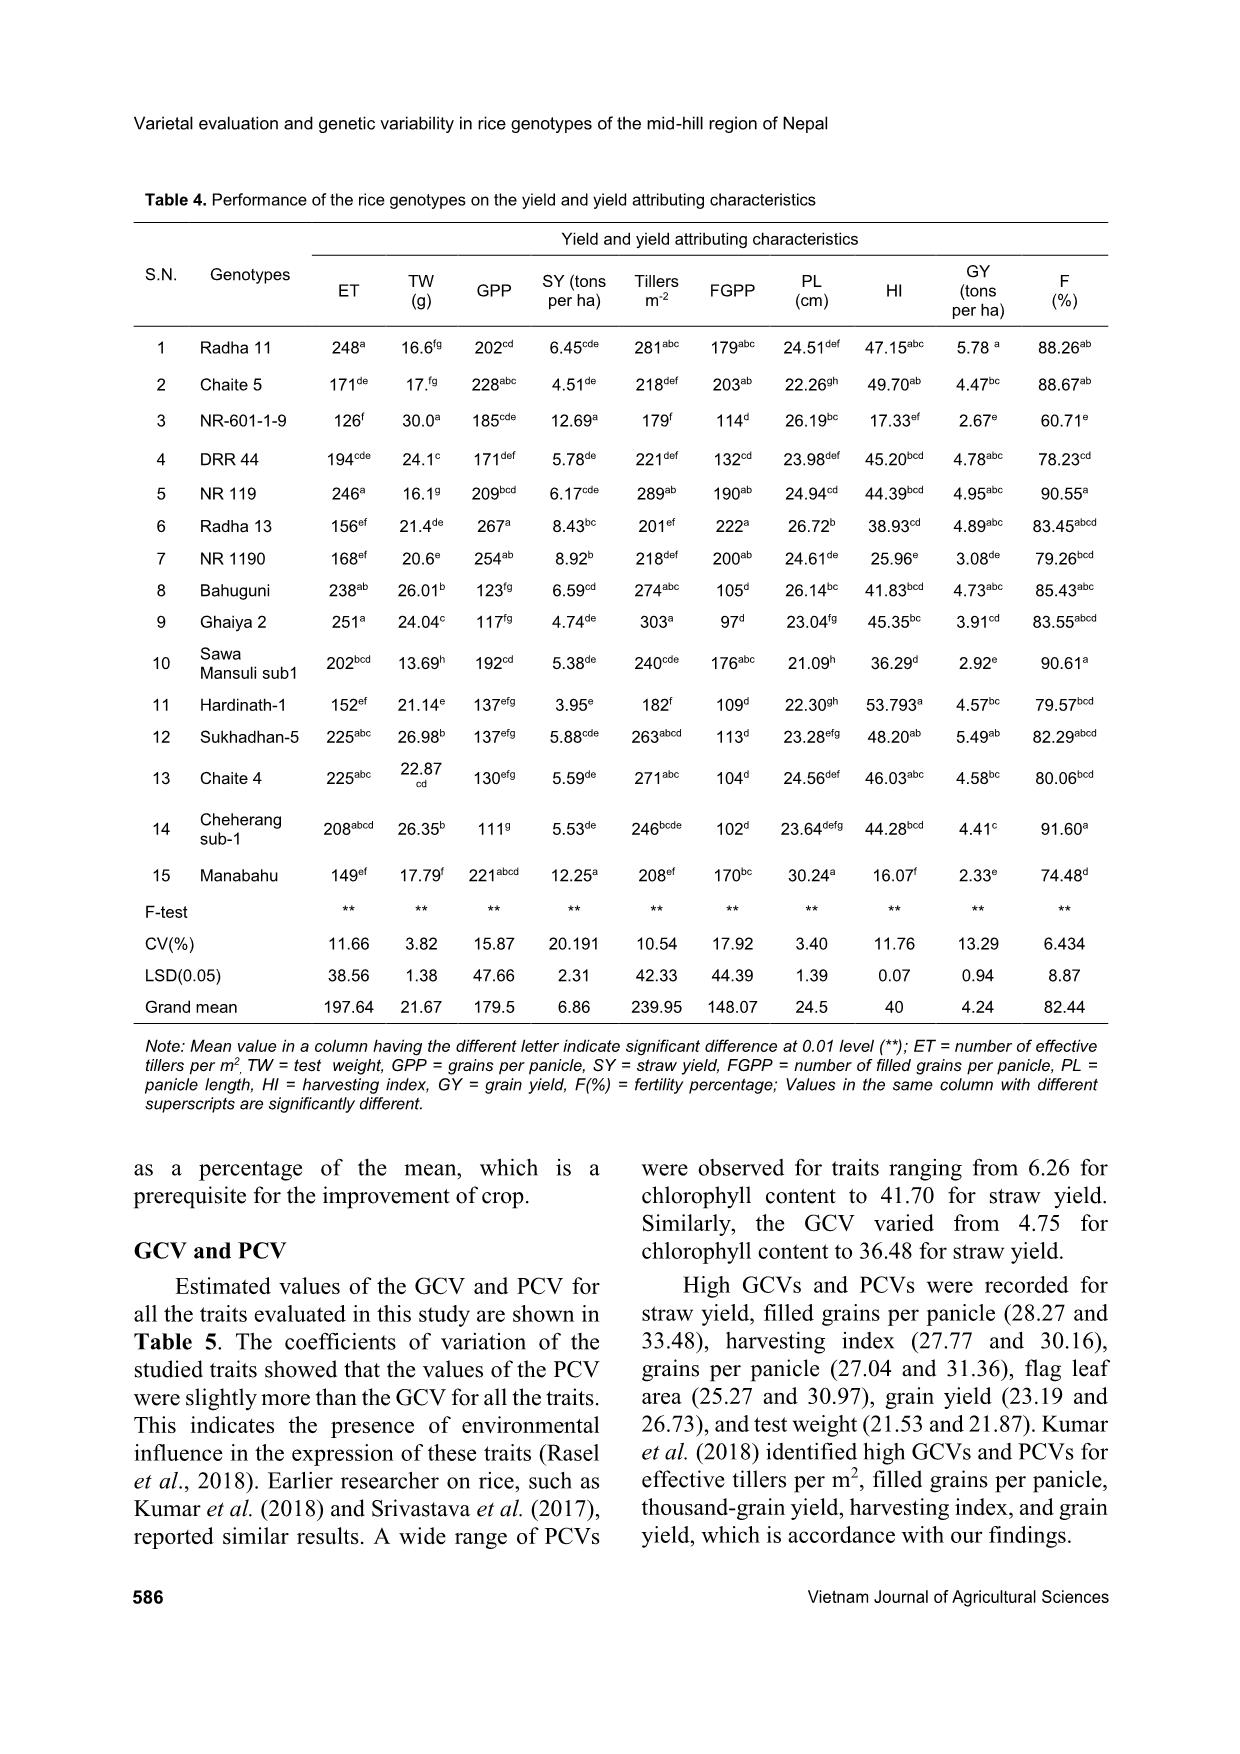
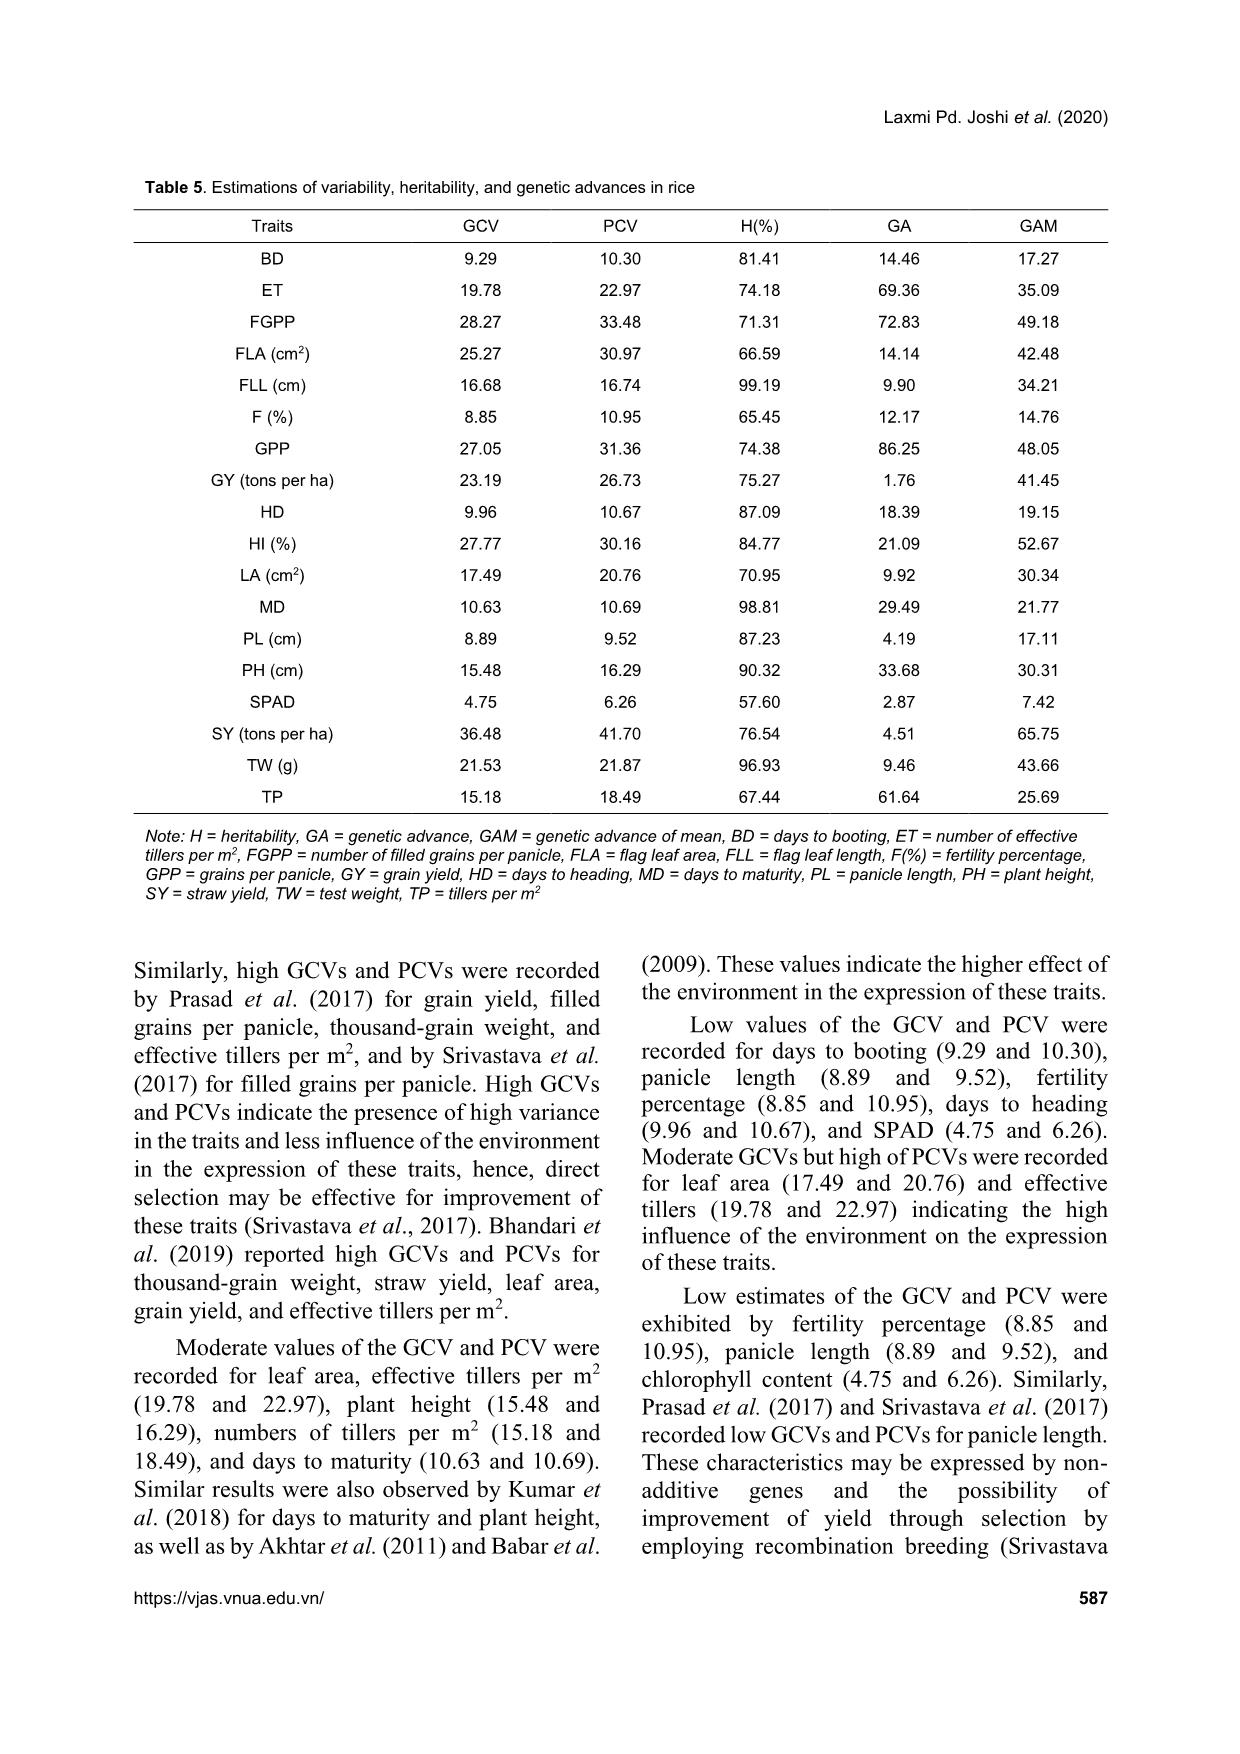
coefficient of variation (PCV) was higher than the genotypic
coefficient of variation (GCV) for all the characteristics being studied
indicating the presence of environmental influence on the traits. High
heritability coupled with high genetic advance as a percent of the
mean was found for days to physiological maturity, number of tillers
per m2, plant height, leaf area, effective tillers per m2, flag leaf area,
test weight, grains per panicle, filled grains per panicle, harvest index,
grain yield, and straw yield indicating that additive gene interaction
is present in their inheritance. Direct selection can be effective for
yield improvement in the populations through selection of these
traits. Cluster analysis based on eighteen traits grouped the fifteen
rice genotypes into four clusters. Cluster I was the largest and
consisted of five genotypes. Radha 11, NR 119, and Sukhadhan-5
were the top performing genotypes having yield potentials of 5.78,
5.49, and 4.89 tons per ha, respectively.
Trang 1
Trang 2
Trang 3
Trang 4
Trang 5
Trang 6
Trang 7
Trang 8
Trang 9
Trang 10
Tải về để xem bản đầy đủ
Tóm tắt nội dung tài liệu: Varietal evaluation and genetic variability in rice (Oryza sativa L.) genotypes of the Mid-Hill region of Nepal
heritability were recorded for days to maturity,
days to flowering grain yield, straw yield, and
plant height by Roy et al. (2015).
 High values of broad sense heritability
indicate that the traits being studied have the
scope to improve through selection. These traits
are less influenced by the environment and could
be successfully transferred to the next
generations if utilized in a hybridization program
so that superior genotypic selection can be made
through simple selection. Low heritability of
traits indicates more influence of the
environment in the phenotypic expression of that
trait and hence, selection based on progeny or
family testing should be done.
Genetic advance
Genetic advance as a percentage of the mean
was found to be highest for straw yield (65.75%)
followed by harvesting index (52.67%), filled
grains per panicle (49.18%), grains per panicle
(48.04%), thousand-grain weight (43.66%), flag
leaf area (42.48%), grain yield (41.45%),
effective tillers per m2 (35.09%), flag leaf length
(42.48%), leaf area (30.34%), plant height
(30.31%), tillers per m2 (25.69%), and days to
maturity (21.76%). Similar high values of
genetic advance as a percentage of the mean were
previously recorded by Srivastava et al. (2017)
for plant height, flag leaf length, number of
grains per panicle, filled grains per panicle, test
weight, and grain yield per plant. Medium
genetic advance as a percentage of the mean
values were found for days to booting (17.23%),
panicle length (17.11%), days to heading
(19.15%), and fertility percentage (14.75%).
Low genetic advance as a percentage of the mean
was found for SPAD reading (7.42%). High
heritability coupled with high genetic advance as
a percentage of the mean were recorded for days
to maturity, number of tillers per m2, plant height,
leaf area, flag leaf length, effective tillers per m2,
grain yield, flag leaf area, test weight, panicle
density, grains per panicle, filled grains per
panicle, harvesting index, and straw yield.
High GCVs and PCVs, heritability, and
genetic advance as a percentage of the mean were
recorded for straw yield, harvesting index, filled
grains per panicle, grains per panicle, thousand-
grain weight, flag leaf area, grain yield, effective
tillers per m2, and leaf area. These characteristics
with high values of the GCV, PCV, and heritability
Laxmi Pd. Joshi et al. (2020)
https://vjas.vnua.edu.vn/ 589
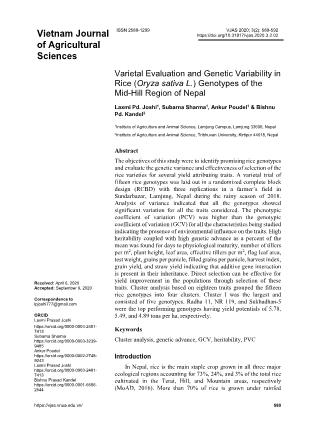
Table 6. Phenological, agro-morphological, and yield attributing traits of the rice genotypes within and among four clusters
Variable Cluster I Cluster II Cluster III Cluster IV Grand centroid
BD 79.33 83.25 89.16 84.50 83.68
HD 91.26 94.08 104.50 95.00 96.04
MD 129.60 132.83 143.75 138.83 135.46
PH (cm) 99.77 107.70 127.45 113.54 111.10
SPAD 38.58 39.69 37.18 39.96 38.69
LA (cm2) 28.24 33.79 35.68 35.72 32.70
FLL (cm) 29.02 28.34 30.49 26.69 28.92
FLA (cm2) 27.76 31.64 38.07 40.71 33.27
PL (cm) 24.13 23.63 25.95 24.24 24.50
ET 229.66 223.00 161.50 139.16 197.64
Tillers m2 271.66 258.16 211.66 180.83 239.95
FGPP 104.66 169.42 199.18 111.68 148.07
GPP 124.25 194.10 243.12 161.20 179.50
TW (g) 25.24 17.64 19.28 25.58 21.67
SY (tons ha-1) 5.67 5.94 8.53 8.32 6.86
GY (tons ha-1) 4.62 4.61 3.69 3.62 4.24
HI (%) 45.14 43.25 32.66 35.56 40.03
F (%) 84.58 86.91 81.46 70.14 82.44
Note: BD = days to booting, ET = number of effective tillers per m2, FGPP = number of filled grains per panicle, FLA = flag leaf
area, FLL = flag leaf length, F(%) = fertility percentage, GPP = grains per panicle, GY = grain yield, HD = days to heading, MD =
days to maturity, PL = panicle length, PH = plant height, SY = straw yield, TW = test weight, TP = tillers per m2
accompanied by high genetic advance as a
percentage of the mean might be transmitted to
their progenies and therefore, phenotypic
selection based on these characteristics would be
effective. Panse (1957) stated that high values of
heritability with low genetic advance indicated
that the heritability was probably due to the
effects of non-additive gene action. In general,
the characteristics that show high heritability
with high genetic advance are controlled by
additive gene action (Patil & Lokesha, 2003) and
can be improved through simple or progeny
selection methods. Selection for the traits having
high heritability coupled with high genetic
advance is likely to accumulate more additive
genes leading to further improvement of their
performance (Johnson et al., 1955). The
characteristics showing high heritability along
with moderate or low genetic advance can be
improved by intermating superior genotypes of a
segregating population developed from
combination breeding.
Cluster analysis
Cluster analysis of the fifteen rice genotypes
in this study showed that the genotypes exhibited
considerable genetic variability among
themselves by occupying four clusters as shown
in Table 6. These rice genotypes were grouped
based on phenological, agro-morphological, and
yield related traits, namely days to booting,
number of effective tillers per m2, filled grains
per panicle, flag leaf area, flag leaf length,
fertility percentage, grains per panicle, grain
yield, days to heading, harvesting index, leaf
area, days to maturity, panicle length, plant
height, SPAD reading, straw yield, test weight,
and number of tillers per m2.
Cluster analysis showed that cluster I was
comprised of five genotypes, cluster II consisted
of four genotypes, cluster III was comprised of
four genotypes, and cluster IV consisted of two
genotypes (Figure 1). Cluster II genotypes were
characterized as having the highest fertility,
Varietal evaluation and genetic variability in rice genotypes of the mid-hill region of Nepal
590 Vietnam Journal of Agricultural Sciences
smallest palnicle lengths, and lowest thousand-
grain weights. Cluster III genotypes had the
lowest SPAD readings at the time of flowering,
and the longest number of days for booting,
anthesis, and harvesting. It was also
characterized by having the longest panicle
lengths, largest numbers of grains per panicle,
largest numbers of filled grains per panicle, and
highest straw yields but lowest harvesting
indicies.
 Cluster IV contained the genotypes with
the highest SPAD readings at the time of
flowering, largest leaf areas, flag leaf areas, and
thousand-grain weights, in addition to the lowest
flag leaf lengths, and lowest numbers of total and
effective tillers per m2. Cluster I had the
genotypes that were earliest in terms of booting,
heading, and days to maturity, lowest leaf areas,
lowest flag leaf areas, and lowest numbers of
filled grains per panicle and grains per panicle. It
was comprised of genotypes with the highest
grain yields, harvesting indicies, and numbers of
effective tillers per panicle.
Conclusions
The analysis of variance study showed the
presence of adequate phenotypic variability
among the tested genotypes for all the traits in
this study. From the mean performance analysis,
it was found that Radha 11 can be selected for
higher grain yield. Radha 13 can be selected for
grains per panicle, tallest plant height, and leaf
area. Ghaiya 2 can be selected for the largest
number of panicles per m2 and effective tillers
per m2. Hardinath-1 can be selected for
maximum flag leaf area, chlorophyll content, and
earlier heading and maturity, while the local
landrace (Manabahu) also had a high values for
panicle length, straw yield, flag leaf length, and
maximum days to heading, booting, and
maturity, and can be selected for these traits. The
PCV was greater than the GCV for all the traits
being studied, meaning that some degree of
environmental influence was present in the
expression of these traits. A small difference
between the CGV and PCV suggests less
influence of the environment on the expression
of the traits. High GCVs and PCVs, higher broad
sense heritability, and higher GAM of the traits
Figure 1. Cluster analysis showing the presence of variability among the tested genotypes and groupings of four distinct genotype
clusters based on the phenological, agromorphological, and yield attributing characteristics
Observations
S
im
ila
ri
ty
N
R
-6
0
1
-1
-9
H
a
rd
in
a
th
-1
R
a
d
h
a
 1
3
N
R
 1
1
9
0
M
a
n
a
b
a
h
u
C
h
a
it
e
 5
R
a
d
h
a
 1
1
N
R
 1
1
9
S
a
w
a
 M
a
n
su
li
su
b
-1
D
R
R
 4
4
S
u
k
h
a
d
h
a
n
 5
G
h
a
iy
a
 2
S
u
k
h
a
d
h
a
n
-5
C
h
e
h
e
ra
n
g
 s
u
b
-1
C
h
a
it
e
 4
B
a
h
u
g
u
n
i
37.57
58.38
79.19
100.00
Laxmi Pd. Joshi et al. (2020)
https://vjas.vnua.edu.vn/ 591
straw yield, filled grains per panicle, harvesting
index, grains per panicle, flag leaf area, grain
yield, thousand-grain weight, effective tillers per
m2, and leaf area indicates that there is less
influence of the environment in the expression of
these traits. A higher proportion of variability is
heritable and improvement can be made for these
traits in the next generation through direct
selection. High broad sense heritability and
genetic advance for these traits indicate the
presence of additive gene interaction in the
expression of quantitative traits and showed
more opportunity for selection of these traits for
improvements in yield. Cluster analysis showed
the presence of considerable genetic variability
among the genotypes for further improvement of
the genotypes.
References
Abebe T. S., Alamerew S. & Tulu L. (2017). Genetic
variability, heritability and genetic advance for yield
and its related traits in rainfed lowland rice (Oryza
sativa L.) genotypes at Fogera and Pawe, Ethiopia.
Advanced Crop Science Technology. 5: 272.
Adhikari B. N., Joshi B. P., Shrestha J. & Bhatta N. R.
(2018). Genetic variability, heritability, genetic
advance and correlation among yield and yield
components of rice (Oryza sativa L.). Journal of
Agriculture and Natural Resources. 1(1): 149-160.
Akhter N., Nazir M. F., Rabnawz A., Mahmood T., Safdar
M. E., Asif M. & Rehman A. (2011). Estimation of
heritability, correlation and path coefficient analysis in
fine grain rice (Oryza sativa). The Journal of Animal
and Plant Sciences. 21(4): 660-664.
Akinwale M. G., Gregorio G., Nwilene F. & Akinyele B.
O. (2011). Heritability and correlation coefficient
analysis for yield and its components in rice (Oryza
sativa L.). African Journal of Plant Science. 5(3): 207-
212.
Babar M., Khan A. & Arif A. (2009). Path analysis of some
leaf and panicle traits affecting grain yield in double
haploid lines of rice (Oryza sativa L.). World Journal
of Agricultural Sciences. 45(4): 245-252.
Bhandari K., Poudel A., Sharma S., Kandel B. P. &
Upadhyay K. (2019). Genetic variability, correlation
and path analysis of rice genotypes in rainfed condition
at Lamjung, Nepal. RJOAS. 8(92): 274-280. DOI:
10.18551/rjoas.2019-08.30.
Chaudhary L. B. & Prasad B. (1968). Genetic variation and
heritability of quantitative characters in Indian mustard
(Brassica juncea). Indian Journal of Agricultural
Science. 38: 820-825.
Deshmukh S. N., Basu M. S. & Reddi P. S. (1986). Genetic
variability, character association and path coefficient
of quantitative traits in Virginia bunch varieties of
groundnut. Indian Journal of Agriculture. 56: 816-821.
Falconer D. S. & Mackay T. F. C. (1996). An introduction
to Quantitative Genetics (4th ed.). London, L; Prentice
Hall.
Gyawali S., Poudel A. & Poudel S. (2018). Genetic
variability and association analysis in different rice
genotypes in Mid-Hill of western Nepal. Acta
Scientific Agriculture. 2(9): 69-76.
Johnson H. W., Robinson H. F. & Comstock R. E. (1955).
Estimates of genetic and environmental variability in
soybean. Agronomy Journal. 47: 314-318.
Kandel B. P., Adhikari N. R., Poudel A. & Tripathi M. P.
(2019). Genetic variability estimates of hybrid maize
genotypes in inner terai of Nepal. Azarian Journal of
Agriculture. 6(6): 164-170.
Kumar S., Chauhan M. P. & Tomar A. (2018). Coefficient
of variation (GCV & PCV), heritability and genetic
advance analysis for yield contributing characters in
rice (Oryza sativa L.). Journal of Pharmacognosy and
Phytochemistry. 7(3): 2161-2164.
MoAD (2016). Statistical Information on Nepalese
Agriculture, Ministry of Agriculture Development.
NARC (2009). Annual report of Nepal Agriculture
Research Council (2007/2008). Retrieved on October
5, 2019 at
r_see&id=6638.
Pandey P., Anurag J. P. & Tiwari D. K. (2009). Genetic
variability, diversity and association of quantitative
traits with grain yield in rice (Oryza sativa L.). Journal
of Bio-Science. 17(1): 77-82.
Panse V. G. (1957). Genetics of quantitative characters in
relation to plant breeding. Indian Journal of Genetics.
17: 318-328.
Panwar A., Dhaka R. P. S. & Kumar V. (2007). Genetic
variability and heritability studies in rice. Advances in
Plant Sciences. 20(1): 47-49.
Patil M. K. & Lokesha R. (2003). Estimation of Genetic
variability, heritability, genetic advance, correlations
and path analysis in advanced mutant breeding lines of
Sesame (Sesamum indicum L.). Journal of
Pharmacognosy and Natural Products. 4151.
Prasad R. K., Radhakrishna K. V. & Bhave M. H. V.
(2017). Genetic variability, heritability and genetic
advance in boro rice (Oryza sativa L.) germplasm.
International Journal of Current Microbiology and
Applied Sciences. 6(4): 1261-1266.
Rasel M. L., Hassan M., Hoqu I. U. & Saha S. R. (2018).
Estimation of genetic variability, correlation and path
coefficient analysis in local landraces of rice (Oryza
sativa L.) for the improvement of salinity tolerance.
Journal of the Bangladesh Agricultural University.
16(1): 41-46.
Varietal evaluation and genetic variability in rice genotypes of the mid-hill region of Nepal
592 Vietnam Journal of Agricultural Sciences
Robinson H. F., Cornstock R. E. & Harvey P. H. (1949).
Estimates of heritability and degree of dominance in
corn. Agronomy Journal. 41: 353-359.
Srivastava N., Babu G. S. & Singh O. N. (2017). Genetic
variation, heritability and diversity analysis of exotic
upland rice (Oryza sativa L.) germplasms based on
quantitative traits. The Pharma Innovation Journal.
6(12): 316-320.
Yadav R. K., Gurung R., Dhakal R., Adhikari A. R.,
Gautam S., Ghimire K. H. Sthapit B. R. (2019). On-
farm diversity assessment and participatory varietal
evaluation of cold-tolerant rice in Mid-hills of Nepal.
Journal of Crop Science and Biotechnology. 22: 403-
414. DOI: 10.1007/s12892-018-0167-0.
.
File đính kèm:
 varietal_evaluation_and_genetic_variability_in_rice_oryza_sa.pdf

