Variations in growth performance and nitrogen uptake of sugarcane cultivars under rain-fed conditions
The experiment was conducted to evaluate growth and nitrogen uptake of the twelve sugarcane varieties, viz. NiF3, NiF8, Ni9, Ni12, Ni15, Ni17, Ni21, Ni22, Ni25, Ni27, Ni28, and Ni29, under rain-Fed conditions during the period from 70 to 160 days after transplanting (DAT) at the experimental field, Faculty of Agriculture, University of the Ryukyus, Okinawa, Japan. The results showed that water shortage from a rain-fed condition caused reductions, but not significant in plant height and SPAD of sugarcane varieties. The genetic variation in leaf area, yield components, partial and total biomass, and cane yield was found among the investigated varieties. The positive associations between total nitrogen uptake with total biomass production and cane yield suggested that higher nitrogen uptake supports better growth performance of sugarcane under rainfed conditions. From this study, NiF3 and Ni27 could be introduced as the promising sugarcane varieties for better growth performance and high nitrogen uptake under rain-fed conditions
Trang 1
Trang 2
Trang 3
Trang 4
Trang 5
Trang 6
Trang 7
Trang 8
Trang 9
Tóm tắt nội dung tài liệu: Variations in growth performance and nitrogen uptake of sugarcane cultivars under rain-fed conditions
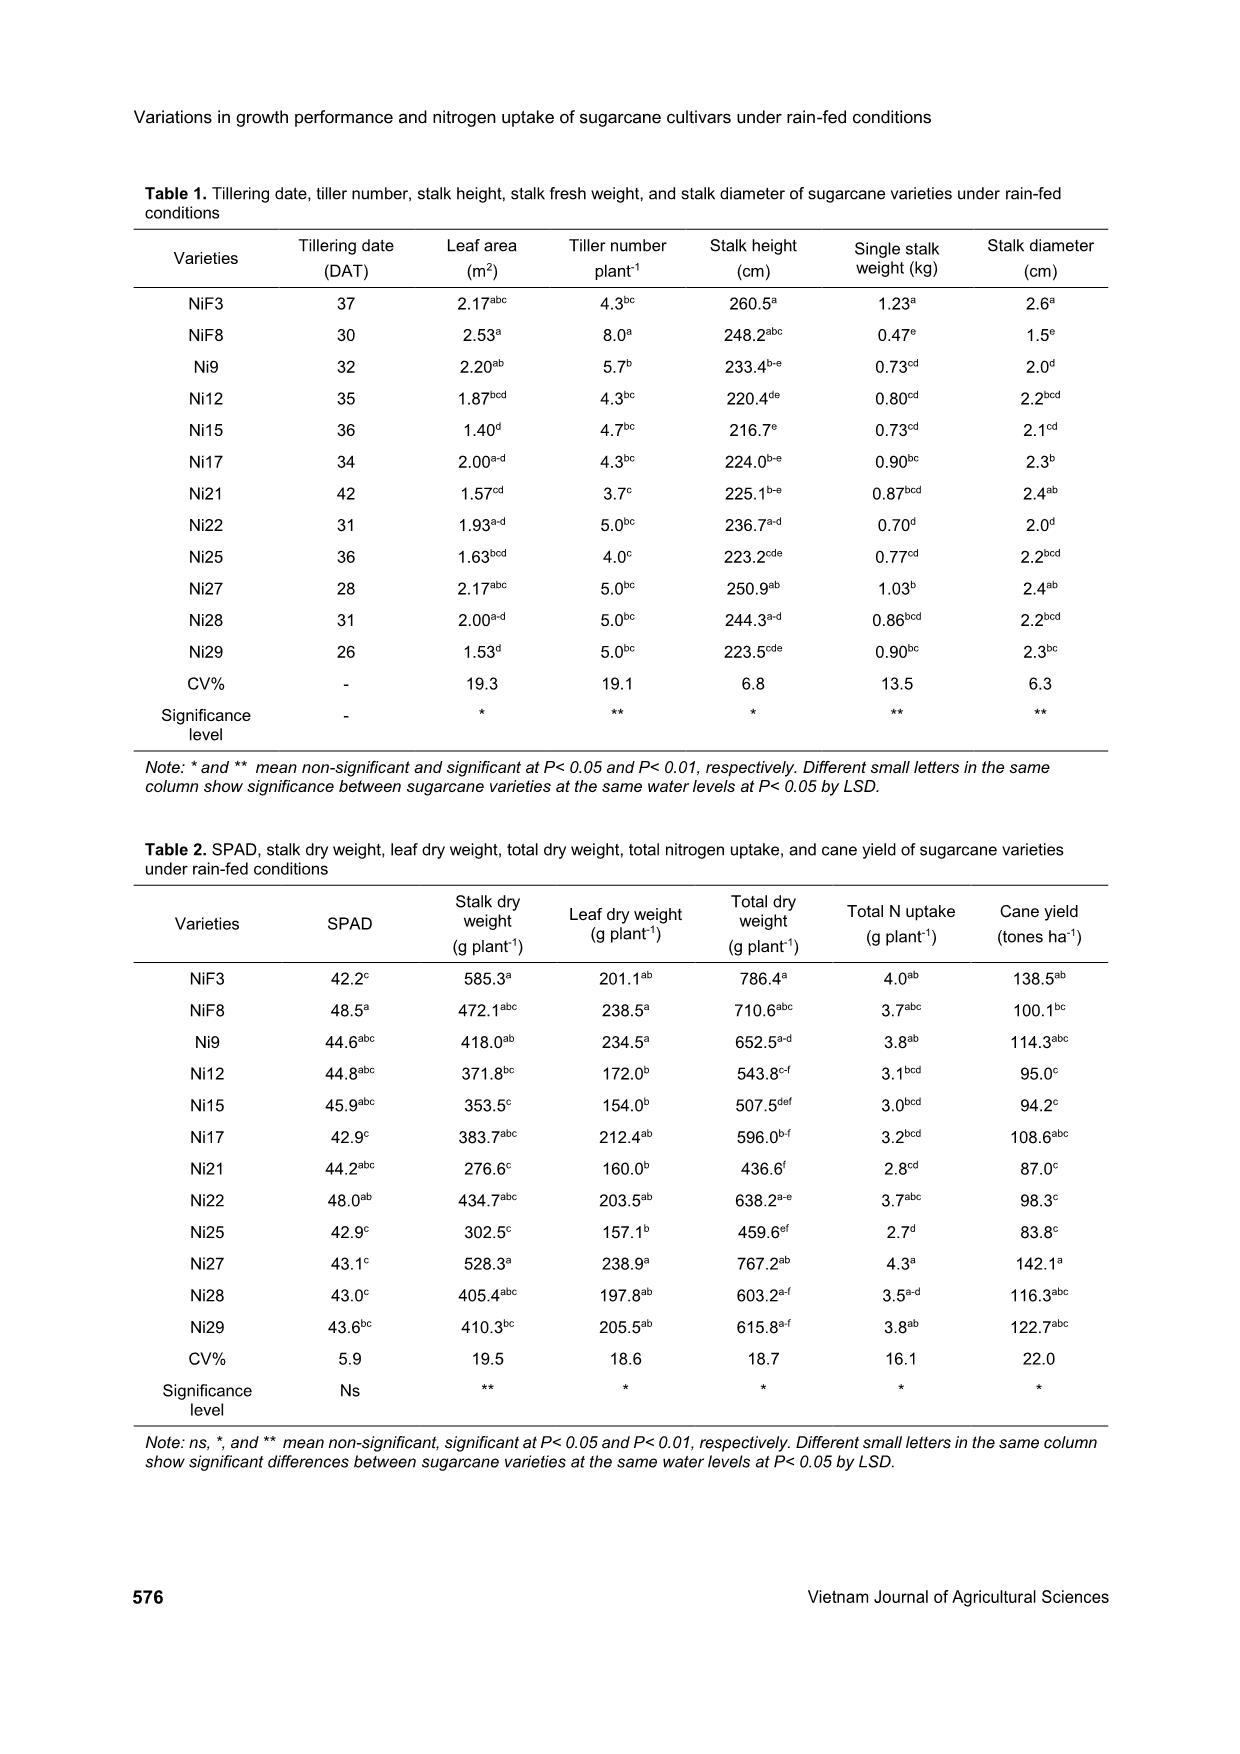
 35 1.87bcd 4.3bc 220.4de 0.80cd 2.2bcd
Ni15 36 1.40d 4.7bc 216.7e 0.73cd 2.1cd
Ni17 34 2.00a-d 4.3bc 224.0b-e 0.90bc 2.3b
Ni21 42 1.57cd 3.7c 225.1b-e 0.87bcd 2.4ab
Ni22 31 1.93a-d 5.0bc 236.7a-d 0.70d 2.0d
Ni25 36 1.63bcd 4.0c 223.2cde 0.77cd 2.2bcd
Ni27 28 2.17abc 5.0bc 250.9ab 1.03b 2.4ab
Ni28 31 2.00a-d 5.0bc 244.3a-d 0.86bcd 2.2bcd
Ni29 26 1.53d 5.0bc 223.5cde 0.90bc 2.3bc
CV% - 19.3 19.1 6.8 13.5 6.3
Significance
level
- * ** * ** **
Note: * and ** mean non-significant and significant at P< 0.05 and P< 0.01, respectively. Different small letters in the same
column show significance between sugarcane varieties at the same water levels at P< 0.05 by LSD.
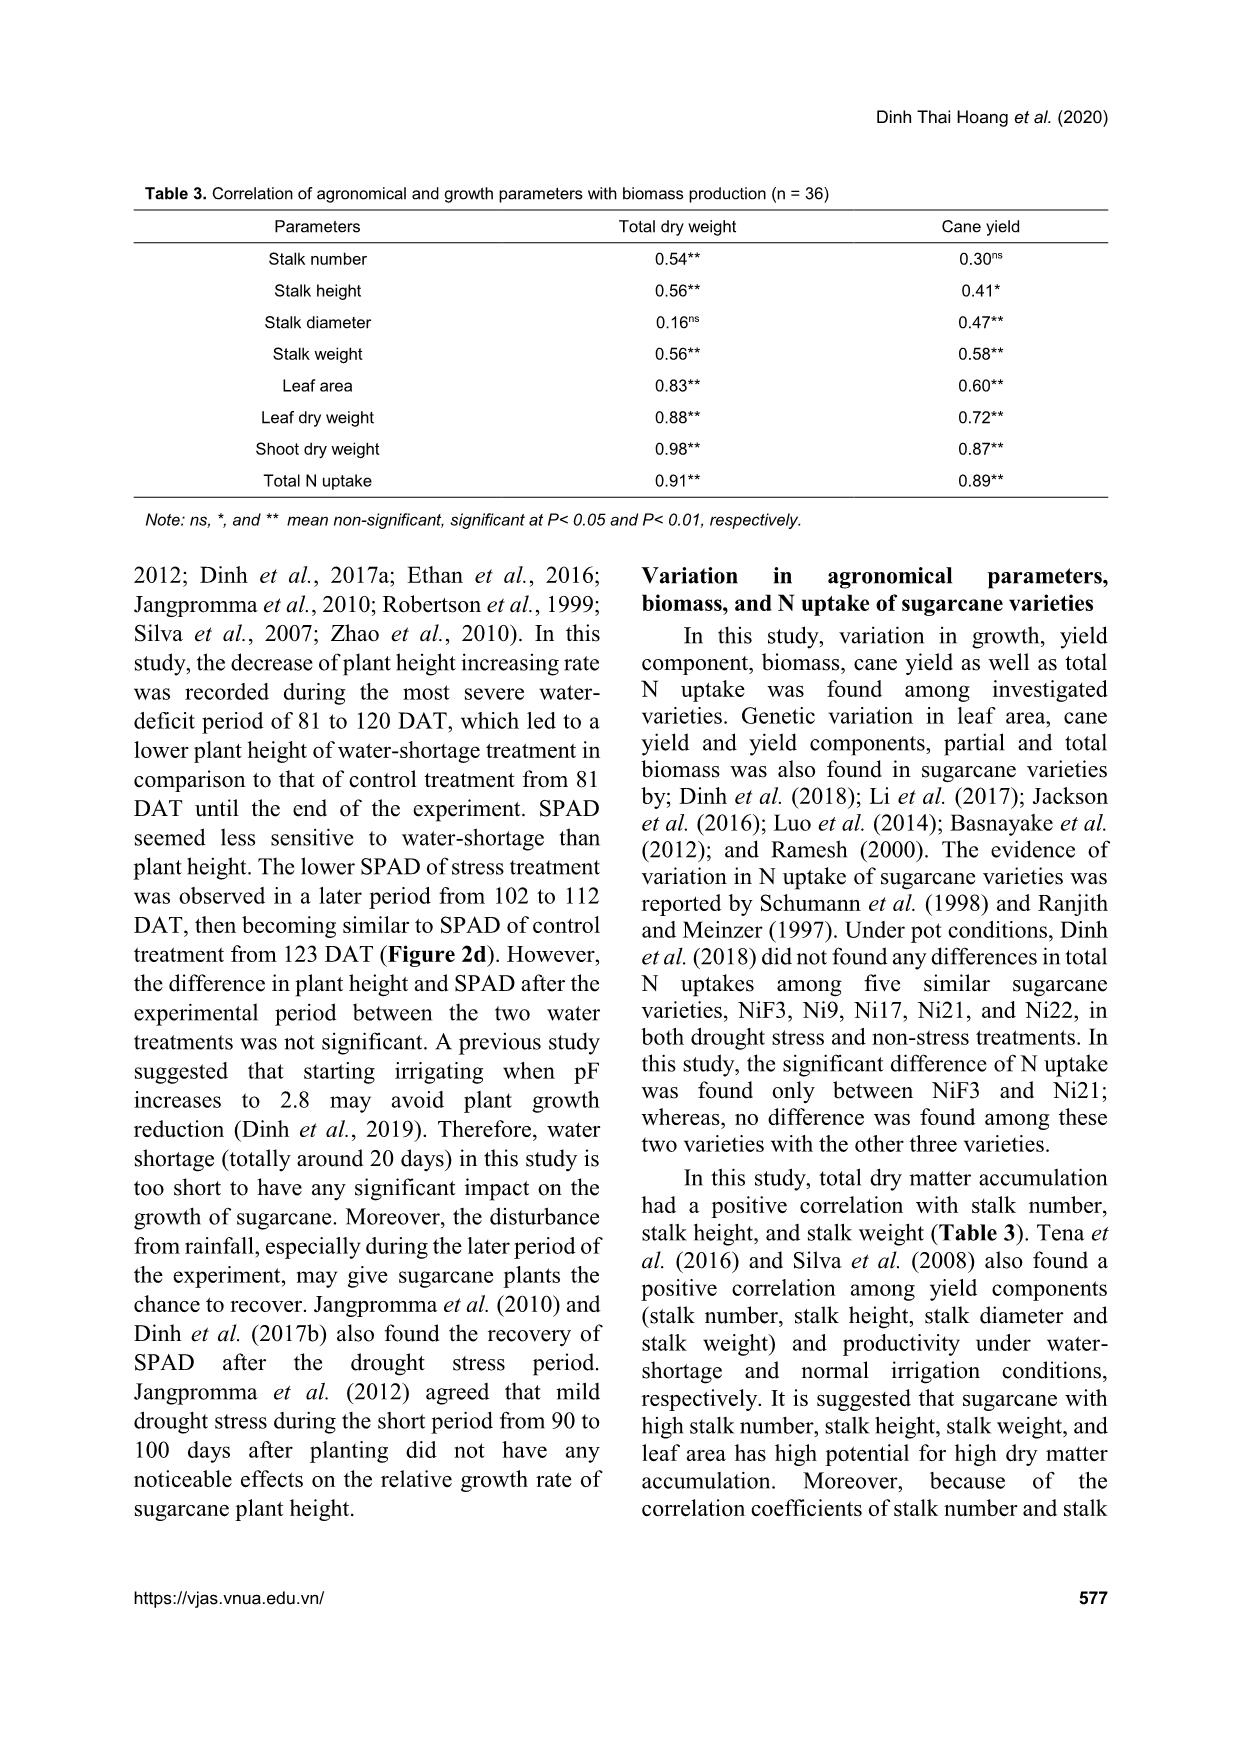
Table 2. SPAD, stalk dry weight, leaf dry weight, total dry weight, total nitrogen uptake, and cane yield of sugarcane varieties
under rain-fed conditions
Varieties SPAD
Stalk dry
weight
(g plant-1)
Leaf dry weight
(g plant-1)
Total dry
weight
(g plant-1)
Total N uptake
(g plant-1)
Cane yield
(tones ha-1)
NiF3 42.2c 585.3a 201.1ab 786.4a 4.0ab 138.5ab
NiF8 48.5a 472.1abc 238.5a 710.6abc 3.7abc 100.1bc
Ni9 44.6abc 418.0ab 234.5a 652.5a-d 3.8ab 114.3abc
Ni12 44.8abc 371.8bc 172.0b 543.8c-f 3.1bcd 95.0c
Ni15 45.9abc 353.5c 154.0b 507.5def 3.0bcd 94.2c
Ni17 42.9c 383.7abc 212.4ab 596.0b-f 3.2bcd 108.6abc
Ni21 44.2abc 276.6c 160.0b 436.6f 2.8cd 87.0c
Ni22 48.0ab 434.7abc 203.5ab 638.2a-e 3.7abc 98.3c
Ni25 42.9c 302.5c 157.1b 459.6ef 2.7d 83.8c
Ni27 43.1c 528.3a 238.9a 767.2ab 4.3a 142.1a
Ni28 43.0c 405.4abc 197.8ab 603.2a-f 3.5a-d 116.3abc
Ni29 43.6bc 410.3bc 205.5ab 615.8a-f 3.8ab 122.7abc
CV% 5.9 19.5 18.6 18.7 16.1 22.0
Significance
level
Ns ** * * * *
Note: ns, *, and ** mean non-significant, significant at P< 0.05 and P< 0.01, respectively. Different small letters in the same column
show significant differences between sugarcane varieties at the same water levels at P< 0.05 by LSD.
Dinh Thai Hoang et al. (2020)
https://vjas.vnua.edu.vn/ 577
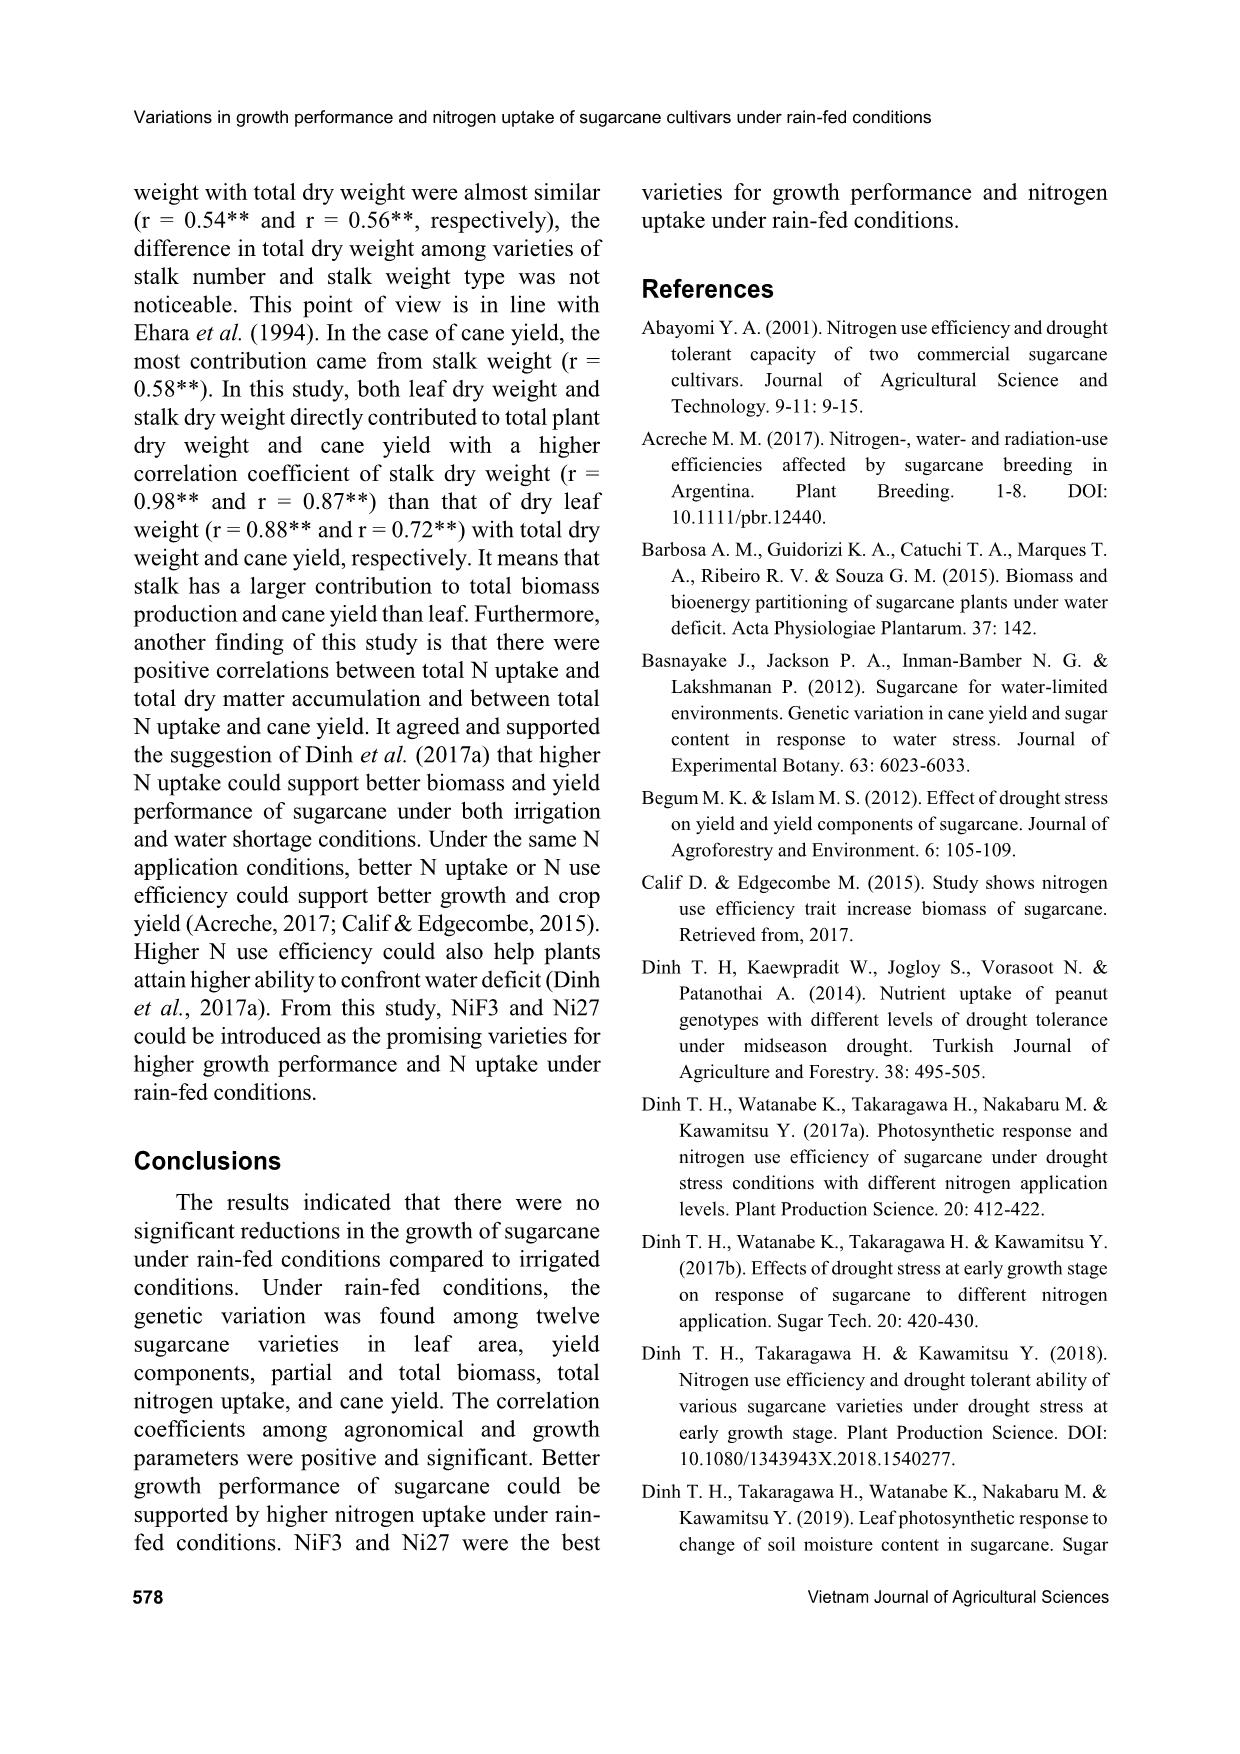
Table 3. Correlation of agronomical and growth parameters with biomass production (n = 36)
Parameters Total dry weight Cane yield
Stalk number 0.54** 0.30ns
Stalk height 0.56** 0.41*
Stalk diameter 0.16ns 0.47**
Stalk weight 0.56** 0.58**
Leaf area 0.83** 0.60**
Leaf dry weight 0.88** 0.72**
Shoot dry weight 0.98** 0.87**
Total N uptake 0.91** 0.89**
Note: ns, *, and ** mean non-significant, significant at P< 0.05 and P< 0.01, respectively.
2012; Dinh et al., 2017a; Ethan et al., 2016;
Jangpromma et al., 2010; Robertson et al., 1999;
Silva et al., 2007; Zhao et al., 2010). In this
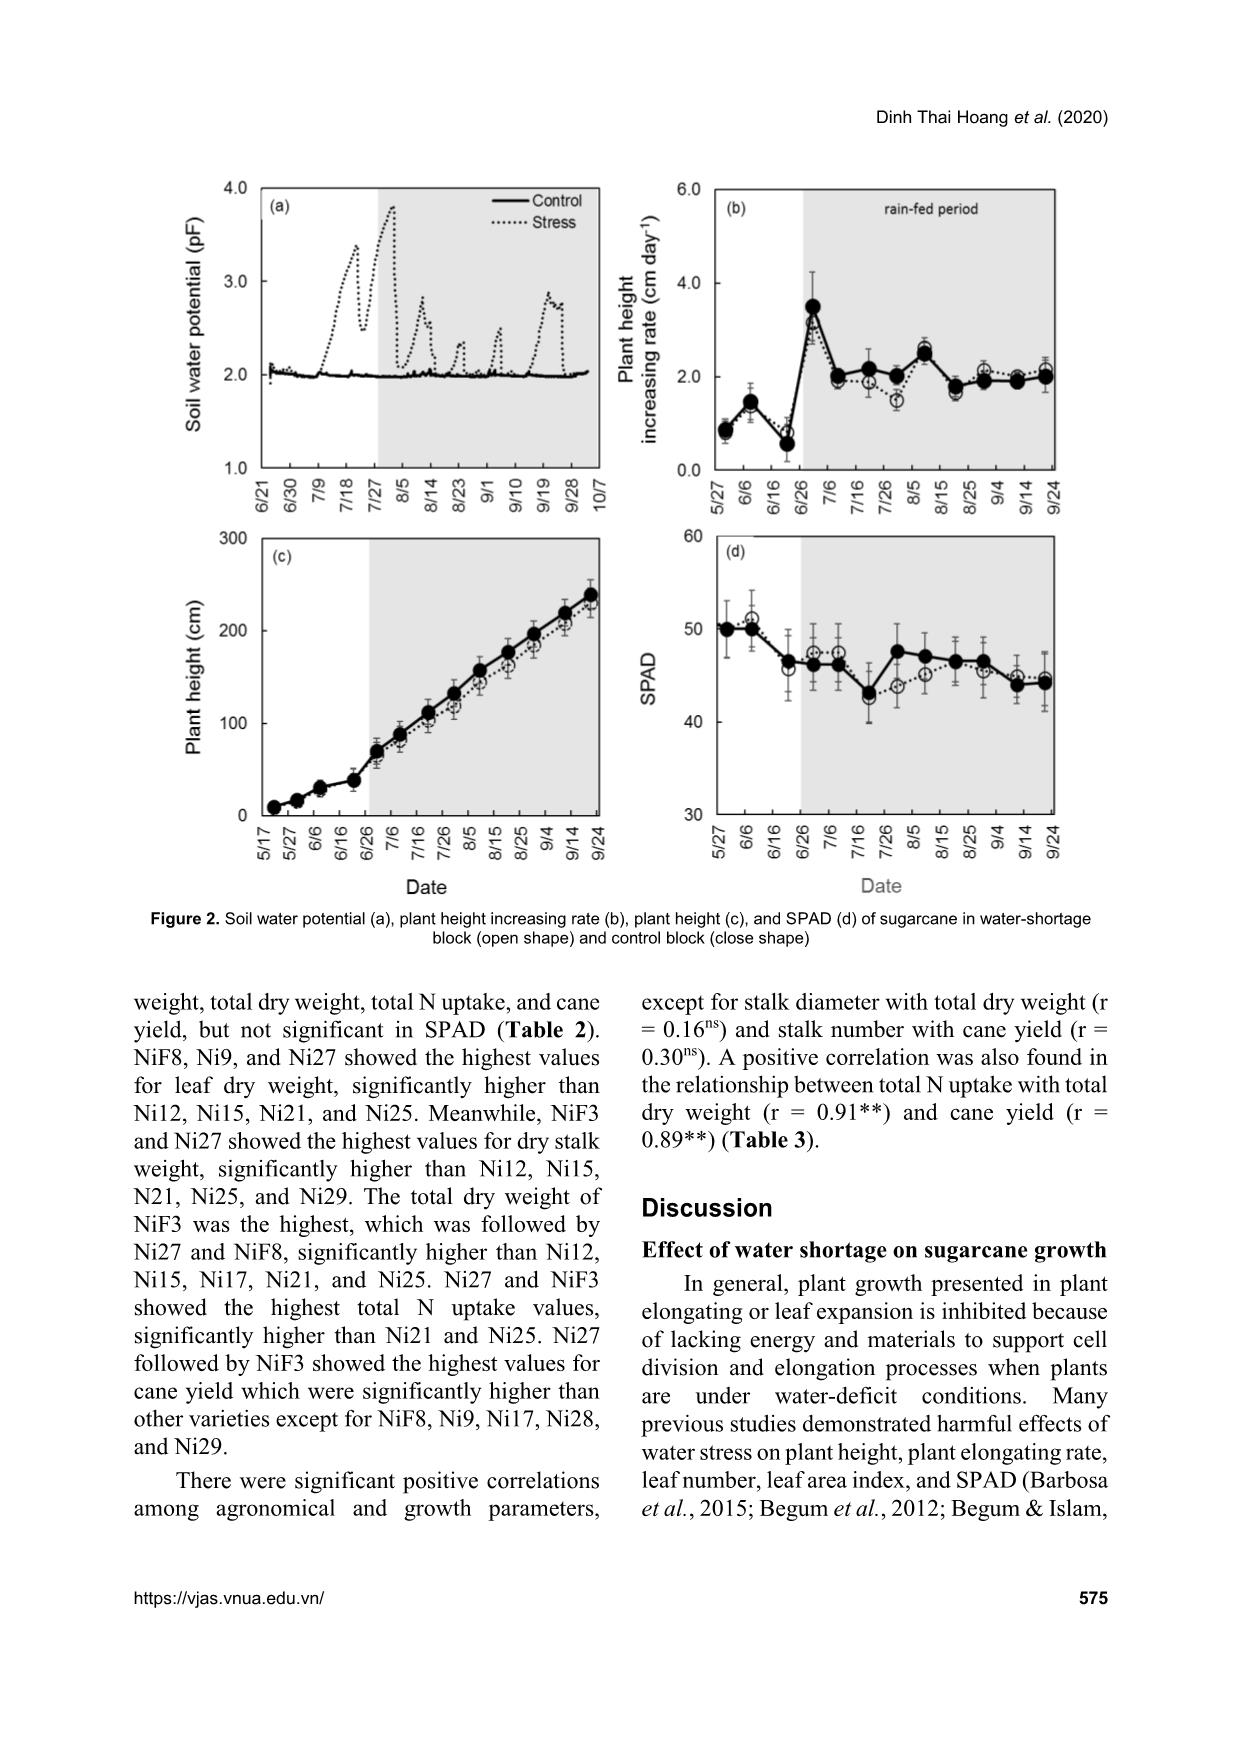
study, the decrease of plant height increasing rate
was recorded during the most severe water-
deficit period of 81 to 120 DAT, which led to a
lower plant height of water-shortage treatment in
comparison to that of control treatment from 81
DAT until the end of the experiment. SPAD
seemed less sensitive to water-shortage than
plant height. The lower SPAD of stress treatment
was observed in a later period from 102 to 112
DAT, then becoming similar to SPAD of control
treatment from 123 DAT (Figure 2d). However,
the difference in plant height and SPAD after the
experimental period between the two water
treatments was not significant. A previous study
suggested that starting irrigating when pF
increases to 2.8 may avoid plant growth
reduction (Dinh et al., 2019). Therefore, water
shortage (totally around 20 days) in this study is
too short to have any significant impact on the
growth of sugarcane. Moreover, the disturbance
from rainfall, especially during the later period of
the experiment, may give sugarcane plants the
chance to recover. Jangpromma et al. (2010) and
Dinh et al. (2017b) also found the recovery of
SPAD after the drought stress period.
Jangpromma et al. (2012) agreed that mild
drought stress during the short period from 90 to
100 days after planting did not have any
noticeable effects on the relative growth rate of
sugarcane plant height.
Variation in agronomical parameters,
biomass, and N uptake of sugarcane varieties
In this study, variation in growth, yield
component, biomass, cane yield as well as total
N uptake was found among investigated
varieties. Genetic variation in leaf area, cane
yield and yield components, partial and total
biomass was also found in sugarcane varieties
by; Dinh et al. (2018); Li et al. (2017); Jackson
et al. (2016); Luo et al. (2014); Basnayake et al.
(2012); and Ramesh (2000). The evidence of
variation in N uptake of sugarcane varieties was
reported by Schumann et al. (1998) and Ranjith
and Meinzer (1997). Under pot conditions, Dinh
et al. (2018) did not found any differences in total
N uptakes among five similar sugarcane
varieties, NiF3, Ni9, Ni17, Ni21, and Ni22, in
both drought stress and non-stress treatments. In
this study, the significant difference of N uptake
was found only between NiF3 and Ni21;
whereas, no difference was found among these
two varieties with the other three varieties.
In this study, total dry matter accumulation
had a positive correlation with stalk number,
stalk height, and stalk weight (Table 3). Tena et
al. (2016) and Silva et al. (2008) also found a
positive correlation among yield components
(stalk number, stalk height, stalk diameter and
stalk weight) and productivity under water-
shortage and normal irrigation conditions,
respectively. It is suggested that sugarcane with
high stalk number, stalk height, stalk weight, and
leaf area has high potential for high dry matter
accumulation. Moreover, because of the
correlation coefficients of stalk number and stalk
Variations in growth performance and nitrogen uptake of sugarcane cultivars under rain-fed conditions
578 Vietnam Journal of Agricultural Sciences
weight with total dry weight were almost similar
(r = 0.54** and r = 0.56**, respectively), the
difference in total dry weight among varieties of
stalk number and stalk weight type was not
noticeable. This point of view is in line with
Ehara et al. (1994). In the case of cane yield, the
most contribution came from stalk weight (r =
0.58**). In this study, both leaf dry weight and
stalk dry weight directly contributed to total plant
dry weight and cane yield with a higher
correlation coefficient of stalk dry weight (r =
0.98** and r = 0.87**) than that of dry leaf
weight (r = 0.88** and r = 0.72**) with total dry
weight and cane yield, respectively. It means that
stalk has a larger contribution to total biomass
production and cane yield than leaf. Furthermore,
another finding of this study is that there were
positive correlations between total N uptake and
total dry matter accumulation and between total
N uptake and cane yield. It agreed and supported
the suggestion of Dinh et al. (2017a) that higher
N uptake could support better biomass and yield
performance of sugarcane under both irrigation
and water shortage conditions. Under the same N
application conditions, better N uptake or N use
efficiency could support better growth and crop
yield (Acreche, 2017; Calif & Edgecombe, 2015).
Higher N use efficiency could also help plants
attain higher ability to confront water deficit (Dinh
et al., 2017a). From this study, NiF3 and Ni27
could be introduced as the promising varieties for
higher growth performance and N uptake under
rain-fed conditions.
Conclusions
The results indicated that there were no
significant reductions in the growth of sugarcane
under rain-fed conditions compared to irrigated
conditions. Under rain-fed conditions, the
genetic variation was found among twelve
sugarcane varieties in leaf area, yield
components, partial and total biomass, total
nitrogen uptake, and cane yield. The correlation
coefficients among agronomical and growth
parameters were positive and significant. Better
growth performance of sugarcane could be
supported by higher nitrogen uptake under rain-
fed conditions. NiF3 and Ni27 were the best
varieties for growth performance and nitrogen
uptake under rain-fed conditions.
References
Abayomi Y. A. (2001). Nitrogen use efficiency and drought
tolerant capacity of two commercial sugarcane
cultivars. Journal of Agricultural Science and
Technology. 9-11: 9-15.
Acreche M. M. (2017). Nitrogen-, water- and radiation-use
efficiencies affected by sugarcane breeding in
Argentina. Plant Breeding. 1-8. DOI:
10.1111/pbr.12440.
Barbosa A. M., Guidorizi K. A., Catuchi T. A., Marques T.
A., Ribeiro R. V. & Souza G. M. (2015). Biomass and
bioenergy partitioning of sugarcane plants under water
deficit. Acta Physiologiae Plantarum. 37: 142.
Basnayake J., Jackson P. A., Inman-Bamber N. G. &
Lakshmanan P. (2012). Sugarcane for water-limited
environments. Genetic variation in cane yield and sugar
content in response to water stress. Journal of
Experimental Botany. 63: 6023-6033.
Begum M. K. & Islam M. S. (2012). Effect of drought stress
on yield and yield components of sugarcane. Journal of
Agroforestry and Environment. 6: 105-109.
Calif D. & Edgecombe M. (2015). Study shows nitrogen
use efficiency trait increase biomass of sugarcane.
Retrieved from, 2017.
Dinh T. H, Kaewpradit W., Jogloy S., Vorasoot N. &
Patanothai A. (2014). Nutrient uptake of peanut
genotypes with different levels of drought tolerance
under midseason drought. Turkish Journal of
Agriculture and Forestry. 38: 495-505.
Dinh T. H., Watanabe K., Takaragawa H., Nakabaru M. &
Kawamitsu Y. (2017a). Photosynthetic response and
nitrogen use efficiency of sugarcane under drought
stress conditions with different nitrogen application
levels. Plant Production Science. 20: 412-422.
Dinh T. H., Watanabe K., Takaragawa H. & Kawamitsu Y.
(2017b). Effects of drought stress at early growth stage
on response of sugarcane to different nitrogen
application. Sugar Tech. 20: 420-430.
Dinh T. H., Takaragawa H. & Kawamitsu Y. (2018).
Nitrogen use efficiency and drought tolerant ability of
various sugarcane varieties under drought stress at
early growth stage. Plant Production Science. DOI:
10.1080/1343943X.2018.1540277.
Dinh T. H., Takaragawa H., Watanabe K., Nakabaru M. &
Kawamitsu Y. (2019). Leaf photosynthetic response to
change of soil moisture content in sugarcane. Sugar
Dinh Thai Hoang et al. (2020)
https://vjas.vnua.edu.vn/ 579
Tech. DOI:10.1007/s12355-019-00735-8.
Doorenbos J. & Pruitt W. O. (1992). Calculation of crop
water requirements. In: Crop water requirements. FAO
Irrigation and Drainage Paper No. 24 (Roma). 1-65.
Ehara H., Tsuchiya M. & Takamura T. (1994). Growth and
dry matter production of sugar cane in warm temperate
zone of Japan. Japanese Journal of Tropical
Agriculture. 38: 51-58.
Ethan S., Olagoke O. & Yunusa A. (2016). Effect of deficit
irrigation on growth and yield of sugarcane. Direct
Research Journal of Agriculture and Food Science. 4:
122-126.
FAO (2018). Chapter 2- FAO Penman-Monteith equation.
Retrieved from
/X0490E/x0490e06.htm on January 10, 2018.
Hossain M. A., Ueno M., Maeda K. & Kawamitsu Y.
(2005). Potential evapotranspiration and crop
coefficient estimates for sugarcane in Okinawa.
Journal of Agricultural Meteorology. 60: 573-576.
Jackson P., Basnayake J., Inman-Bamber N.G.,
Lakshmanan P., Natarajan S. & Stokes C. (2016).
Genetic variation in transpiration efficiency and
relationships between whole plant and leaf gas exchange
measurements in Saccharum spp. and related
germplasm. Journal of Experimental Botany. 67: 861-
871.
Jangpromma N., Songrsi P., Thammasiririak S. & Jaisil P.
(2010). Rapid assessment of chlorophyll content in
sugarcane using a SPAD chlorophyll meter across
different water stress conditions. Asian Journal of
Plant Science. 9: 368-374.
Jangpromma N., Thammasirirak S., Jaisil P. & Songsri P.
(2012). Effects of drought and recovery from drought
stress on above ground and root growth, and water use
efficiency in sugarcane (Saccharum officinarum L.).
Australian Journal of Crop Science. 6: 1298-1304.
Li C., Jackson P., Lu X., Xu C., Cai Q., Basnayake J.,
Lakshmanan P., Ghannoum O. & Fan Y. (2017).
Genotypic variation in transpiration efficiency due to
differences in photosynthetic capacity among
sugarcane-related clones. Journal of Experimental
Botany. 68: 2377-2385.
Lopes M., Araus J. L., van Heerden P. D. R. & Foyer C. H.
(2011). Enhancing drought tolerance in C4 crops.
Journal of Experimental Botany. 62: 3135- 3153.
Luo J., Pan Y. B., Xu L., Zhang Y., Zhang H., Chen R. &
Que Y. (2014). Photosynthetic and canopy
characteristics of different varieties at the early
elongation stage and their relationships with the cane
yield in sugarcane. The Scientific World Journal. DOI:
10.1155/2014/707095.
Okinawa Prefectural Government, Department of
Agriculture, Forestry and Fisheries (2015). Cultivation
Manual for Sugarcane. Retrieved from
site/norin/togyo/kibi/mobile/
documents/07saibaigoyomi.pdf on October 12, 2017.
Ranjith S. & Meinzer F. C. (1997). Physiological correlates
of variation in nitrogen-use efficiency in two contrasting
sugarcane cultivars. Crop Science. 37: 818-825.
Schroeder B. L., Salter B., Moody P. W., Skocaj D. M. &
Thorburn P. J. (2014). Evolving nature of nitrogen
management in the Australian sugar Industry. In: Bell
M. J. (Ed.). A review of nitrogen use efficiency in
sugarcane. Sugar Research Australia Ltd. eLibary pp.15-
88. Retrieved from
on December 1, 2015.
Schumann A. W., Meyer J. H. & Nair S. (1998). Evidence
for different nitrogen use efficiencies of selected
sugarcane varieties. Proceedings of South African
Sugar Technologists’ Association. 72: 77-80.
Silva M. A., Jifon J. L., Silva J. A. G. & Sharma V. (2007).
Use of physiological parameters as fast tools to screen
for drought tolerance in sugarcane. Brazilian Journal
of Plant Physiology. 19: 193-201.
Silva M. A., Silva J. A. G., Enciso J., Sharma V. & Jifon J.
(2008). Yield components as indicators of drought
tolerance of sugarcane. Scientia Agricola (Piracicaba,
Braz.). 65: 620-627.
Tena E., Mekbib F. & Ayana A. (2016). Correlation and path
coefficient analyses in sugarcane genotypes of Ethiopia.
American Journal of Plant Sciences. 7: 1490-1497.
Waclawovsky A. J., Sato P. M., Lembke C. G., Moore P. H.
& Souza G. M. (2010). Sugarcane for bioenergy
production: an assessment of yield and regulation of
sucrose content. Plant Biotechnology Journal. 8: 263-276.
Zhao D., Barry G. & Comstock J. C. (2010). Sugarcane
response to water-deficit stress during early growth on
organic and sand soils. American Journal of
Agricultural and Biological Science. 5: 403-414.
File đính kèm:
 variations_in_growth_performance_and_nitrogen_uptake_of_suga.pdf

